WPF Chart - Examples
SciChart WPF ships with hundreds of WPF Chart Examples which you can browse, play with, view the source-code and even export each WPF Chart Example to a stand-alone Visual Studio solution. All of this is possible with the new and improved SciChart WPF Examples Suite, which ships as part of the SciChart WPF SDK.
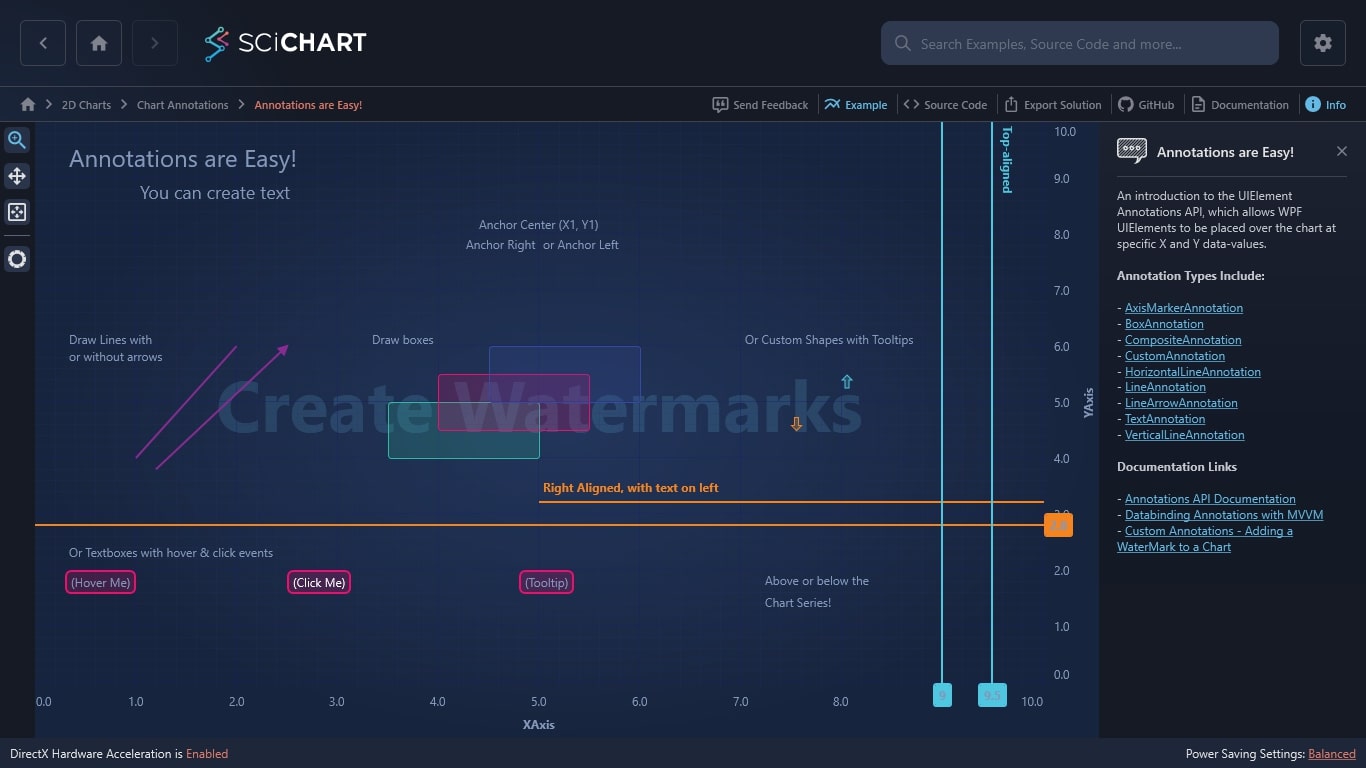
An introduction to the UIElement Annotations API, which allows WPF UIElements to be placed over the chart at specific X and Y data-values.
Annotation Types Include:
– AxisMarkerAnnotation
– BoxAnnotation
– CompositeAnnotation
– CustomAnnotation
– HorizontalLineAnnotation
– LineAnnotation
– LineArrowAnnotation
– TextAnnotation
– VerticalLineAnnotation
Documentation Links
– Annotations API Documentation
– Databinding Annotations with MVVM
– Custom Annotations – Adding a WaterMark to a Chart

The C#/WPF source code for the WPF Chart Annotations example is included below (Scroll down!).
Did you know you can also view the source code from one of the following sources as well?
- Clone the SciChart.WPF.Examples from Github.
- Or, view source in the SciChart WPF Examples suite.
- Also the SciChart WPF Trial contains the full source for the examples (link below).
AnnotationsAreEasy.xaml
View source code<UserControl x:Class="SciChart.Examples.Examples.AnnotateAChart.AnnotationsAreEasy"
xmlns="http://schemas.microsoft.com/winfx/2006/xaml/presentation"
xmlns:x="http://schemas.microsoft.com/winfx/2006/xaml"
xmlns:d="http://schemas.microsoft.com/expression/blend/2008"
xmlns:ext="http://schemas.abtsoftware.co.uk/scichart/exampleExternals"
xmlns:mc="http://schemas.openxmlformats.org/markup-compatibility/2006"
xmlns:s="http://schemas.abtsoftware.co.uk/scichart"
d:DesignHeight="400"
d:DesignWidth="600"
mc:Ignorable="d">
<Grid>
<Grid.ColumnDefinitions>
<ColumnDefinition Width="Auto" />
<ColumnDefinition Width="*" />
</Grid.ColumnDefinitions>
<!-- The SciChartInteractionToolbar adds zoom, pan, zoom extents and rotate functionality -->
<!-- to the chart and is included for example purposes. -->
<!-- If you wish to know how to zoom and pan a chart then do a search for Zoom Pan in the Examples suite! -->
<ext:SciChartInteractionToolbar TargetSurface="{Binding Source={x:Reference Name=sciChart}}"/>
<s:SciChartSurface x:Name="sciChart"
Grid.Column="1"
ClipModifierSurface="True"
Padding="0">
<s:SciChartSurface.XAxes>
<s:NumericAxis x:Name="XAxis"
AxisAlignment="Bottom"
AxisTitle="XAxis"
DrawMajorBands="False"
TextFormatting="0.0#"
VisibleRange="0, 10" />
</s:SciChartSurface.XAxes>
<s:SciChartSurface.YAxis>
<s:NumericAxis x:Name="YAxis"
AxisTitle="YAxis"
DrawMajorBands="False"
TextFormatting="0.0#" />
</s:SciChartSurface.YAxis>
<s:SciChartSurface.Annotations>
<!-- Text annotations -->
<s:TextAnnotation FontSize="24"
Text="Annotations are Easy!"
X1="0.3"
Y1="9.7" />
<s:TextAnnotation FontSize="18"
Text="You can create text"
X1="1.0"
Y1="9" />
<!-- Text with Anchor Points -->
<s:TextAnnotation HorizontalAnchorPoint="Center"
Text="Anchor Center (X1, Y1)"
VerticalAnchorPoint="Bottom"
X1="5.0"
Y1="8.0" />
<s:TextAnnotation HorizontalAnchorPoint="Right"
Text="Anchor Right"
VerticalAnchorPoint="Top"
X1="5.0"
Y1="8.0" />
<s:TextAnnotation HorizontalAnchorPoint="Left"
Text="or Anchor Left"
VerticalAnchorPoint="Top"
X1="5.0"
Y1="8.0" />
<!-- Watermark -->
<s:TextAnnotation AnnotationCanvas="BelowChart"
CoordinateMode="Relative"
FontSize="72"
FontWeight="Bold"
Foreground="#30008000"
HorizontalAnchorPoint="Center"
Text="Create Watermarks"
VerticalAnchorPoint="Center"
X1="0.5"
Y1="0.5" />
<!-- Lines and LineArrow -->
<s:TextAnnotation FontSize="12"
Text="Draw Lines with"
X1="0.3"
Y1="6.3" />
<s:LineAnnotation Stroke="#555"
StrokeThickness="2"
X1="1"
X2="2"
Y1="4"
Y2="6" />
<s:TextAnnotation FontSize="12"
Text="or without arrows"
X1="0.3"
Y1="6.0" />
<s:LineArrowAnnotation Stroke="#555"
StrokeThickness="2"
X1="1.2"
X2="2.5"
Y1="3.8"
Y2="6" />
<!-- Boxes -->
<s:TextAnnotation FontSize="12"
Text="Draw boxes"
X1="3.3"
Y1="6.3" />
<s:BoxAnnotation Background="#55279B27"
BorderBrush="#279B27"
BorderThickness="1"
CornerRadius="3"
X1="3.5"
X2="5"
Y1="4"
Y2="5" />
<s:BoxAnnotation Background="#55FF1919"
BorderBrush="#FF1919"
BorderThickness="1"
CornerRadius="3"
X1="4"
X2="5.5"
Y1="4.5"
Y2="5.5" />
<s:BoxAnnotation Background="#551964FF"
BorderBrush="#1964FF"
BorderThickness="1"
CornerRadius="3"
X1="4.5"
X2="6"
Y1="5"
Y2="6" />
<!-- Custom Shapes using Path -->
<s:TextAnnotation FontSize="12"
Text="Or Custom Shapes with Tooltips"
X1="7"
Y1="6.3" />
<s:CustomAnnotation X1="8" Y1="5.5">
<Path Data="m 4 14 4 0 0 -8 3 0 -5 -5 -5 5 3 0 z"
Fill="#571CB61C"
Stroke="#FF00B400"
StrokeThickness="1" />
</s:CustomAnnotation>
<s:CustomAnnotation Margin="0,15,0,0"
X1="7.5"
Y1="5">
<Path Data="m 3.5 0.5 4 0 0 8 3 0 -5 5 -5 -5 3 0 z"
Fill="#57B22020"
Stroke="#FF990000"
StrokeThickness="1" />
</s:CustomAnnotation>
<!-- Horizontal Lines -->
<s:HorizontalLineAnnotation HorizontalAlignment="Right"
FontSize="12"
FontWeight="Bold"
LabelPlacement="TopLeft"
LabelValue="Right Aligned, with text on left"
ShowLabel="True"
Stroke="Orange"
StrokeThickness="2"
X1="5"
Y1="3.2" />
<s:HorizontalLineAnnotation HorizontalAlignment="Stretch"
FontSize="12"
FontWeight="Bold"
LabelPlacement="Axis"
ShowLabel="True"
Stroke="Orange"
StrokeThickness="2"
X1="7"
Y1="2.8" />
<!-- Vertical Lines -->
<s:VerticalLineAnnotation VerticalAlignment="Stretch"
FontSize="12"
FontWeight="Bold"
ShowLabel="True"
Stroke="Brown"
StrokeThickness="2"
X1="9"
Y1="4" />
<s:VerticalLineAnnotation VerticalAlignment="Stretch"
FontSize="12"
FontWeight="Bold"
ShowLabel="True"
Stroke="Brown"
StrokeThickness="2"
X1="9.5"
Y1="3">
<s:AnnotationLabel LabelPlacement="TopRight" Text="Top-aligned" />
</s:VerticalLineAnnotation>
<!-- Events and Interaction -->
<s:TextAnnotation FontSize="12"
Text="Or Textboxes with hover & click events"
X1="0.3"
Y1="2.5" />
<s:TextAnnotation Background="#87B22020"
BorderBrush="#990000"
BorderThickness="2"
CornerRadius="5"
Foreground="White"
MouseEnter="TextAnnotation1_MouseEnter"
Text="(Hover Me)"
X1="0.3"
X2="2.3"
Y1="2.0"
Y2="1.0" />
<s:TextAnnotation Background="#87B22020"
BorderBrush="#990000"
BorderThickness="2"
CornerRadius="5"
Foreground="White"
MouseLeftButtonDown="TextAnnotation2_MouseClick"
Text="(Click Me)"
X1="2.5"
X2="4.5"
Y1="2.0"
Y2="1.0" />
<s:TextAnnotation Background="#87B22020"
BorderBrush="#990000"
BorderThickness="2"
CornerRadius="5"
Foreground="White"
Text="(Tooltip)"
ToolTipService.ToolTip="Tah-dah! I have a tooltip"
X1="4.8"
X2="6.8"
Y1="2.0"
Y2="1.0" />
<s:TextAnnotation Text="Above or below the"
X1="7.2"
Y1="2.0" />
<s:TextAnnotation Text="Chart Series!"
X1="7.2"
Y1="1.6" />
</s:SciChartSurface.Annotations>
</s:SciChartSurface>
</Grid>
</UserControl>AnnotationsAreEasy.xaml.cs
View source code// *************************************************************************************
// SCICHART® Copyright SciChart Ltd. 2011-2022. All rights reserved.
//
// Web: http://www.scichart.com
// Support: support@scichart.com
// Sales: sales@scichart.com
//
// AnnotationsAreEasy.xaml.cs is part of the SCICHART® Examples. Permission is hereby granted
// to modify, create derivative works, distribute and publish any part of this source
// code whether for commercial, private or personal use.
//
// The SCICHART® examples are distributed in the hope that they will be useful, but
// without any warranty. It is provided "AS IS" without warranty of any kind, either
// expressed or implied.
// *************************************************************************************
using System;
using System.Windows;
using System.Windows.Controls;
using System.Windows.Input;
using SciChart.Charting.Common.Helpers;
using SciChart.Charting.Visuals.Annotations;
using SciChart.Data.Model;
namespace SciChart.Examples.Examples.AnnotateAChart
{
public partial class AnnotationsAreEasy : UserControl
{
public AnnotationsAreEasy()
{
InitializeComponent();
sciChart.AnimateZoomExtentsCommand = new ActionCommand(OnZoomExtents);
sciChart.MouseDoubleClick += OnSciChartMouseDoubleClick;
}
private void OnSciChartMouseDoubleClick(object sender, MouseButtonEventArgs mouseButtonEventArgs)
{
OnZoomExtents();
}
private void TextAnnotation2_MouseClick(object sender, MouseEventArgs e)
{
((TextAnnotation) sender).Text = "Clicked!";
}
private void TextAnnotation1_MouseEnter(object sender, MouseEventArgs e)
{
((TextAnnotation)sender).Text = "Hovered!";
}
private void OnZoomExtents()
{
var range = new DoubleRange(0, 10);
XAxis.AnimateVisibleRangeTo(range, TimeSpan.FromMilliseconds(500));
YAxis.AnimateVisibleRangeTo(range, TimeSpan.FromMilliseconds(500));
}
}
}
