
The AxisMarkerAnnotation Type
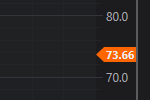 The AxisMarkerAnnotation draws a marker or label at a specific Y-value on a YAxis.
It is used within SciChart by the SeriesValueModifier which displays the latest series values on the YAxis. It can also be used as a stand-alone annotation.
Declaring an AxisMarkerAnnotation in XAML
To declare an AxisMarkerAnnotation on the YAxis, use the following code:
| Declaring an AxisMarkerAnnotation |
Copy Code |
|---|---|
<SciChartSurface> <s:SciChartSurface.YAxis> <s:NumericAxis/> </s:SciChartSurface.YAxis> <s:SciChartSurface.XAxis> <s:NumericAxis/> </s:SciChartSurface.XAxis> <SciChartSurface.Annotations> <!-- Also optionally set YAxis ID in multiple axis scenarios--> <s:AxisMarkerAnnotation Background="#FF6600" FontSize="11" FontWeight="Bold" Foreground="#EEE" IsEditable="true" Y1="32.7" /> </SciChartSurface.Annotations> </SciChartSurface> | |
Declaring an AxisMarkerAnnotation in Code
To declare an AxisMarkerAnnotation in code-behind, use the following C# code:
| Declaring an AxisMarkerAnnotation |
Copy Code |
|---|---|
var sciChartSurface = new SciChartSurface(); sciChartSurface.YAxis = new NumericAxis(); sciChartSurface.XAxis = new NumericAxis(); sciChartSurface.Annotations.Add(new AxisMarkerAnnotation() { FontSize = 11, Foreground = new SolidColorBrush(Colors.White), IsEditable = true, Y1 = 32.7, }); | |
Styling the AxisMarkerAnnotation
The properties AxisMarkerAnnotation.BorderBrush and AxisMarkerAnnotation.Background changes the border and background of the AxisMarkerAnnotation respectively.
AxisMarkerAnnotation.Foreground changes the text label color.
Templating the AxisMarkerAnnotation
To template the AxisMarkerAnnotation, you can use the following code:
| Templating the AxisMarkerAnnotation |
Copy Code |
|---|---|
<DataTemplate x:Key="AxisMarkerTemplate" DataType="r:AxisInfo"> <Border Background="{Binding Background, RelativeSource={RelativeSource AncestorType=a:AxisMarkerAnnotation}}" BorderBrush="{Binding BorderBrush, RelativeSource={RelativeSource AncestorType=a:AxisMarkerAnnotation}}" BorderThickness="0,1,0,1"> <TextBlock Margin="{Binding Padding, RelativeSource={RelativeSource AncestorType=a:AxisMarkerAnnotation}}" VerticalAlignment="Center" FontSize="{Binding FontSize, RelativeSource={RelativeSource AncestorType=a:AxisMarkerAnnotation}}" Foreground="{Binding Foreground, RelativeSource={RelativeSource AncestorType=a:AxisMarkerAnnotation}}" Text="{Binding FormattedValue, RelativeSource={RelativeSource AncestorType=a:AxisMarkerAnnotation}}" /> </Border> </DataTemplate> <DataTemplate x:Key="DefaultAxisPointerTemplate"> <Path HorizontalAlignment="Right" VerticalAlignment="Stretch" Data="m 0 10 -4 -5 4 -5 z" Fill="{Binding RelativeSource={RelativeSource AncestorType=a:AxisMarkerAnnotation}, Path=Background}" Stretch="Fill" Stroke="{Binding RelativeSource={RelativeSource AncestorType=a:AxisMarkerAnnotation}, Path=Background}" StrokeEndLineCap="Round" StrokeLineJoin="Round" StrokeStartLineCap="Round" StrokeThickness="1" /> </DataTemplate> <AxisMarkerAnnotation LabelTemplate="{StaticResource AxisMarkerTemplate}" PointerTemplate="{StaticResource DefaultAxisPointerTemplate}" FormattedValue="{Binding AxisInfo.AxisFormattedDataValue, RelativeSource={RelativeSource Self}}" /> | |