WPF Chart - Examples
SciChart WPF ships with hundreds of WPF Chart Examples which you can browse, play with, view the source-code and even export each WPF Chart Example to a stand-alone Visual Studio solution. All of this is possible with the new and improved SciChart WPF Examples Suite, which ships as part of the SciChart WPF SDK.
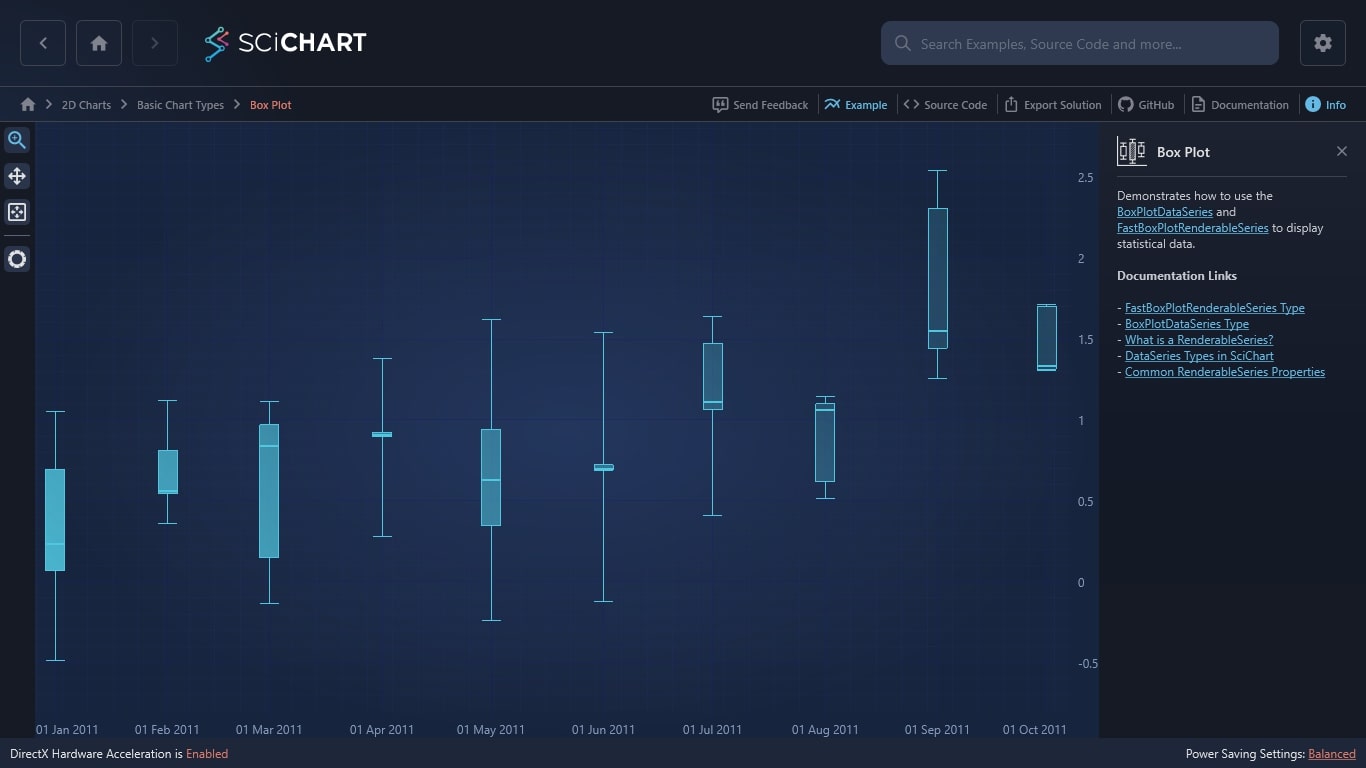
Demonstrates how to use the BoxPlotDataSeries and FastBoxPlotRenderableSeries to display statistical data. View our WPF chart library for more WPF charts.
Documentation Links
– FastBoxPlotRenderableSeries Type
– BoxPlotDataSeries Type
– What is a RenderableSeries?
– DataSeries Types in SciChart
– Common RenderableSeries Properties

The C#/WPF source code for the WPF Chart Box Plot example is included below (Scroll down!).
Did you know you can also view the source code from one of the following sources as well?
- Clone the SciChart.WPF.Examples from Github.
- Or, view source in the SciChart WPF Examples suite.
- Also the SciChart WPF Trial contains the full source for the examples (link below).
BoxPlotExampleView.xaml
View source code<UserControl x:Class="SciChart.Examples.Examples.CreateSimpleChart.BoxPlotExampleView"
xmlns="http://schemas.microsoft.com/winfx/2006/xaml/presentation"
xmlns:x="http://schemas.microsoft.com/winfx/2006/xaml"
xmlns:d="http://schemas.microsoft.com/expression/blend/2008"
xmlns:ext="http://schemas.abtsoftware.co.uk/scichart/exampleExternals"
xmlns:mc="http://schemas.openxmlformats.org/markup-compatibility/2006"
xmlns:s="http://schemas.abtsoftware.co.uk/scichart"
d:DesignHeight="400"
d:DesignWidth="600"
mc:Ignorable="d">
<Grid>
<Grid.Resources>
<LinearGradientBrush x:Key="BoxFill" StartPoint="0,0" EndPoint="0.5,1">
<GradientStop Offset="0" Color="White" />
<GradientStop Offset="1" Color="LightSteelBlue" />
</LinearGradientBrush>
</Grid.Resources>
<Grid.ColumnDefinitions>
<ColumnDefinition Width="Auto" />
<ColumnDefinition Width="*" />
</Grid.ColumnDefinitions>
<!-- The SciChartInteractionToolbar adds zoom, pan, zoom extents and rotate functionality -->
<!-- to the chart and is included for example purposes. -->
<!-- If you wish to know how to zoom and pan a chart then do a search for Zoom Pan in the Examples suite! -->
<ext:SciChartInteractionToolbar TargetSurface="{Binding Source={x:Reference Name=sciChart}}" />
<s:SciChartSurface x:Name="sciChart"
Grid.Column="1"
BorderThickness="0"
Padding="0">
<s:SciChartSurface.RenderableSeries>
<s:FastBoxPlotRenderableSeries x:Name="boxSeries"
Fill="{StaticResource BoxFill}"
Stroke="SteelBlue">
<s:FastBoxPlotRenderableSeries.SeriesAnimation>
<s:ScaleAnimation AnimationDelay="0:0:1" Duration="0:0:2" ZeroLine="-2" />
</s:FastBoxPlotRenderableSeries.SeriesAnimation>
</s:FastBoxPlotRenderableSeries>
</s:SciChartSurface.RenderableSeries>
<s:SciChartSurface.XAxis>
<s:DateTimeAxis DrawMajorBands="True" GrowBy="0.01, 0.01" />
</s:SciChartSurface.XAxis>
<s:SciChartSurface.YAxis>
<s:NumericAxis DrawMajorBands="True" GrowBy="0.1, 0.1" />
</s:SciChartSurface.YAxis>
<s:SciChartSurface.ChartModifier>
<s:ModifierGroup>
<s:XAxisDragModifier />
<s:YAxisDragModifier />
<s:ZoomExtentsModifier ExecuteOn="MouseDoubleClick" />
</s:ModifierGroup>
</s:SciChartSurface.ChartModifier>
</s:SciChartSurface>
</Grid>
</UserControl>
BoxPlotExampleView.xaml.cs
View source code// *************************************************************************************
// SCICHART® Copyright SciChart Ltd. 2011-2022. All rights reserved.
//
// Web: http://www.scichart.com
// Support: support@scichart.com
// Sales: sales@scichart.com
//
// BoxPlotExampleView.xaml.cs is part of the SCICHART® Examples. Permission is hereby granted
// to modify, create derivative works, distribute and publish any part of this source
// code whether for commercial, private or personal use.
//
// The SCICHART® examples are distributed in the hope that they will be useful, but
// without any warranty. It is provided "AS IS" without warranty of any kind, either
// expressed or implied.
// *************************************************************************************
using System;
using System.Collections.Generic;
using System.Linq;
using System.Windows.Controls;
using SciChart.Charting.Model.DataSeries;
using SciChart.Examples.ExternalDependencies.Data;
namespace SciChart.Examples.Examples.CreateSimpleChart
{
/// <summary>
/// Interaction logic for BoxPlotExampleView.xaml
/// </summary>
public partial class BoxPlotExampleView : UserControl
{
public BoxPlotExampleView()
{
InitializeComponent();
this.Loaded += (sender, args) =>
{
// Box data is a multi-dimensional table containing minimum, lower quartile, median, upper quartile, maximum Y values vs X
IEnumerable<BoxPoint> boxData = GetBoxPlotData(10).ToArray();
var boxDataSeries = new BoxPlotDataSeries<DateTime, double>();
boxDataSeries.Append(boxData.Select(x => x.Date),
boxData.Select(x => x.Median),
boxData.Select(x => x.Minimum),
boxData.Select(x => x.LowerQuartile),
boxData.Select(x => x.UpperQuartile),
boxData.Select(x => x.Maximum));
boxSeries.DataSeries = boxDataSeries;
};
sciChart.ZoomExtents();
}
private IEnumerable<BoxPoint> GetBoxPlotData(int count)
{
var dates = Enumerable.Range(0, count).Select(i => new DateTime(2011, 01, 01).AddMonths(i)).ToArray();
var medianValues = new RandomWalkGenerator(0).GetRandomWalkSeries(count).YData;
var random = new Random(0);
for (int i = 0; i < count; i++)
{
double med = medianValues[i];
double min = med - random.NextDouble();
double max = med + random.NextDouble();
double lower = (med - min)*random.NextDouble() + min;
double upper = (max - med)*random.NextDouble() + med;
yield return new BoxPoint(dates[i], min, lower, med, upper, max);
}
}
private struct BoxPoint
{
public readonly DateTime Date;
public readonly double Minimum;
public readonly double LowerQuartile;
public readonly double Median;
public readonly double UpperQuartile;
public readonly double Maximum;
public BoxPoint(DateTime date, double min, double lower, double med, double upper, double max)
: this()
{
Date = date;
Minimum = min;
LowerQuartile = lower;
Median = med;
UpperQuartile = upper;
Maximum = max;
}
}
}
}
