WPF Chart - Examples
SciChart WPF ships with hundreds of WPF Chart Examples which you can browse, play with, view the source-code and even export each WPF Chart Example to a stand-alone Visual Studio solution. All of this is possible with the new and improved SciChart WPF Examples Suite, which ships as part of the SciChart WPF SDK.
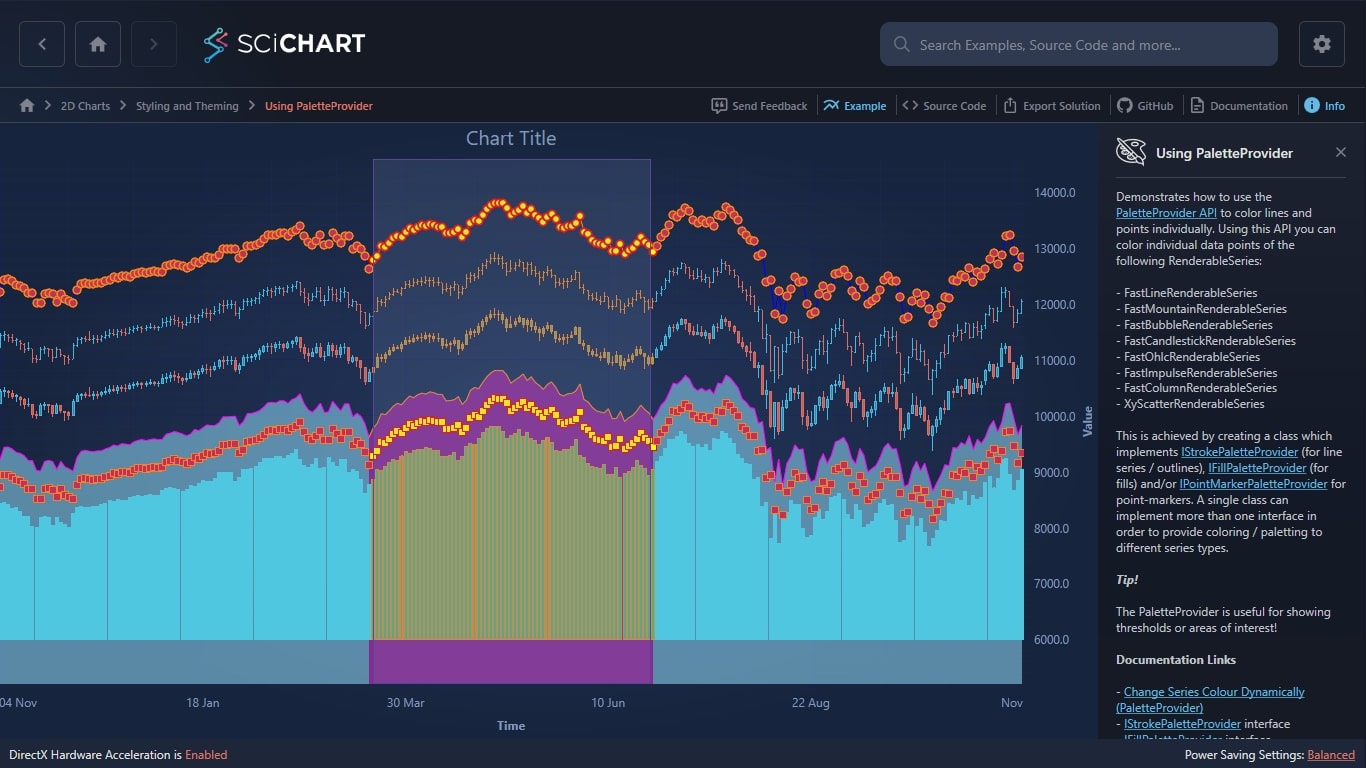
Demonstrates how to use the PaletteProvider API to color lines and points individually. Using this API you can color individual data points of the following RenderableSeries:
– FastLineRenderableSeries
– FastMountainRenderableSeries
– FastBubbleRenderableSeries
– FastCandlestickRenderableSeries
– FastOhlcRenderableSeries
– FastImpulseRenderableSeries
– FastColumnRenderableSeries
– XyScatterRenderableSeries
This is achieved by creating a class which implements IStrokePaletteProvider (for line series / outlines), IFillPaletteProvider (for fills) and/or IPointMarkerPaletteProvider for point-markers. A single class can implement more than one interface in order to provide coloring / paletting to different series types.
Tip!
The PaletteProvider is useful for showing thresholds or areas of interest!
Documentation Links
– Change Series Colour Dynamically (PaletteProvider)
– IStrokePaletteProvider Interface
– IFillPaletteProvider interface
– IPointMarkerPaletteProvider interface
– BaseRenderableSeries.PaletteProvider Property

The C#/WPF source code for the WPF Chart Using PaletteProvider example is included below (Scroll down!).
Did you know you can also view the source code from one of the following sources as well?
- Clone the SciChart.WPF.Examples from Github.
- Or, view source in the SciChart WPF Examples suite.
- Also the SciChart WPF Trial contains the full source for the examples (link below).
UsePaletteProvider.xaml
View source code<UserControl x:Class="SciChart.Examples.Examples.StyleAChart.UsePaletteProvider.UsePaletteProvider"
xmlns="http://schemas.microsoft.com/winfx/2006/xaml/presentation"
xmlns:x="http://schemas.microsoft.com/winfx/2006/xaml"
xmlns:d="http://schemas.microsoft.com/expression/blend/2008"
xmlns:local="clr-namespace:SciChart.Examples.Examples.StyleAChart.UsePaletteProvider"
xmlns:mc="http://schemas.openxmlformats.org/markup-compatibility/2006"
xmlns:s="http://schemas.abtsoftware.co.uk/scichart"
d:DesignHeight="400"
d:DesignWidth="600"
mc:Ignorable="d">
<Grid>
<Grid.Resources>
<s:ModifierGroup x:Key="Modifiers">
<s:MouseWheelZoomModifier />
<s:YAxisDragModifier />
<s:XAxisDragModifier />
<s:ZoomPanModifier ExecuteOn="MouseRightButton" />
<s:ZoomExtentsModifier />
<local:AreaSelectionModifier ReceiveHandledEvents="True" />
</s:ModifierGroup>
<s:SquarePointMarker x:Key="SquarePointMarker"
Width="8"
Height="8"
Fill="Red"
Stroke="Orange"
StrokeThickness="1" />
<s:EllipsePointMarker x:Key="EllipsePointMarker"
Width="10"
Height="10"
Fill="Red"
Stroke="Orange"
StrokeThickness="2" />
<local:StrokeFillPaletteProvider x:Key="StrokeFillPaletteProvider"
AreaSelection="{Binding [AreaSelectionModifier].AreaSelection,
Mode=OneWay,
Source={StaticResource Modifiers}}"
FillBrushOverride="Yellow"
PointMarkerFillOverride="Yellow"
PointMarkerStrokeOverride="Red"
StrokeOverride="Red" />
<local:StrokeFillPaletteProvider x:Key="StrokeFillMountainPaletteProvider"
AreaSelection="{Binding [AreaSelectionModifier].AreaSelection,
Mode=OneWay,
Source={StaticResource Modifiers}}"
FillBrushOverride="Purple"
StrokeOverride="Red" />
</Grid.Resources>
<s:SciChartSurface x:Name="sciChart"
ChartModifier="{StaticResource Modifiers}"
ChartTitle="Chart Title"
RenderableSeries="{s:SeriesBinding ChartSeriesViewModels}">
<s:SciChartSurface.Resources>
<Style x:Key="ScatterSeriesStyle" TargetType="s:XyScatterRenderableSeries">
<Setter Property="PointMarker" Value="{StaticResource SquarePointMarker}" />
<Setter Property="PaletteProvider" Value="{StaticResource StrokeFillPaletteProvider}" />
</Style>
<Style x:Key="ColumnSeriesStyle" TargetType="s:FastColumnRenderableSeries">
<Setter Property="DataPointWidth" Value="0.8" />
<Setter Property="Stroke" Value="Blue" />
<Setter Property="ZeroLineY" Value="6000" />
<Setter Property="Fill" Value="Blue" />
<Setter Property="PaletteProvider" Value="{StaticResource StrokeFillPaletteProvider}" />
</Style>
<Style x:Key="CandlestickSeriesStyle" TargetType="s:FastCandlestickRenderableSeries">
<Setter Property="PaletteProvider" Value="{StaticResource StrokeFillPaletteProvider}" />
</Style>
<Style x:Key="OhlcSeriesStyle" TargetType="s:FastOhlcRenderableSeries">
<Setter Property="PaletteProvider" Value="{StaticResource StrokeFillPaletteProvider}" />
</Style>
<Style x:Key="LineSeriesStyle" TargetType="s:FastLineRenderableSeries">
<Setter Property="Stroke" Value="Blue" />
<Setter Property="PointMarker" Value="{StaticResource EllipsePointMarker}" />
<Setter Property="PaletteProvider" Value="{StaticResource StrokeFillPaletteProvider}" />
</Style>
<Style x:Key="MountainSeriesStyle" TargetType="s:FastMountainRenderableSeries">
<Setter Property="Fill" Value="#9787CEEB" />
<Setter Property="Stroke" Value="Magenta" />
<Setter Property="PaletteProvider" Value="{StaticResource StrokeFillMountainPaletteProvider}" />
</Style>
</s:SciChartSurface.Resources>
<s:SciChartSurface.XAxis>
<s:CategoryDateTimeAxis AxisTitle="Time" />
</s:SciChartSurface.XAxis>
<s:SciChartSurface.YAxes>
<s:NumericAxis AxisTitle="Value" TextFormatting="#.0">
<s:NumericAxis.GrowBy>
<s:DoubleRange Max="0.1" Min="0.1" />
</s:NumericAxis.GrowBy>
</s:NumericAxis>
</s:SciChartSurface.YAxes>
</s:SciChartSurface>
</Grid>
</UserControl>
UsePaletteProvider.xaml.cs
View source code// *************************************************************************************
// SCICHART® Copyright SciChart Ltd. 2011-2022. All rights reserved.
//
// Web: http://www.scichart.com
// Support: support@scichart.com
// Sales: sales@scichart.com
//
// UsePaletteProvider.xaml.cs is part of the SCICHART® Examples. Permission is hereby granted
// to modify, create derivative works, distribute and publish any part of this source
// code whether for commercial, private or personal use.
//
// The SCICHART® examples are distributed in the hope that they will be useful, but
// without any warranty. It is provided "AS IS" without warranty of any kind, either
// expressed or implied.
// *************************************************************************************
using System.Windows.Controls;
namespace SciChart.Examples.Examples.StyleAChart.UsePaletteProvider
{
/// <summary>
/// Interaction logic for UsingOfPaletteProvider.xaml
/// </summary>
public partial class UsePaletteProvider : UserControl
{
public UsePaletteProvider()
{
InitializeComponent();
}
}
}
UsePaletteProviderViewModel.cs
View source code// *************************************************************************************
// SCICHART® Copyright SciChart Ltd. 2011-2022. All rights reserved.
//
// Web: http://www.scichart.com
// Support: support@scichart.com
// Sales: sales@scichart.com
//
// UsePaletteProviderViewModel.cs is part of the SCICHART® Examples. Permission is hereby granted
// to modify, create derivative works, distribute and publish any part of this source
// code whether for commercial, private or personal use.
//
// The SCICHART® examples are distributed in the hope that they will be useful, but
// without any warranty. It is provided "AS IS" without warranty of any kind, either
// expressed or implied.
// *************************************************************************************
using System;
using System.Collections.Generic;
using SciChart.Charting.Model.ChartSeries;
using SciChart.Charting.Model.DataSeries;
using SciChart.Examples.ExternalDependencies.Common;
using SciChart.Examples.ExternalDependencies.Data;
namespace SciChart.Examples.Examples.StyleAChart.UsePaletteProvider
{
public class UsePaletteProviderViewModel : BaseViewModel
{
private readonly List<IRenderableSeriesViewModel> _chartSeriesViewModels;
public UsePaletteProviderViewModel()
{
// In the MvvmSciChartSurface, we don't have to create a dataset. Just create DataSeries and append as usual
var dataSeries0 = new XyDataSeries<DateTime, double>();
var dataSeries1 = new XyDataSeries<DateTime, double>();
var dataSeries2 = new OhlcDataSeries<DateTime, double>();
var dataSeries3 = new OhlcDataSeries<DateTime, double>();
var dataSeries4 = new XyDataSeries<DateTime, double>();
var dataSeries5 = new XyDataSeries<DateTime, double>();
var dataSource = DataManager.Instance;
// Prices are in the format Time, Open, High, Low, Close (all IList)
var prices = dataSource.GetPriceData(Instrument.Indu.Value, TimeFrame.Daily);
var dataOffset = -1000;
// Append data to series
dataSeries0.Append(prices.TimeData, dataSource.Offset(prices.OpenData, dataOffset * 2));
dataSeries1.Append(prices.TimeData, dataSource.Offset(prices.OpenData, -dataOffset));
dataSeries2.Append(prices.TimeData, prices.OpenData, prices.HighData, prices.LowData, prices.CloseData);
dataSeries3.Append(prices.TimeData, dataSource.Offset(prices.OpenData, dataOffset),
dataSource.Offset(prices.HighData, dataOffset),
dataSource.Offset(prices.LowData, dataOffset),
dataSource.Offset(prices.CloseData, dataOffset));
dataSeries4.Append(prices.TimeData, dataSource.Offset(prices.CloseData, dataOffset*3));
dataSeries5.Append(prices.TimeData, dataSource.Offset(prices.OpenData, dataOffset * 2.5));
// Add the DataSeries / RenderableSeries to the ChartSeriesViewModel collection
// These are paired so if you want to remove the series, just remove the viewmodel (it will remove the data and renderable series)
// Or, if you want to change the RenderableSeries properties, just update the RenderSeries on the ChartSeriesViewModel
var mountainSeriesVm = new MountainRenderableSeriesViewModel
{
DataSeries = dataSeries0,
StyleKey = "MountainSeriesStyle"
};
var lineSeriesVm = new LineRenderableSeriesViewModel
{
DataSeries = dataSeries1,
StyleKey = "LineSeriesStyle"
};
var ohlcSeriesVm = new OhlcRenderableSeriesViewModel
{
DataSeries = dataSeries2,
StyleKey = "OhlcSeriesStyle"
};
var candlestickSeriesVm = new CandlestickRenderableSeriesViewModel
{
DataSeries = dataSeries3,
StyleKey = "CandlestickSeriesStyle"
};
var columnSeriesVm = new ColumnRenderableSeriesViewModel
{
DataSeries = dataSeries4,
StyleKey = "ColumnSeriesStyle"
};
var scatterSeriesVm = new XyScatterRenderableSeriesViewModel
{
DataSeries = dataSeries5,
StyleKey = "ScatterSeriesStyle"
};
_chartSeriesViewModels = new List<IRenderableSeriesViewModel>
{
mountainSeriesVm,
lineSeriesVm,
ohlcSeriesVm,
candlestickSeriesVm,
columnSeriesVm,
scatterSeriesVm
};
}
public List<IRenderableSeriesViewModel> ChartSeriesViewModels
{
get { return _chartSeriesViewModels; }
}
}
}
SelectedRangePaletteProviderBase.cs
View source code// *************************************************************************************
// SCICHART® Copyright SciChart Ltd. 2011-2022. All rights reserved.
//
// Web: http://www.scichart.com
// Support: support@scichart.com
// Sales: sales@scichart.com
//
// SelectedRangePaletteProviderBase.cs is part of the SCICHART® Examples. Permission is hereby granted
// to modify, create derivative works, distribute and publish any part of this source
// code whether for commercial, private or personal use.
//
// The SCICHART® examples are distributed in the hope that they will be useful, but
// without any warranty. It is provided "AS IS" without warranty of any kind, either
// expressed or implied.
// *************************************************************************************
using System;
using System.Collections.Generic;
using System.Windows;
using System.Windows.Media;
using SciChart.Charting.Model.DataSeries;
using SciChart.Charting.Visuals.PaletteProviders;
using SciChart.Charting.Visuals.RenderableSeries;
namespace SciChart.Examples.Examples.StyleAChart.UsePaletteProvider
{
public class SelectedRangePaletteProviderBase: DependencyObject, IPaletteProvider
{
public static readonly DependencyProperty AreaSelectionProperty =
DependencyProperty.Register("AreaSelection", typeof (AreaSelection),
typeof (SelectedRangePaletteProviderBase), new PropertyMetadata(null));
public Color? PointMarkerStrokeOverride { get; set; }
public Color? PointMarkerFillOverride { get; set; }
public Color StrokeOverride { get; set; }
public AreaSelection AreaSelection
{
get { return (AreaSelection)GetValue(AreaSelectionProperty); }
set { SetValue(AreaSelectionProperty, value); }
}
protected bool IsColorOverridden(double xValue)
{
return AreaSelection != null && AreaSelection.Contains(xValue);
}
public void OnBeginSeriesDraw(IRenderableSeries series) { }
}
}
StrokeFillPaletteProvider.cs
View source code// *************************************************************************************
// SCICHART® Copyright SciChart Ltd. 2011-2022. All rights reserved.
//
// Web: http://www.scichart.com
// Support: support@scichart.com
// Sales: sales@scichart.com
//
// StrokeFillPaletteProvider.cs is part of the SCICHART® Examples. Permission is hereby granted
// to modify, create derivative works, distribute and publish any part of this source
// code whether for commercial, private or personal use.
//
// The SCICHART® examples are distributed in the hope that they will be useful, but
// without any warranty. It is provided "AS IS" without warranty of any kind, either
// expressed or implied.
// *************************************************************************************
using System;
using System.Collections.Generic;
using System.Linq;
using System.Text;
using System.Windows.Media;
using SciChart.Charting.Model.DataSeries;
using SciChart.Charting.Visuals.PaletteProviders;
using SciChart.Charting.Visuals.RenderableSeries;
using SciChart.Core.Extensions;
namespace SciChart.Examples.Examples.StyleAChart.UsePaletteProvider
{
public class StrokeFillPaletteProvider : SelectedRangePaletteProviderBase, IStrokePaletteProvider, IFillPaletteProvider, IPointMarkerPaletteProvider
{
private PointPaletteInfo _pointMarkerColorOverrides = new PointPaletteInfo();
public Brush FillBrushOverride { get; set; }
public Brush OverrideFillBrush(IRenderableSeries series, int index, IPointMetadata metadata)
{
var isOverridden = IsColorOverridden(index);
if (isOverridden)
{
return FillBrushOverride;
}
return null;
}
public Color? OverrideStrokeColor(IRenderableSeries series, int index, IPointMetadata metadata)
{
var isOverridden = IsColorOverridden(index);
if (isOverridden)
{
return StrokeOverride;
}
return null;
}
public PointPaletteInfo? OverridePointMarker(IRenderableSeries series, int index, IPointMetadata metadata)
{
var isOverridden = IsColorOverridden(index);
if (isOverridden)
{
_pointMarkerColorOverrides.Fill = PointMarkerFillOverride;
_pointMarkerColorOverrides.Stroke = PointMarkerStrokeOverride;
return _pointMarkerColorOverrides;
}
return null;
}
}
}
AreaSelectionModifier.cs
View source code// *************************************************************************************
// SCICHART® Copyright SciChart Ltd. 2011-2022. All rights reserved.
//
// Web: http://www.scichart.com
// Support: support@scichart.com
// Sales: sales@scichart.com
//
// AreaSelectionModifier.cs is part of the SCICHART® Examples. Permission is hereby granted
// to modify, create derivative works, distribute and publish any part of this source
// code whether for commercial, private or personal use.
//
// The SCICHART® examples are distributed in the hope that they will be useful, but
// without any warranty. It is provided "AS IS" without warranty of any kind, either
// expressed or implied.
// *************************************************************************************
using System.Windows;
using SciChart.Charting.ChartModifiers;
using SciChart.Charting.Model.DataSeries;
using SciChart.Charting.Visuals;
using SciChart.Charting.Visuals.Axes;
using SciChart.Core.Utility.Mouse;
namespace SciChart.Examples.Examples.StyleAChart.UsePaletteProvider
{
public class AreaSelectionModifier : RubberBandXyZoomModifier
{
/// <summary>
/// Defines the Ellipse dependency property
/// </summary>
public static readonly DependencyProperty SelectionProperty = DependencyProperty.Register("AreaSelection", typeof(AreaSelection), typeof(AreaSelectionModifier), new PropertyMetadata(null));
/// <summary>Defines the YAxisId DependencyProperty</summary>
public static readonly DependencyProperty YAxisIdProperty = DependencyProperty.Register("YAxisId", typeof(string), typeof(AreaSelectionModifier), new PropertyMetadata(AxisCore.DefaultAxisId));
private bool _isDragging;
private Point _startPoint;
private Rect _rectangle;
/// <summary>
/// Initializes a new instance of the <see cref="AreaSelectionModifier"/> class.
/// </summary>
public AreaSelectionModifier()
{
IsXAxisOnly = true;
}
public AreaSelection AreaSelection
{
get { return (AreaSelection)GetValue(SelectionProperty); }
set { SetValue(SelectionProperty, value); }
}
/// <summary>
/// Gets or sets the ID of the Y-Axis which this Annotation is measured against
/// </summary>
public string YAxisId
{
get { return (string)GetValue(YAxisIdProperty); }
set { SetValue(YAxisIdProperty, value); }
}
/// <summary>
/// Called when the Chart Modifier is attached to the Chart Surface
/// </summary>
/// <remarks></remarks>
public override void OnAttached()
{
base.OnAttached();
ClearReticule();
}
/// <summary>
/// Called when the Chart Modifier is detached from the Chart Surface
/// </summary>
/// <remarks></remarks>
public override void OnDetached()
{
base.OnDetached();
ClearReticule();
}
/// <summary>
/// Called when a Mouse Button is pressed on the parent <see cref="SciChartSurface"/>
/// </summary>
/// <param name="e">Arguments detailing the mouse button operation</param>
/// <remarks></remarks>
public override void OnModifierMouseDown(ModifierMouseArgs e)
{
base.OnModifierMouseDown(e);
if (_isDragging || !MatchesExecuteOn(e.MouseButtons, ExecuteOn))
return;
// Exit if the mouse down was outside the bounds of the ModifierSurface
if (e.IsMaster && !ModifierSurface.GetBoundsRelativeTo(ModifierSurface).Contains(e.MousePoint))
return;
e.Handled = true;
ModifierSurface.CaptureMouse();
// Translate the mouse point (which is in RootGrid coordiantes) relative to the ModifierSurface
// This accounts for any offset due to left Y-Axis
Point ptTrans = RootGrid.TranslatePoint(e.MousePoint, ModifierSurface);
_startPoint = ptTrans;
_rectangle = new Rect();
SetPosition(_startPoint, _startPoint);
_isDragging = true;
}
private void UpdateSurface()
{
AreaSelection = AreaSelection ?? new AreaSelection { Surface = ParentSurface };
var x = _rectangle.X;
var width = _rectangle.Width;
AreaSelection.SetSelectionRect(x, width);
ParentSurface.ViewportManager.InvalidateParentSurface(RangeMode.None);
}
/// <summary>
/// Called when the Mouse is moved on the parent <see cref="SciChartSurface"/>
/// </summary>
/// <param name="e">Arguments detailing the mouse move operation</param>
/// <remarks></remarks>
public override void OnModifierMouseMove(ModifierMouseArgs e)
{
if (!_isDragging)
return;
base.OnModifierMouseMove(e);
e.Handled = true;
// Translate the mouse point (which is in RootGrid coordiantes) relative to the ModifierSurface
// This accounts for any offset due to left Y-Axis
Point ptTrans = RootGrid.TranslatePoint(e.MousePoint, ModifierSurface);
SetPosition(_startPoint, ptTrans);
UpdateSurface();
}
/// <summary>
/// Called when a Mouse Button is released on the parent <see cref="SciChartSurface"/>
/// </summary>
/// <param name="e">Arguments detailing the mouse button operation</param>
/// <remarks></remarks>
public override void OnModifierMouseUp(ModifierMouseArgs e)
{
if (!_isDragging)
return;
base.OnModifierMouseUp(e);
e.Handled = true;
// Translate the mouse point (which is in RootGrid coordiantes) relative to the ModifierSurface
// This accounts for any offset due to left Y-Axis
//Point ptTrans = RootGrid.TranslatePoint(e.MousePoint, ModifierSurface);
_rectangle = Rect.Empty;
UpdateSurface();
ClearReticule();
_isDragging = false;
ModifierSurface.ReleaseMouseCapture();
}
private Point SetPosition(Point startPoint, Point endPoint)
{
if (XAxis.IsHorizontalAxis)
{
startPoint.Y = 0;
endPoint.Y = ModifierSurface.ActualHeight;
}
else
{
startPoint.X = 0;
endPoint.X = ModifierSurface.ActualWidth;
}
var modifierRect = new Rect(0, 0, ModifierSurface.ActualWidth, ModifierSurface.ActualHeight);
endPoint = ClipToBounds(modifierRect, endPoint);
_rectangle = new Rect(startPoint, endPoint);
return endPoint;
}
private Point ClipToBounds(Rect rect, Point point)
{
double rightEdge = rect.Right;
double leftEdge = rect.Left;
double topEdge = rect.Top;
double bottomEdge = rect.Bottom;
point.X = point.X > rightEdge ? rightEdge : point.X;
point.X = point.X < leftEdge ? leftEdge : point.X;
point.Y = point.Y > bottomEdge ? bottomEdge : point.Y;
point.Y = point.Y < topEdge ? topEdge : point.Y;
return point;
}
private void ClearReticule()
{
_isDragging = false;
_rectangle = Rect.Empty;
}
}
}AreaSelection.cs
View source code// *************************************************************************************
// SCICHART® Copyright SciChart Ltd. 2011-2022. All rights reserved.
//
// Web: http://www.scichart.com
// Support: support@scichart.com
// Sales: sales@scichart.com
//
// AreaSelection.cs is part of the SCICHART® Examples. Permission is hereby granted
// to modify, create derivative works, distribute and publish any part of this source
// code whether for commercial, private or personal use.
//
// The SCICHART® examples are distributed in the hope that they will be useful, but
// without any warranty. It is provided "AS IS" without warranty of any kind, either
// expressed or implied.
// *************************************************************************************
using System;
using SciChart.Charting.Visuals;
namespace SciChart.Examples.Examples.StyleAChart.UsePaletteProvider
{
public class AreaSelection
{
private IComparable _x1, _x2;
public ISciChartSurface Surface { get; set; }
public void SetSelectionRect(double x1, double width)
{
var xCalc = Surface.XAxis?.GetCurrentCoordinateCalculator();
if (xCalc != null)
{
_x1 = xCalc.GetDataValue(x1);
_x2 = xCalc.GetDataValue(x1 + width);
}
}
/// <summary>
/// Checks whether current <see cref="AreaSelection"/> contains a point with x coordinate
/// </summary>
public bool Contains(double x)
{
return x.CompareTo(_x1) >= 0 && x.CompareTo(_x2) <= 0;
}
}
}