WPF Chart - Examples
SciChart WPF ships with hundreds of WPF Chart Examples which you can browse, play with, view the source-code and even export each WPF Chart Example to a stand-alone Visual Studio solution. All of this is possible with the new and improved SciChart WPF Examples Suite, which ships as part of the SciChart WPF SDK.
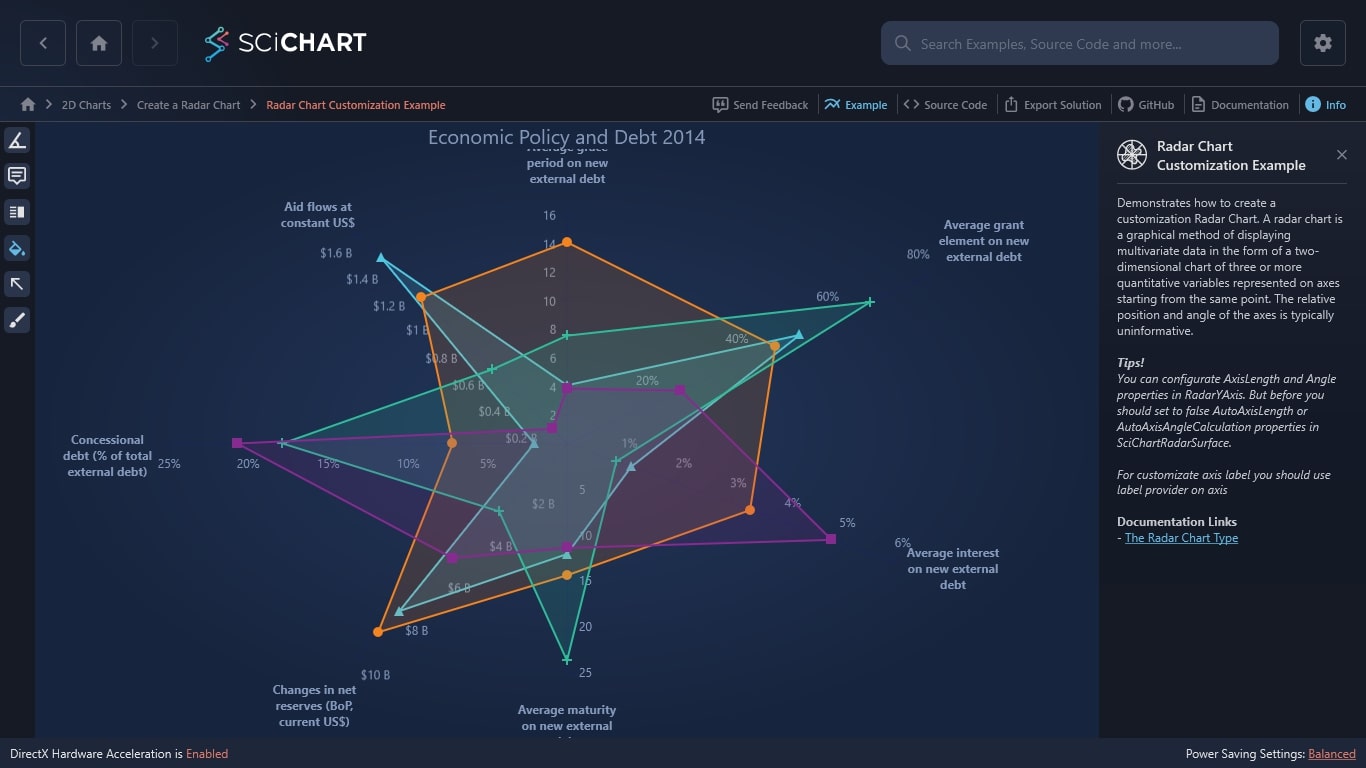
Demonstrates how to create a customization Radar Chart. A radar chart is a graphical method of displaying multivariate data in the form of a two-dimensional chart of three or more quantitative variables represented on axes starting from the same point. The relative position and angle of the axes is typically uninformative.
Tips!
You can configurate AxisLength and Angle properties in RadarYAxis. But before you should set to false AutoAxisLength or AutoAxisAngleCalculation properties in SciChartRadarSurface.
For customizate axis label you should use label provider on axis
Documentation Links
– The Radar Chart Type

The C#/WPF source code for the WPF Radar Chart Customization example is included below (Scroll down!).
Did you know you can also view the source code from one of the following sources as well?
- Clone the SciChart.WPF.Examples from Github.
- Or, view source in the SciChart WPF Examples suite.
- Also the SciChart WPF Trial contains the full source for the examples (link below).
RadarChartCustomizationExampleView.xaml
View source code<UserControl x:Class="SciChart.Examples.Examples.CreateRadarChart.RadarChartCustomizationExampleView"
xmlns="http://schemas.microsoft.com/winfx/2006/xaml/presentation"
xmlns:x="http://schemas.microsoft.com/winfx/2006/xaml"
xmlns:d="http://schemas.microsoft.com/expression/blend/2008"
xmlns:ext="http://schemas.abtsoftware.co.uk/scichart/exampleExternals"
xmlns:local="clr-namespace:SciChart.Examples.Examples.CreateRadarChart"
xmlns:mc="http://schemas.openxmlformats.org/markup-compatibility/2006"
xmlns:s="http://schemas.abtsoftware.co.uk/scichart"
d:DesignHeight="400"
d:DesignWidth="600"
mc:Ignorable="d">
<UserControl.Resources>
<ResourceDictionary>
<ResourceDictionary.MergedDictionaries>
<ResourceDictionary Source="/SciChart.Examples.ExternalDependencies;component/Resources/Styles/MergedResources.xaml" />
<ResourceDictionary Source="/SciChart.Examples.ExternalDependencies;component/Resources/Styles/ToolbarButtonsCommon.xaml" />
</ResourceDictionary.MergedDictionaries>
<DataTemplate x:Key="RadarChartTooltipTemplate" DataType="s:IRadarSeriesInfo">
<StackPanel HorizontalAlignment="Stretch" Margin="1" Orientation="Vertical">
<TextBlock MaxWidth="100"
FontSize="12"
Text="{Binding AxisTitle}"
TextAlignment="Center"
TextWrapping="Wrap" />
<StackPanel Margin="3 0 3 3" Orientation="Horizontal">
<TextBlock Margin="3" FontSize="14" Text="{Binding SeriesName}"/>
<TextBlock FontSize="14" Margin="3 0" Text="{Binding FormattedDataValue}"/>
</StackPanel>
</StackPanel>
</DataTemplate>
<local:RadarChartBillionDollarCategoryLabelProvider x:Key="BillionLabelProvider" />
<local:RadarChartPercentCategoryLabelProvider x:Key="PercentProvider" />
<ext:EnumValueToStringConverter x:Key="SelectedEnumValueConverter" />
<Style x:Key="RadarAxisStyle" TargetType="s:RadarAxis">
<Setter Property="DrawMajorTicks" Value="True" />
<Setter Property="AutoTicks" Value="False" />
<Setter Property="DrawLabels" Value="True" />
<Setter Property="TitleStyle">
<Setter.Value>
<Style TargetType="s:RadarAxisTitle">
<Setter Property="ContentTemplate">
<Setter.Value>
<DataTemplate>
<TextBlock MaxWidth="100"
FontSize="12"
Text="{Binding AxisTitle}"
TextAlignment="Center"
TextWrapping="Wrap" />
</DataTemplate>
</Setter.Value>
</Setter>
</Style>
</Setter.Value>
</Setter>
</Style>
</ResourceDictionary>
</UserControl.Resources>
<Grid>
<Grid.ColumnDefinitions>
<ColumnDefinition Width="Auto" />
<ColumnDefinition Width="*" />
</Grid.ColumnDefinitions>
<s:SciChartRadarSurface x:Name="radarChart"
Grid.Column="1"
AutoAxisAngle="False"
AutoAxisLength="False"
ChartTitle="Economic Policy and Debt 2014"
AxisAngleOffset="{Binding StartAngle, Mode=TwoWay}">
<s:SciChartRadarSurface.RadarAxes>
<s:RadarAxis AxisAngle="0"
AxisLength="230"
SkippedFirstTicks="1"
AxisTitle="Average grace period on new external debt"
Id="gracePeriodId"
MajorDelta="2"
MinorDelta="2"
Style="{StaticResource RadarAxisStyle}"
VisibleRange="0,16"/>
<s:RadarAxis AxisAngle="65"
AxisLength="400"
SkippedFirstTicks="1"
AxisTitle="Average grant element on new external debt"
Id="grantElementId"
LabelProvider="{StaticResource PercentProvider}"
MajorDelta="20"
MinorDelta="20"
Style="{StaticResource RadarAxisStyle}"
VisibleRange="0,80" />
<s:RadarAxis AxisAngle="110"
AxisLength="350"
SkippedFirstTicks="1"
AxisTitle="Average interest on new external debt"
Id="interestId"
LabelProvider="{StaticResource PercentProvider}"
MajorDelta="1"
MinorDelta="1"
Style="{StaticResource RadarAxisStyle}"
VisibleRange="0, 6" />
<s:RadarAxis AxisAngle="180"
AxisLength="230"
SkippedFirstTicks="1"
AxisTitle="Average maturity on new external debt"
Id="maturityId"
MajorDelta="5"
MinorDelta="5"
Style="{StaticResource RadarAxisStyle}"
VisibleRange="0,25" />
<s:RadarAxis AxisAngle="225"
AxisLength="300"
SkippedFirstTicks="1"
AxisTitle="Changes in net reserves (BoP, current US$)"
Id="netReservesId"
LabelProvider="{StaticResource BillionLabelProvider}"
MajorDelta="2"
MinorDelta="2"
Style="{StaticResource RadarAxisStyle}"
VisibleRange="0,10" />
<s:RadarAxis AxisAngle="270"
AxisLength="400"
SkippedFirstTicks="1"
AxisTitle="Concessional debt (% of total external debt)"
Id="concessionalDebtId"
LabelProvider="{StaticResource PercentProvider}"
MajorDelta="5"
MinorDelta="5"
Style="{StaticResource RadarAxisStyle}"
VisibleRange="0,25" />
<s:RadarAxis AxisAngle="315"
AxisLength="300"
SkippedFirstTicks="1"
AxisTitle="Aid flows at constant US$"
Id="aidId"
LabelProvider="{StaticResource BillionLabelProvider}"
MajorDelta="0.2"
MinorDelta="0.2"
Style="{StaticResource RadarAxisStyle}"
VisibleRange="0,1.6"/>
</s:SciChartRadarSurface.RadarAxes>
<s:SciChartRadarSurface.ChartModifiers>
<s:RadarTooltipModifier ShowTooltip="{Binding ShowTooltip, Mode=TwoWay}" />
<s:RadarLegendModifier LegendPlacement="Inside"
Orientation="Vertical"
ShowLegend="{Binding ShowLegend, Mode=TwoWay}" />
<s:RadarSeriesSelectionModifier ExecuteWhen="{Binding SelectionExecuteWhen}" AllowsMultiSelection="{Binding AllowMultiSelection}" IsEnabled="{Binding AllowSelection}" />
</s:SciChartRadarSurface.ChartModifiers>
<s:SciChartRadarSurface.RenderableSeries>
<s:RadarPolygonRenderableSeries DataSeries="{Binding UkraineDataSeries}"
IsFilled="{Binding IsFilled, Mode=TwoWay}"
SeriesName="Ukraine"
Stroke="Blue"
StrokeThickness="2">
<s:RadarPolygonRenderableSeries.PointMarker>
<s:TrianglePointMarker Width="10"
Height="10"
Fill="Blue"
StrokeThickness="0" />
</s:RadarPolygonRenderableSeries.PointMarker>
<s:RadarPolygonRenderableSeries.Fill>
<SolidColorBrush Opacity="0.4"
Color="Blue" />
</s:RadarPolygonRenderableSeries.Fill>
<s:RadarPolygonRenderableSeries.SelectedSeriesStyle>
<Style TargetType="s:RadarPolygonRenderableSeries">
<Setter Property="StrokeThickness" Value="3" />
<Setter Property="Fill">
<Setter.Value>
<SolidColorBrush Opacity="0.8"
Color="Blue" />
</Setter.Value>
</Setter>
<Setter Property="PointMarker">
<Setter.Value>
<s:TrianglePointMarker Width="15"
Height="15"
Fill="Blue"
StrokeThickness="0"/>
</Setter.Value>
</Setter>
</Style>
</s:RadarPolygonRenderableSeries.SelectedSeriesStyle>
</s:RadarPolygonRenderableSeries>
<s:RadarPolygonRenderableSeries DataSeries="{Binding RomaniaDataSeries}"
IsFilled="{Binding IsFilled, Mode=TwoWay}"
SeriesName="Romania"
Stroke="Coral"
StrokeThickness="2">
<s:RadarPolygonRenderableSeries.Fill>
<SolidColorBrush Opacity="0.4"
Color="Coral" />
</s:RadarPolygonRenderableSeries.Fill>
<s:RadarPolygonRenderableSeries.PointMarker>
<s:EllipsePointMarker Width="10"
Height="10"
Fill="Coral"
StrokeThickness="0"/>
</s:RadarPolygonRenderableSeries.PointMarker>
<s:RadarPolygonRenderableSeries.SelectedSeriesStyle>
<Style TargetType="s:RadarPolygonRenderableSeries">
<Setter Property="StrokeThickness" Value="3" />
<Setter Property="Fill">
<Setter.Value>
<SolidColorBrush Opacity="0.8"
Color="Coral" />
</Setter.Value>
</Setter>
<Setter Property="PointMarker">
<Setter.Value>
<s:EllipsePointMarker Width="15"
Height="15"
Fill="Coral"
StrokeThickness="0"/>
</Setter.Value>
</Setter>
</Style>
</s:RadarPolygonRenderableSeries.SelectedSeriesStyle>
</s:RadarPolygonRenderableSeries>
<s:RadarPolygonRenderableSeries DataSeries="{Binding GeorgiaDataSeries}"
IsFilled="{Binding IsFilled, Mode=TwoWay}"
SeriesName="Georgia"
Stroke="Green"
StrokeThickness="2">
<s:RadarPolygonRenderableSeries.Fill>
<SolidColorBrush Opacity="0.4"
Color="Green" />
</s:RadarPolygonRenderableSeries.Fill>
<s:RadarPolygonRenderableSeries.PointMarker>
<s:CrossPointMarker Width="10"
Height="10"
Stroke="Green"
StrokeThickness="2" />
</s:RadarPolygonRenderableSeries.PointMarker>
<s:RadarPolygonRenderableSeries.SelectedSeriesStyle>
<Style TargetType="s:RadarPolygonRenderableSeries">
<Setter Property="StrokeThickness" Value="3" />
<Setter Property="Fill">
<Setter.Value>
<SolidColorBrush Opacity="0.8"
Color="Green" />
</Setter.Value>
</Setter>
<Setter Property="PointMarker">
<Setter.Value>
<s:CrossPointMarker Width="15"
Height="15"
Stroke="Green"
StrokeThickness="3" />
</Setter.Value>
</Setter>
</Style>
</s:RadarPolygonRenderableSeries.SelectedSeriesStyle>
</s:RadarPolygonRenderableSeries>
<s:RadarPolygonRenderableSeries DataSeries="{Binding BelarusDataSeries}"
IsFilled="{Binding IsFilled, Mode=TwoWay}"
SeriesName="Belarus"
Stroke="YellowGreen"
StrokeThickness="2">
<s:RadarPolygonRenderableSeries.Fill>
<SolidColorBrush Opacity="0.4"
Color="YellowGreen" />
</s:RadarPolygonRenderableSeries.Fill>
<s:RadarPolygonRenderableSeries.PointMarker>
<s:SquarePointMarker Width="10"
Height="10"
Fill="YellowGreen"
StrokeThickness="0"/>
</s:RadarPolygonRenderableSeries.PointMarker>
<s:RadarPolygonRenderableSeries.SelectedSeriesStyle>
<Style TargetType="s:RadarPolygonRenderableSeries">
<Setter Property="StrokeThickness" Value="3" />
<Setter Property="Fill">
<Setter.Value>
<SolidColorBrush Opacity="0.8"
Color="YellowGreen" />
</Setter.Value>
</Setter>
<Setter Property="PointMarker">
<Setter.Value>
<s:SquarePointMarker Width="15"
Height="15"
Fill="YellowGreen"
StrokeThickness="0"/>
</Setter.Value>
</Setter>
</Style>
</s:RadarPolygonRenderableSeries.SelectedSeriesStyle>
</s:RadarPolygonRenderableSeries>
</s:SciChartRadarSurface.RenderableSeries>
</s:SciChartRadarSurface>
<Border Panel.ZIndex="9999"
Background="#FF232426"
BorderBrush="#323539"
BorderThickness="0,0,2,0">
<WrapPanel HorizontalAlignment="Left" Orientation="Vertical">
<ext:FlyoutMenuButton Content="Ang"
FontSize="12"
Padding="0"
Style="{StaticResource FlyoutMenuButtonStyle}">
<ext:FlyoutMenuButton.PopupContent>
<StackPanel Orientation="Vertical">
<TextBlock Text="Slide to change Start Angle of Radar Chart" />
<ext:FlyoutSeparator />
<Slider Margin="4"
HorizontalAlignment="Stretch"
Maximum="360"
Minimum="0"
Orientation="Horizontal"
Value="{Binding StartAngle,
Mode=TwoWay}" />
</StackPanel>
</ext:FlyoutMenuButton.PopupContent>
</ext:FlyoutMenuButton>
<ToggleButton HorizontalAlignment="Left"
Content="Tooltip"
ContentTemplate="{StaticResource TooltipIconContentTemplate}"
IsChecked="{Binding ShowTooltip, Mode=TwoWay}"
Style="{StaticResource DefaultToggleButtonStyle}"
ToolTipService.ToolTip="Tooltip Radar Modifier" />
<ToggleButton HorizontalAlignment="Left"
Content="Leg"
IsChecked="{Binding ShowLegend, Mode=TwoWay}"
Style="{StaticResource DefaultToggleButtonStyle}"
ToolTipService.ToolTip="Legend Radar Modifier" />
<ToggleButton HorizontalAlignment="Left"
Content="Fill"
FontSize="12"
IsChecked="{Binding IsFilled, Mode=TwoWay}"
Padding="0"
Style="{StaticResource DefaultToggleButtonStyle}"
ToolTipService.ToolTip="Is filled series" />
<ext:FlyoutMenuToggleButton HorizontalAlignment="Left"
Content="SLCT"
Padding="0"
FontSize="11"
IsChecked="{Binding AllowSelection, Mode=TwoWay}"
Style="{StaticResource FlyoutMenuToggleButtonStyle}"
ToolTipService.ToolTip="Selection Modifier">
<ext:FlyoutMenuToggleButton.PopupContent>
<StackPanel MinWidth="150" Orientation="Vertical">
<TextBlock FontSize="12" Text="Execute when" />
<ComboBox FontSize="12" ItemsSource="{Binding Source={ext:EnumValues {x:Type s:MouseModifier}}}" SelectedItem="{Binding SelectionExecuteWhen, Mode=TwoWay, Converter={StaticResource SelectedEnumValueConverter}}" />
<ext:FlyoutSeparator />
<CheckBox Margin="3"
VerticalAlignment="Center"
Content="Allow Multi Selection"
IsChecked="{Binding AllowMultiSelection, Mode=TwoWay}" />
</StackPanel>
</ext:FlyoutMenuToggleButton.PopupContent>
</ext:FlyoutMenuToggleButton>
<ext:FlyoutMenuButton HorizontalAlignment="Left"
HorizontalContentAlignment="Center"
Content="THM"
FontSize="10"
Padding="0"
Style="{StaticResource FlyoutMenuButtonStyle}"
ToolTipService.ToolTip="Theme changing">
<ext:FlyoutMenuButton.PopupContent>
<StackPanel MinWidth="150" Orientation="Vertical">
<TextBlock FontSize="12" Text="Update Theme" />
<ext:FlyoutSeparator />
<ComboBox FontSize="12"
ItemsSource="{Binding Source={x:Static s:ThemeManager.AllThemes}}"
SelectedItem="{Binding Source={x:Reference Name=radarChart}, Path=(s:ThemeManager.Theme), Mode=TwoWay}" />
</StackPanel>
</ext:FlyoutMenuButton.PopupContent>
</ext:FlyoutMenuButton>
</WrapPanel>
</Border>
</Grid>
</UserControl>
RadarChartCustomizationExampleView.xaml.cs
View source codeusing System;
using System.Collections.Generic;
using System.Linq;
using System.Text;
using System.Windows;
using System.Windows.Controls;
using System.Windows.Data;
using System.Windows.Documents;
using System.Windows.Input;
using System.Windows.Media;
using System.Windows.Media.Imaging;
using System.Windows.Navigation;
using System.Windows.Shapes;
namespace SciChart.Examples.Examples.CreateRadarChart
{
/// <summary>
/// Interaction logic for RadarChartCustomizationExampleView.xaml
/// </summary>
public partial class RadarChartCustomizationExampleView : UserControl
{
public RadarChartCustomizationExampleView()
{
InitializeComponent();
}
}
}
RadarChartCustomizationExampleViewModel.cs
View source codeusing System;
using System.Collections.Generic;
using System.Collections.ObjectModel;
using System.Linq;
using System.Text;
using SciChart.Charting.ChartModifiers;
using SciChart.Charting.Model.DataSeries;
using SciChart.Charting.Visuals.Axes;
using SciChart.Charting.Visuals.RenderableSeries;
using SciChart.Core.Utility.Mouse;
using SciChart.Examples.ExternalDependencies.Common;
namespace SciChart.Examples.Examples.CreateRadarChart
{
public class RadarChartCustomizationExampleViewModel : BaseViewModel
{
private bool _showTooltip;
private bool _showLegend;
private double _startAngle;
private bool _isFilled;
private bool _allowSelection;
private bool _allowMultiSelection;
private MouseModifier _selectionExecuteWhen;
public RadarChartCustomizationExampleViewModel()
{
IsFilled = true;
UkraineDataSeries = new ObservableCollection<IRadarPointViewModel>
{
new RadarPointViewModel {DataValue = 4.05, AxisId = "gracePeriodId"},
new RadarPointViewModel {DataValue = 51.35, AxisId = "grantElementId"},
new RadarPointViewModel {DataValue = 1.17, AxisId = "interestId"},
new RadarPointViewModel {DataValue = 12.02, AxisId = "maturityId"},
new RadarPointViewModel {DataValue = 7.9, AxisId = "netReservesId"},
new RadarPointViewModel {DataValue = 2.05, AxisId = "concessionalDebtId"},
new RadarPointViewModel {DataValue = 1.4, AxisId = "aidId"},
};
RomaniaDataSeries = new ObservableCollection<IRadarPointViewModel>
{
new RadarPointViewModel {DataValue = 14, AxisId = "gracePeriodId"},
new RadarPointViewModel {DataValue = 45.99, AxisId = "grantElementId"},
new RadarPointViewModel {DataValue = 3.34, AxisId = "interestId"},
new RadarPointViewModel {DataValue = 14.33, AxisId = "maturityId"},
new RadarPointViewModel {DataValue = 8.9, AxisId = "netReservesId"},
new RadarPointViewModel {DataValue = 7.14, AxisId = "concessionalDebtId"},
new RadarPointViewModel {DataValue = 1.1, AxisId = "aidId"},
};
GeorgiaDataSeries = new ObservableCollection<IRadarPointViewModel>
{
new RadarPointViewModel {DataValue = 7.5, AxisId = "gracePeriodId"},
new RadarPointViewModel {DataValue = 66.91, AxisId = "grantElementId"},
new RadarPointViewModel {DataValue = 0.9, AxisId = "interestId"},
new RadarPointViewModel {DataValue = 23.6, AxisId = "maturityId"},
new RadarPointViewModel {DataValue = 3.2, AxisId = "netReservesId"},
new RadarPointViewModel {DataValue = 17.78, AxisId = "concessionalDebtId"},
new RadarPointViewModel {DataValue = 0.56, AxisId = "aidId"},
};
BelarusDataSeries = new ObservableCollection<IRadarPointViewModel>
{
new RadarPointViewModel {DataValue = 3.82, AxisId = "gracePeriodId"},
new RadarPointViewModel {DataValue = 25.09, AxisId = "grantElementId"},
new RadarPointViewModel {DataValue = 4.83, AxisId = "interestId"},
new RadarPointViewModel {DataValue = 11.35, AxisId = "maturityId"},
new RadarPointViewModel {DataValue = 5.4, AxisId = "netReservesId"},
new RadarPointViewModel {DataValue = 20.61, AxisId = "concessionalDebtId"},
new RadarPointViewModel {DataValue = 0.11, AxisId = "aidId"},
};
}
public ObservableCollection<IRadarPointViewModel> UkraineDataSeries { get; set; }
public ObservableCollection<IRadarPointViewModel> RomaniaDataSeries { get; set; }
public ObservableCollection<IRadarPointViewModel> GeorgiaDataSeries { get; set; }
public ObservableCollection<IRadarPointViewModel> BelarusDataSeries { get; set; }
public MouseModifier SelectionExecuteWhen
{
get { return _selectionExecuteWhen; }
set
{
_selectionExecuteWhen = value;
OnPropertyChanged("SelectionExecuteWhen");
}
}
public bool AllowSelection
{
get { return _allowSelection; }
set
{
_allowSelection = value;
OnPropertyChanged("AllowSelection");
}
}
public bool AllowMultiSelection
{
get { return _allowMultiSelection; }
set
{
_allowMultiSelection = value;
OnPropertyChanged("AllowMultiSelection");
}
}
public bool IsFilled
{
get { return _isFilled; }
set
{
_isFilled = value;
OnPropertyChanged("IsFilled");
}
}
public bool ShowTooltip
{
get { return _showTooltip; }
set
{
_showTooltip = value;
OnPropertyChanged("ShowTooltip");
}
}
public bool ShowLegend
{
get { return _showLegend; }
set
{
_showLegend = value;
OnPropertyChanged("ShowLegend");
}
}
public double StartAngle
{
get { return _startAngle; }
set
{
_startAngle = value;
OnPropertyChanged("StartAngle");
}
}
}
}
RadarChartCustomizationLabelProviders.cs
View source codeusing System;
using System.Collections.Generic;
using System.Linq;
using System.Text;
using SciChart.Charting.Visuals.Axes.LabelProviders;
using SciChart.Core.Extensions;
namespace SciChart.Examples.Examples.CreateRadarChart
{
public class RadarChartBillionDollarCategoryLabelProvider : LabelProviderBase
{
public override string FormatLabel(IComparable dataValue)
{
return string.Format("${0} B", Math.Round(dataValue.ToDouble(), 1));
}
public override string FormatCursorLabel(IComparable dataValue)
{
return FormatLabel(dataValue);
}
}
public class RadarChartPercentCategoryLabelProvider : LabelProviderBase
{
public override string FormatLabel(IComparable dataValue)
{
return string.Format("{0}%", Math.Round(dataValue.ToDouble(), 1));
}
public override string FormatCursorLabel(IComparable dataValue)
{
return FormatLabel(dataValue);
}
}
}
