The Radar Chart has been added to SciChart WPF v5. This chart type allows you to specify a number of series as areas or lines on a spider-web background. Use this chart type to show relationships between a number of variables.
Examples for the Radar Chart can be found in the SciChart WPF Examples Suite which can be downloaded from the SciChart Website or our SciChart.WPF.Examples Github Repository.
Declaring a Radar Chart
To declare a radar chart, use the following code:
| Radar Chart |
Copy Code |
|---|---|
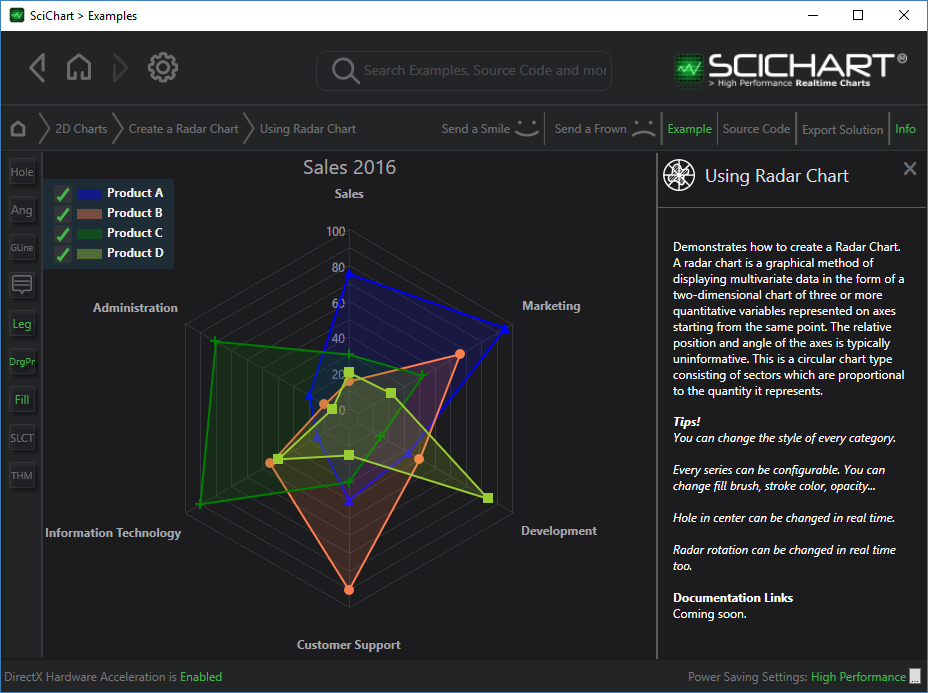
<s:SciChartRadarSurface CentralAxisOffset="0" AxisAngleOffset="0" RenderableSeries="{s:SeriesBinding RenderableSeries}"> <s:SciChartRadarSurface.RadarAxes> <s:RadarAxis AxisTitle="Sales" DrawLabels="True" DrawMajorGridLines="True" Id="salesId" IsLabelCullingEnabled="True" VisibleRange="0, 100" GridLinesType="SpiderWeb" /> <s:RadarAxis AxisTitle="Marketing" Id="marketingId" VisibleRange="0, 100" /> <s:RadarAxis AxisTitle="Development" Id="developmentId" VisibleRange="0, 100" /> <s:RadarAxis AxisTitle="Customer Support" Id="customerSupportId" VisibleRange="0, 100" /> <s:RadarAxis AxisTitle="Information Technology" Id="informationTechnologyId" VisibleRange="0, 100" /> <s:RadarAxis AxisTitle="Administration" Id="administrationId" VisibleRange="0, 100" /> </s:SciChartRadarSurface.RadarAxes> <s:SciChartRadarSurface.ChartModifiers> <s:RadarTooltipModifier ShowTooltip="True" /> <s:RadarLegendModifier Orientation="Vertical" ShowLegend="True" /> <s:RadarSeriesSelectionModifier ExecuteWhen="MouseLeftButton" AllowsMultiSelection="False" IsEnabled="True" /> <s:RadarDragDataPointModifier IsEnabled="True" /> </s:SciChartRadarSurface.ChartModifiers> </s:SciChartRadarSurface> | |
Ia ViewModel if using the MVVM SeriesBinding API, you need to declare the RenderableSeries. Series can also be added in code behind by directly manipulating the SciChartRadarSurface.RenderableSeries property.
| Radar Chart RenderableSeries |
Copy Code |
|---|---|
public class UsingRadarChartExampleViewModel : BaseViewModel { private readonly ObservableCollection<IRadarPolygonRenderableSeriesViewModel> _renderableSeries; public UsingRadarChartExampleViewModel() { var productADataSeries = new ObservableCollection<IRadarPointViewModel> { new RadarPointViewModel {DataValue = 75, AxisId = "salesId"}, new RadarPointViewModel {DataValue = 95, AxisId = "marketingId"}, new RadarPointViewModel {DataValue = 33, AxisId = "developmentId"}, new RadarPointViewModel {DataValue = 40, AxisId = "customerSupportId"}, new RadarPointViewModel {DataValue = 15, AxisId = "informationTechnologyId"}, new RadarPointViewModel {DataValue = 20, AxisId = "administrationId"}, }; var productBDataSeries = new ObservableCollection<IRadarPointViewModel> { new RadarPointViewModel {DataValue = 15, AxisId = "salesId"}, new RadarPointViewModel {DataValue = 66, AxisId = "marketingId"}, new RadarPointViewModel {DataValue = 40, AxisId = "developmentId"}, new RadarPointViewModel {DataValue = 90, AxisId = "customerSupportId"}, new RadarPointViewModel {DataValue = 45, AxisId = "informationTechnologyId"}, new RadarPointViewModel {DataValue = 10, AxisId = "administrationId"}, }; var productCDataSeries = new ObservableCollection<IRadarPointViewModel> { new RadarPointViewModel {DataValue = 30, AxisId = "salesId"}, new RadarPointViewModel {DataValue = 42, AxisId = "marketingId"}, new RadarPointViewModel {DataValue = 15, AxisId = "developmentId"}, new RadarPointViewModel {DataValue = 30, AxisId = "customerSupportId"}, new RadarPointViewModel {DataValue = 90, AxisId = "informationTechnologyId"}, new RadarPointViewModel {DataValue = 80, AxisId = "administrationId"}, }; var productDDataSeries = new ObservableCollection<IRadarPointViewModel> { new RadarPointViewModel {DataValue = 20, AxisId = "salesId"}, new RadarPointViewModel {DataValue = 22, AxisId = "marketingId"}, new RadarPointViewModel {DataValue = 84, AxisId = "developmentId"}, new RadarPointViewModel {DataValue = 15, AxisId = "customerSupportId"}, new RadarPointViewModel {DataValue = 40, AxisId = "informationTechnologyId"}, new RadarPointViewModel {DataValue = 5, AxisId = "administrationId"}, }; _renderableSeries = new ObservableCollection<IRadarPolygonRenderableSeriesViewModel>() { new RadarPolygonRenderableSeriesViewModel() { DataSeries = productADataSeries, SeriesName = "Product A", Stroke = Colors.Blue, StrokeThickness = 2, StyleKey = "BlueRadarSeriesStyle", Fill = new SolidColorBrush {Color = Colors.Blue, Opacity = 0.4}, PointMarker = new TrianglePointMarker { Width = 10, Height = 10, Fill = Colors.Blue, StrokeThickness = 0} }, new RadarPolygonRenderableSeriesViewModel() { DataSeries = productBDataSeries, SeriesName = "Product B", Stroke = Colors.Coral, StrokeThickness = 2, StyleKey = "CoralRadarSeriesStyle", Fill = new SolidColorBrush {Color = Colors.Coral, Opacity = 0.4}, PointMarker = new EllipsePointMarker { Width = 10, Height = 10, Fill = Colors.Coral, StrokeThickness = 0} }, new RadarPolygonRenderableSeriesViewModel() { DataSeries = productCDataSeries, SeriesName = "Product C", Stroke = Colors.Green, StrokeThickness = 2, StyleKey = "GreenRadarSeriesStyle", Fill = new SolidColorBrush {Color = Colors.Green, Opacity = 0.4}, PointMarker = new CrossPointMarker { Width = 10, Height = 10, Stroke = Colors.Green, StrokeThickness = 2} }, new RadarPolygonRenderableSeriesViewModel() { DataSeries = productDDataSeries, SeriesName = "Product D", Stroke = Colors.YellowGreen, StrokeThickness = 2, StyleKey = "YellowGreenRadarSeriesStyle", Fill = new SolidColorBrush {Color = Colors.YellowGreen, Opacity = 0.4}, PointMarker = new SquarePointMarker { Width = 10, Height = 10, Fill = Colors.YellowGreen, StrokeThickness = 0} } }; } public ObservableCollection<IRadarPolygonRenderableSeriesViewModel> RenderableSeries { get { return _renderableSeries; } } } | |
Examples of using the Radar Chart
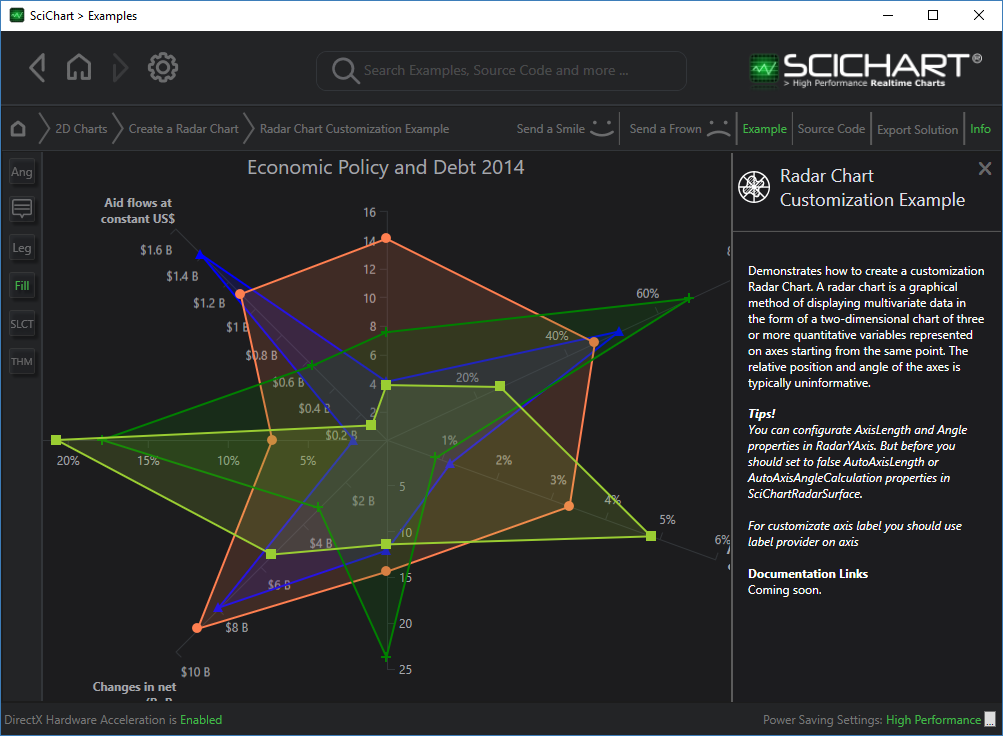
The SciChart WPF Examples Suite contains two examples of creating a radar chart. One with standard axis, and one with custom axis.
See the examples 2D Charts > Create a Radar Chart > Radar Chart Customization Example for further information.