SciChart® the market leader in Fast WPF Charts, WPF 3D Charts, iOS Chart, Android Chart and JavaScript Chart Components
SciChart WPF ships with hundreds of WPF Chart Examples which you can browse, play with, view the source-code and even export each WPF Chart Example to a stand-alone Visual Studio solution. All of this is possible with the new and improved SciChart WPF Examples Suite, which ships as part of the SciChart WPF SDK.
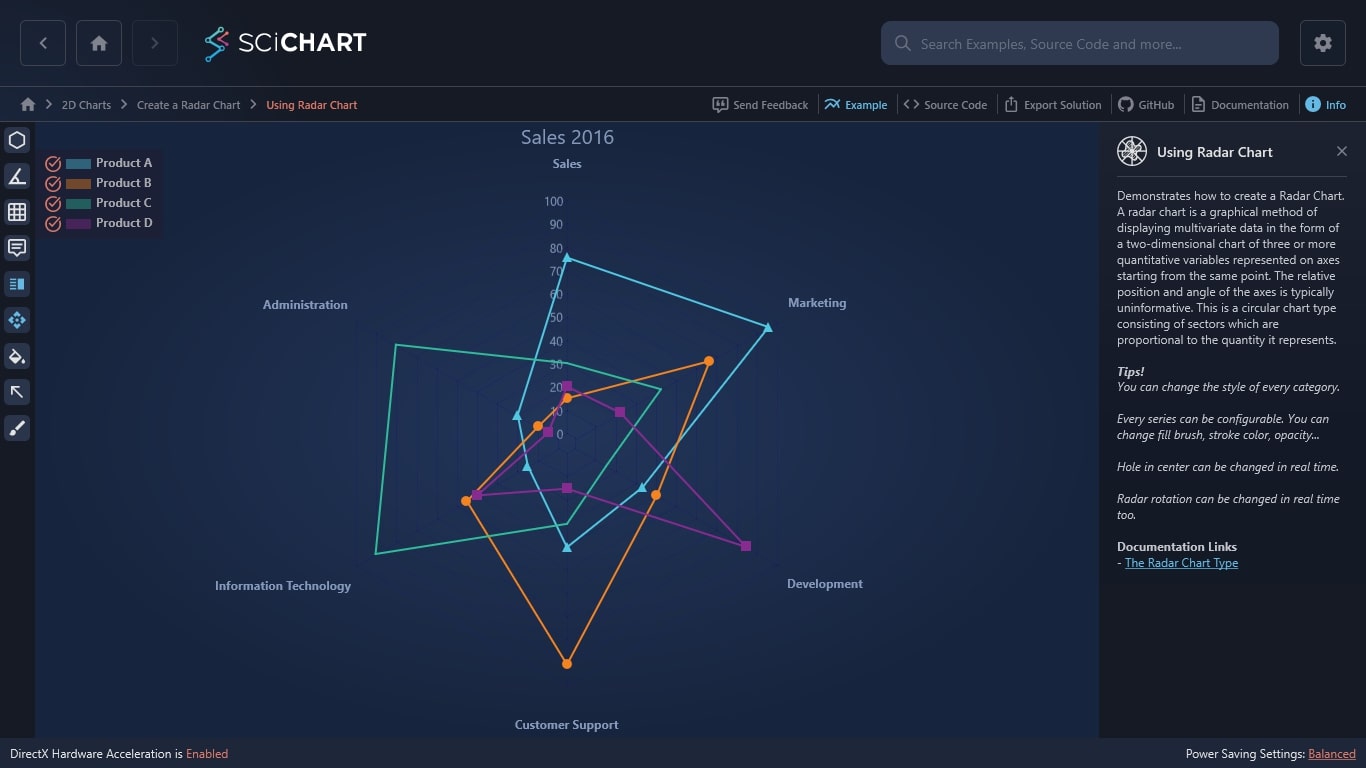
Demonstrates how to create a Radar Chart. A radar chart is a graphical method of displaying multivariate data in the form of a two-dimensional chart of three or more quantitative variables represented on axes starting from the same point. The relative position and angle of the axes is typically uninformative. This is a circular chart type consisting of sectors which are proportional to the quantity it represents.
Tips!
You can change the style of every category.
Every series can be configurable. You can change fill brush, stroke color, opacity…
Hole in center can be changed in real time.
Radar rotation can be changed in real time too.
Documentation Links
– The Radar Chart Type
The C#/WPF source code for the WPF Using Radar Chart example is included below (Scroll down!).
Did you know you can also view the source code from one of the following sources as well?
<UserControl x:Class="SciChart.Examples.Examples.CreateRadarChart.UsingRadarChartExampleView"
xmlns="http://schemas.microsoft.com/winfx/2006/xaml/presentation"
xmlns:x="http://schemas.microsoft.com/winfx/2006/xaml"
xmlns:d="http://schemas.microsoft.com/expression/blend/2008"
xmlns:ext="http://schemas.abtsoftware.co.uk/scichart/exampleExternals"
xmlns:local="clr-namespace:SciChart.Examples.Examples.CreateRadarChart"
xmlns:mc="http://schemas.openxmlformats.org/markup-compatibility/2006"
xmlns:s="http://schemas.abtsoftware.co.uk/scichart"
d:DesignHeight="400"
d:DesignWidth="600"
mc:Ignorable="d">
<UserControl.Resources>
<ResourceDictionary>
<ResourceDictionary.MergedDictionaries>
<ResourceDictionary
Source="/SciChart.Examples.ExternalDependencies;component/Resources/Styles/MergedResources.xaml" />
<ResourceDictionary
Source="/SciChart.Examples.ExternalDependencies;component/Resources/Styles/ToolbarButtonsCommon.xaml" />
</ResourceDictionary.MergedDictionaries>
<ext:EnumValueToStringConverter x:Key="SelectedEnumValueConverter" />
</ResourceDictionary>
</UserControl.Resources>
<Grid>
<Grid.ColumnDefinitions>
<ColumnDefinition Width="Auto" />
<ColumnDefinition Width="*" />
</Grid.ColumnDefinitions>
<s:SciChartRadarSurface x:Name="radarChart"
Grid.Column="1"
ChartTitle="Sales 2016"
RenderableSeries="{s:SeriesBinding RenderableSeries}"
CentralAxisOffset="{Binding Source={x:Reference HoleValueSlider}, Path=Value, Mode=TwoWay}"
AxisAngleOffset="{Binding Source={x:Reference AngleValueSlider}, Path=Value, Mode=TwoWay}">
<s:SciChartRadarSurface.Resources>
<Style x:Key="RadarSeriesStyle" TargetType="s:RadarPolygonRenderableSeries">
<Setter Property="IsFilled"
Value="{Binding Source={x:Reference FillingEnablingButton}, Path=IsChecked, Mode=TwoWay}" />
</Style>
<Style x:Key="BlueRadarSeriesStyle" BasedOn="{StaticResource RadarSeriesStyle}" TargetType="s:RadarPolygonRenderableSeries">
<Setter Property="SelectedSeriesStyle">
<Setter.Value>
<Style TargetType="s:RadarPolygonRenderableSeries">
<Setter Property="StrokeThickness" Value="3" />
<Setter Property="Fill">
<Setter.Value>
<SolidColorBrush Color="Blue" Opacity="0.8"/>
</Setter.Value>
</Setter>
<Setter Property="PointMarker">
<Setter.Value>
<s:TrianglePointMarker Width="15"
Height="15"
Fill="Blue"
StrokeThickness="0"/>
</Setter.Value>
</Setter>
</Style>
</Setter.Value>
</Setter>
</Style>
<Style x:Key="CoralRadarSeriesStyle" BasedOn="{StaticResource RadarSeriesStyle}" TargetType="s:RadarPolygonRenderableSeries">
<Setter Property="SelectedSeriesStyle">
<Setter.Value>
<Style TargetType="s:RadarPolygonRenderableSeries">
<Setter Property="StrokeThickness" Value="3" />
<Setter Property="Fill">
<Setter.Value>
<SolidColorBrush Color="Coral"
Opacity="0.8"/>
</Setter.Value>
</Setter>
<Setter Property="PointMarker">
<Setter.Value>
<s:EllipsePointMarker Width="15"
Height="15"
Fill="Coral"
StrokeThickness="0"/>
</Setter.Value>
</Setter>
</Style>
</Setter.Value>
</Setter>
</Style>
<Style x:Key="GreenRadarSeriesStyle" BasedOn="{StaticResource RadarSeriesStyle}" TargetType="s:RadarPolygonRenderableSeries">
<Setter Property="SelectedSeriesStyle">
<Setter.Value>
<Style TargetType="s:RadarPolygonRenderableSeries">
<Setter Property="StrokeThickness" Value="3" />
<Setter Property="Fill">
<Setter.Value>
<SolidColorBrush Color="Green"
Opacity="0.8"/>
</Setter.Value>
</Setter>
<Setter Property="PointMarker">
<Setter.Value>
<s:CrossPointMarker Width="15"
Height="15"
Stroke="Green"
StrokeThickness="3"/>
</Setter.Value>
</Setter>
</Style>
</Setter.Value>
</Setter>
</Style>
<Style x:Key="YellowGreenRadarSeriesStyle" BasedOn="{StaticResource RadarSeriesStyle}" TargetType="s:RadarPolygonRenderableSeries">
<Setter Property="SelectedSeriesStyle">
<Setter.Value>
<Style TargetType="s:RadarPolygonRenderableSeries">
<Setter Property="StrokeThickness" Value="3" />
<Setter Property="Fill">
<Setter.Value>
<SolidColorBrush Color="YellowGreen"
Opacity="0.8"/>
</Setter.Value>
</Setter>
<Setter Property="PointMarker">
<Setter.Value>
<s:SquarePointMarker Width="15"
Height="15"
Fill="YellowGreen"
StrokeThickness="0"/>
</Setter.Value>
</Setter>
</Style>
</Setter.Value>
</Setter>
</Style>
</s:SciChartRadarSurface.Resources>
<s:SciChartRadarSurface.RadarAxes>
<s:RadarAxis AxisTitle="Sales"
DrawLabels="True"
DrawMajorGridLines="True"
Id="salesId"
IsLabelCullingEnabled="True"
VisibleRange="0, 100"
GridLinesType="{Binding Source={x:Reference GridLinesTypeSourceCombo}, Path=SelectedItem}" />
<s:RadarAxis AxisTitle="Marketing"
Id="marketingId"
VisibleRange="0, 100" />
<s:RadarAxis AxisTitle="Development"
Id="developmentId"
VisibleRange="0, 100" />
<s:RadarAxis AxisTitle="Customer Support"
Id="customerSupportId"
VisibleRange="0, 100" />
<s:RadarAxis AxisTitle="Information Technology"
Id="informationTechnologyId"
VisibleRange="0, 100" />
<s:RadarAxis AxisTitle="Administration"
Id="administrationId"
VisibleRange="0, 100" />
</s:SciChartRadarSurface.RadarAxes>
<s:SciChartRadarSurface.ChartModifiers>
<s:RadarTooltipModifier
ShowTooltip="{Binding Source={x:Reference TooltipEnablingButton}, Path=IsChecked, Mode=TwoWay}" />
<s:RadarLegendModifier Orientation="Vertical"
ShowLegend="{Binding Source={x:Reference LegendEnablingButton}, Path=IsChecked, Mode=TwoWay}" />
<s:RadarSeriesSelectionModifier
ExecuteWhen="{Binding Source={x:Reference SelectionModeCombo}, Path=SelectedItem}"
AllowsMultiSelection="{Binding Source={x:Reference MultiSelectionEnablingCheckbox}, Path=IsChecked, Mode=TwoWay}"
IsEnabled="{Binding Source={x:Reference SelectionEnablingButton}, Path=IsChecked, Mode=TwoWay}" />
<s:RadarDragDataPointModifier
IsEnabled="{Binding Source={x:Reference DragDataPointButton}, Path=IsChecked, Mode=TwoWay}" />
</s:SciChartRadarSurface.ChartModifiers>
</s:SciChartRadarSurface>
<!-- This toolbar adds tooltip, legend and theme change functionality -->
<Border Panel.ZIndex="9999"
Background="#FF232426"
BorderBrush="#323539"
BorderThickness="0,0,2,0">
<WrapPanel HorizontalAlignment="Left" Orientation="Vertical">
<ext:FlyoutMenuButton Content="Hole"
FontSize="11"
Padding="0"
Style="{StaticResource FlyoutMenuButtonStyle}">
<ext:FlyoutMenuButton.PopupContent>
<StackPanel Orientation="Vertical">
<TextBlock Text="Slide to change Center Hole of Radar Chart" />
<ext:FlyoutSeparator />
<Slider Margin="4"
HorizontalAlignment="Stretch"
Maximum="40"
Minimum="0"
Orientation="Horizontal"
Value="10"
x:Name="HoleValueSlider" />
</StackPanel>
</ext:FlyoutMenuButton.PopupContent>
</ext:FlyoutMenuButton>
<ext:FlyoutMenuButton Content="Ang"
FontSize="12"
Padding="0"
Style="{StaticResource FlyoutMenuButtonStyle}">
<ext:FlyoutMenuButton.PopupContent>
<StackPanel Orientation="Vertical">
<TextBlock Text="Slide to change Start Angle of Radar Chart" />
<ext:FlyoutSeparator />
<Slider Margin="4"
HorizontalAlignment="Stretch"
Maximum="360"
Minimum="0"
Orientation="Horizontal"
x:Name="AngleValueSlider" />
</StackPanel>
</ext:FlyoutMenuButton.PopupContent>
</ext:FlyoutMenuButton>
<ext:FlyoutMenuButton Content="GLine"
FontSize="9"
Padding="0"
Style="{StaticResource FlyoutMenuButtonStyle}">
<ext:FlyoutMenuButton.PopupContent>
<StackPanel Orientation="Vertical">
<TextBlock Text="Change Grid Lines of Radar Chart" />
<ext:FlyoutSeparator />
<ComboBox ItemsSource="{Binding Source={ext:EnumValues {x:Type s:GridLinesType}}}"
SelectedIndex="0"
x:Name="GridLinesTypeSourceCombo" />
</StackPanel>
</ext:FlyoutMenuButton.PopupContent>
</ext:FlyoutMenuButton>
<ToggleButton HorizontalAlignment="Left"
Content="Tooltip"
ContentTemplate="{StaticResource TooltipIconContentTemplate}"
Style="{StaticResource DefaultToggleButtonStyle}"
ToolTipService.ToolTip="Tooltip Radar Modifier"
x:Name="TooltipEnablingButton" />
<ToggleButton HorizontalAlignment="Left"
Content="Leg"
Style="{StaticResource DefaultToggleButtonStyle}"
ToolTipService.ToolTip="Legend Radar Modifier"
IsChecked="True"
x:Name="LegendEnablingButton" />
<ToggleButton HorizontalAlignment="Left"
Content="DrgPnt"
FontSize="10"
Padding="0"
Style="{StaticResource DefaultToggleButtonStyle}"
ToolTipService.ToolTip="Drag Data Point Modifier"
IsChecked="True"
x:Name="DragDataPointButton" />
<ToggleButton HorizontalAlignment="Left"
Content="Fill"
FontSize="12"
Padding="0"
Style="{StaticResource DefaultToggleButtonStyle}"
ToolTipService.ToolTip="Is filled series"
IsChecked="True"
x:Name="FillingEnablingButton" />
<ext:FlyoutMenuToggleButton HorizontalAlignment="Left"
Content="SLCT"
Padding="0"
FontSize="11"
x:Name="SelectionEnablingButton"
Style="{StaticResource FlyoutMenuToggleButtonStyle}"
ToolTipService.ToolTip="Selection Modifier">
<ext:FlyoutMenuToggleButton.PopupContent>
<StackPanel MinWidth="150" Orientation="Vertical">
<TextBlock FontSize="12" Text="Execute when" />
<ComboBox FontSize="12"
ItemsSource="{Binding Source={ext:EnumValues {x:Type s:MouseModifier}}}"
SelectedIndex="0"
x:Name="SelectionModeCombo" />
<ext:FlyoutSeparator />
<CheckBox Margin="3"
VerticalAlignment="Center"
Content="Allow Multi Selection"
x:Name="MultiSelectionEnablingCheckbox" />
</StackPanel>
</ext:FlyoutMenuToggleButton.PopupContent>
</ext:FlyoutMenuToggleButton>
<ext:FlyoutMenuButton HorizontalAlignment="Left"
HorizontalContentAlignment="Center"
Content="THM"
FontSize="10"
Padding="0"
Style="{StaticResource FlyoutMenuButtonStyle}"
ToolTipService.ToolTip="Theme changing">
<ext:FlyoutMenuButton.PopupContent>
<StackPanel MinWidth="150" Orientation="Vertical">
<TextBlock FontSize="12" Text="Update Theme" />
<ext:FlyoutSeparator />
<ComboBox FontSize="12"
ItemsSource="{Binding Source={x:Static s:ThemeManager.AllThemes}}"
SelectedItem="{Binding Source={x:Reference radarChart},
Path=(s:ThemeManager.Theme),
Mode=TwoWay}" />
</StackPanel>
</ext:FlyoutMenuButton.PopupContent>
</ext:FlyoutMenuButton>
</WrapPanel>
</Border>
</Grid>
</UserControl>
using System;
using System.Collections.Generic;
using System.Linq;
using System.Text;
using System.Windows;
using System.Windows.Controls;
using System.Windows.Data;
using System.Windows.Documents;
using System.Windows.Input;
using System.Windows.Media;
using System.Windows.Media.Imaging;
using System.Windows.Navigation;
using System.Windows.Shapes;
namespace SciChart.Examples.Examples.CreateRadarChart
{
/// <summary>
/// Interaction logic for UsingRadarChartExampleView.xaml
/// </summary>
public partial class UsingRadarChartExampleView : UserControl
{
public UsingRadarChartExampleView()
{
InitializeComponent();
}
}
}
using System.Collections.ObjectModel;
using System.Windows.Ink;
using System.Windows.Media;
using SciChart.Charting.Model.ChartSeries;
using SciChart.Charting.Model.DataSeries;
using SciChart.Charting.Visuals.PointMarkers;
using SciChart.Charting.Visuals.RenderableSeries;
using SciChart.Examples.ExternalDependencies.Common;
namespace SciChart.Examples.Examples.CreateRadarChart
{
public class UsingRadarChartExampleViewModel : BaseViewModel
{
private readonly ObservableCollection<IRadarPolygonRenderableSeriesViewModel> _renderableSeries;
public UsingRadarChartExampleViewModel()
{
var productADataSeries = new ObservableCollection<IRadarPointViewModel>
{
new RadarPointViewModel {DataValue = 75, AxisId = "salesId"},
new RadarPointViewModel {DataValue = 95, AxisId = "marketingId"},
new RadarPointViewModel {DataValue = 33, AxisId = "developmentId"},
new RadarPointViewModel {DataValue = 40, AxisId = "customerSupportId"},
new RadarPointViewModel {DataValue = 15, AxisId = "informationTechnologyId"},
new RadarPointViewModel {DataValue = 20, AxisId = "administrationId"},
};
var productBDataSeries = new ObservableCollection<IRadarPointViewModel>
{
new RadarPointViewModel {DataValue = 15, AxisId = "salesId"},
new RadarPointViewModel {DataValue = 66, AxisId = "marketingId"},
new RadarPointViewModel {DataValue = 40, AxisId = "developmentId"},
new RadarPointViewModel {DataValue = 90, AxisId = "customerSupportId"},
new RadarPointViewModel {DataValue = 45, AxisId = "informationTechnologyId"},
new RadarPointViewModel {DataValue = 10, AxisId = "administrationId"},
};
var productCDataSeries = new ObservableCollection<IRadarPointViewModel>
{
new RadarPointViewModel {DataValue = 30, AxisId = "salesId"},
new RadarPointViewModel {DataValue = 42, AxisId = "marketingId"},
new RadarPointViewModel {DataValue = 15, AxisId = "developmentId"},
new RadarPointViewModel {DataValue = 30, AxisId = "customerSupportId"},
new RadarPointViewModel {DataValue = 90, AxisId = "informationTechnologyId"},
new RadarPointViewModel {DataValue = 80, AxisId = "administrationId"},
};
var productDDataSeries = new ObservableCollection<IRadarPointViewModel>
{
new RadarPointViewModel {DataValue = 20, AxisId = "salesId"},
new RadarPointViewModel {DataValue = 22, AxisId = "marketingId"},
new RadarPointViewModel {DataValue = 84, AxisId = "developmentId"},
new RadarPointViewModel {DataValue = 15, AxisId = "customerSupportId"},
new RadarPointViewModel {DataValue = 40, AxisId = "informationTechnologyId"},
new RadarPointViewModel {DataValue = 5, AxisId = "administrationId"},
};
_renderableSeries = new ObservableCollection<IRadarPolygonRenderableSeriesViewModel>()
{
new RadarPolygonRenderableSeriesViewModel()
{
DataSeries = productADataSeries,
SeriesName = "Product A",
Stroke = Colors.Blue,
StrokeThickness = 2,
StyleKey = "BlueRadarSeriesStyle",
Fill = new SolidColorBrush {Color = Colors.Blue, Opacity = 0.4},
PointMarker = new TrianglePointMarker { Width = 10, Height = 10, Fill = Colors.Blue, StrokeThickness = 0}
},
new RadarPolygonRenderableSeriesViewModel()
{
DataSeries = productBDataSeries,
SeriesName = "Product B",
Stroke = Colors.Coral,
StrokeThickness = 2,
StyleKey = "CoralRadarSeriesStyle",
Fill = new SolidColorBrush {Color = Colors.Coral, Opacity = 0.4},
PointMarker = new EllipsePointMarker { Width = 10, Height = 10, Fill = Colors.Coral, StrokeThickness = 0}
},
new RadarPolygonRenderableSeriesViewModel()
{
DataSeries = productCDataSeries,
SeriesName = "Product C",
Stroke = Colors.Green,
StrokeThickness = 2,
StyleKey = "GreenRadarSeriesStyle",
Fill = new SolidColorBrush {Color = Colors.Green, Opacity = 0.4},
PointMarker = new CrossPointMarker { Width = 10, Height = 10, Stroke = Colors.Green, StrokeThickness = 2}
},
new RadarPolygonRenderableSeriesViewModel()
{
DataSeries = productDDataSeries,
SeriesName = "Product D",
Stroke = Colors.YellowGreen,
StrokeThickness = 2,
StyleKey = "YellowGreenRadarSeriesStyle",
Fill = new SolidColorBrush {Color = Colors.YellowGreen, Opacity = 0.4},
PointMarker = new SquarePointMarker { Width = 10, Height = 10, Fill = Colors.YellowGreen, StrokeThickness = 0}
}
};
}
public ObservableCollection<IRadarPolygonRenderableSeriesViewModel> RenderableSeries
{
get { return _renderableSeries; }
}
}
}