WPF Chart - Examples
SciChart WPF ships with hundreds of WPF Chart Examples which you can browse, play with, view the source-code and even export each WPF Chart Example to a stand-alone Visual Studio solution. All of this is possible with the new and improved SciChart WPF Examples Suite, which ships as part of the SciChart WPF SDK.
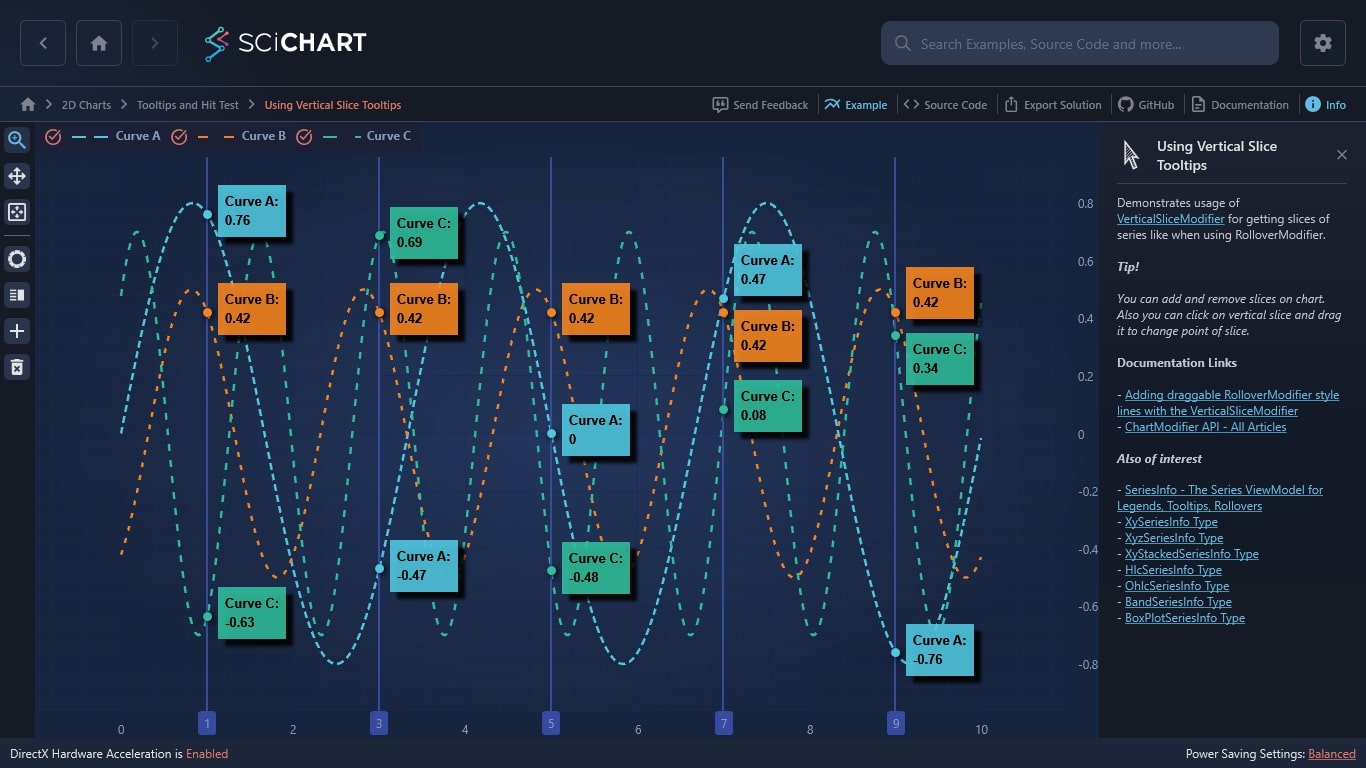
Demonstrates usage of VerticalSliceModifier for getting slices of series like when using RolloverModifier.
Tip!
You can add and remove slices on chart. Also you can click on vertical slice and drag it to change point of slice.
Documentation Links
– Adding draggable RolloverModifier style lines with the VerticalSliceModifier
– ChartModifier API – All Articles
Also of interest
– SeriesInfo – The Series ViewModel for Legends, Tooltips, Rollovers
– XySeriesInfo Type
– XyzSeriesInfo Type
– XyStackedSeriesInfo Type
– HlcSeriesInfo Type
– OhlcSeriesInfo Type
– BandSeriesInfo Type
– BoxPlotSeriesInfo Type

The C#/WPF source code for the Chart Using Vertical Slice Tooltips Example example is included below (Scroll down!).
Did you know you can also view the source code from one of the following sources as well?
- Clone the SciChart.WPF.Examples from Github.
- Or, view source in the SciChart WPF Examples suite.
- Also the SciChart WPF Trial contains the full source for the examples (link below).
SeriesVerticalSlicesExample.xaml
View source code<UserControl x:Class="SciChart.Examples.Examples.InspectDatapoints.SeriesVerticalSlicesExample"
xmlns="http://schemas.microsoft.com/winfx/2006/xaml/presentation"
xmlns:x="http://schemas.microsoft.com/winfx/2006/xaml"
xmlns:d="http://schemas.microsoft.com/expression/blend/2008"
xmlns:ext="http://schemas.abtsoftware.co.uk/scichart/exampleExternals"
xmlns:mc="http://schemas.openxmlformats.org/markup-compatibility/2006"
xmlns:s="http://schemas.abtsoftware.co.uk/scichart"
d:DesignHeight="400"
d:DesignWidth="600"
mc:Ignorable="d">
<UserControl.Resources>
<Style x:Key="sliceStyle" TargetType="s:VerticalLineAnnotation">
<Setter Property="ShowLabel" Value="True" />
<Setter Property="Stroke" Value="#427EF6" />
<Setter Property="IsEditable" Value="True" />
<Setter Property="LabelPlacement" Value="Axis" />
<Style.Triggers>
<Trigger Property="IsSelected" Value="True">
<Setter Property="Stroke" Value="Red" />
<Setter Property="StrokeThickness" Value="3" />
</Trigger>
</Style.Triggers>
</Style>
</UserControl.Resources>
<Grid>
<Grid.ColumnDefinitions>
<ColumnDefinition Width="Auto" />
<ColumnDefinition Width="*" />
</Grid.ColumnDefinitions>
<ext:SciChartInteractionToolbar x:Name="UserToolbar" TargetSurface="{Binding Source={x:Reference Name=sciChart}}">
<ext:FlyoutMenuButton x:Name="addVerticalSliceTooltip"
HorizontalAlignment="Left"
Click="OnCreateSliceClick"
Content="+"
FontSize="18"
Padding="0"
Style="{StaticResource FlyoutMenuButtonStyle}">
<ext:FlyoutMenuButton.PopupContent>
<StackPanel MinWidth="150" Orientation="Vertical">
<TextBlock MaxWidth="150"
Margin="5"
FontSize="12"
Foreground="White"
Text="Click here then click on the chart to add a slice"
TextWrapping="Wrap" />
</StackPanel>
</ext:FlyoutMenuButton.PopupContent>
</ext:FlyoutMenuButton>
<ext:FlyoutMenuButton x:Name="removeVerticalSliceTooltip"
HorizontalAlignment="Left"
Click="OnDeleteSelectedSliceClick"
Content="-"
FontSize="18"
Padding="0"
Style="{StaticResource FlyoutMenuButtonStyle}">
<ext:FlyoutMenuButton.PopupContent>
<StackPanel MinWidth="150" Orientation="Vertical">
<TextBlock MaxWidth="150"
Margin="5"
FontSize="12"
Foreground="White"
Text="Now click a slice to delete it"
TextWrapping="Wrap" />
</StackPanel>
</ext:FlyoutMenuButton.PopupContent>
</ext:FlyoutMenuButton>
</ext:SciChartInteractionToolbar>
<s:SciChartSurface Name="sciChart" Grid.Column="1">
<s:SciChartSurface.RenderableSeries>
<s:FastLineRenderableSeries Stroke="#E6F867"
StrokeDashArray="7 4"
StrokeThickness="3" />
<s:FastLineRenderableSeries Stroke="#4EDE4B"
StrokeDashArray="5 8"
StrokeThickness="3" />
<s:FastLineRenderableSeries Stroke="#E91FE9"
StrokeDashArray="7 9"
StrokeThickness="3" />
</s:SciChartSurface.RenderableSeries>
<s:SciChartSurface.XAxis>
<s:NumericAxis DrawMajorBands="True"
GrowBy="0.1, 0.1"
s:VerticalSliceModifier.AxisLabelContainerStyle="{x:Null}" />
</s:SciChartSurface.XAxis>
<s:SciChartSurface.YAxis>
<s:NumericAxis GrowBy="0.1, 0.1" />
</s:SciChartSurface.YAxis>
<s:SciChartSurface.ChartModifier>
<s:ModifierGroup>
<s:VerticalSliceModifier Name="sliceModifier">
<s:VerticalSliceModifier.VerticalLines>
<s:VerticalLineAnnotation Style="{StaticResource sliceStyle}" X1="1" />
<s:VerticalLineAnnotation Style="{StaticResource sliceStyle}" X1="3" />
<s:VerticalLineAnnotation Style="{StaticResource sliceStyle}" X1="5" />
<s:VerticalLineAnnotation Style="{StaticResource sliceStyle}" X1="7" />
<s:VerticalLineAnnotation Style="{StaticResource sliceStyle}" X1="9" />
</s:VerticalSliceModifier.VerticalLines>
</s:VerticalSliceModifier>
<s:LegendModifier Margin="0,0,0,5"
LegendPlacement="Top"
Orientation="Horizontal"
ShowLegend="True" />
</s:ModifierGroup>
</s:SciChartSurface.ChartModifier>
</s:SciChartSurface>
</Grid>
</UserControl>
SeriesVerticalSlicesExample.xaml.cs
View source code// *************************************************************************************
// SCICHART® Copyright SciChart Ltd. 2011-2022. All rights reserved.
//
// Web: http://www.scichart.com
// Support: support@scichart.com
// Sales: sales@scichart.com
//
// SeriesVerticalSlicesExample.xaml.cs is part of the SCICHART® Examples. Permission is hereby granted
// to modify, create derivative works, distribute and publish any part of this source
// code whether for commercial, private or personal use.
//
// The SCICHART® examples are distributed in the hope that they will be useful, but
// without any warranty. It is provided "AS IS" without warranty of any kind, either
// expressed or implied.
// *************************************************************************************
using System;
using System.Linq;
using System.Windows;
using System.Windows.Controls;
using System.Windows.Input;
using SciChart.Charting.Model.DataSeries;
using SciChart.Charting.Visuals.Annotations;
using SciChart.Examples.ExternalDependencies.Data;
namespace SciChart.Examples.Examples.InspectDatapoints
{
/// <summary>
/// Interaction logic for SeriesVerticalSlicesExample.xaml
/// </summary>
public partial class SeriesVerticalSlicesExample : UserControl
{
// A drop in replacement for System.Random which is 3x faster: https://www.codeproject.com/Articles/9187/A-fast-equivalent-for-System-Random
private readonly Random _random = new Random();
public SeriesVerticalSlicesExample()
{
InitializeComponent();
Loaded += OnLoaded;
}
private void OnLoaded(object sender, RoutedEventArgs routedEventArgs)
{
var dataSeries0 = new UniformXyDataSeries<double>(0d, 0.01) { SeriesName = "Curve A" };
var dataSeries1 = new UniformXyDataSeries<double>(0d, 0.01) { SeriesName = "Curve B" };
var dataSeries2 = new UniformXyDataSeries<double>(0d, 0.01) { SeriesName = "Curve C" };
var data1 = DataManager.Instance.GetSinewaveYData(0.8, 0.0, 1000, 3);
var data2 = DataManager.Instance.GetSinewaveYData(0.5, -1.0, 1000, 5);
var data3 = DataManager.Instance.GetSinewaveYData(0.7, 0.75, 1000, 7);
dataSeries0.Append(data1);
dataSeries1.Append(data2);
dataSeries2.Append(data3);
using (sciChart.SuspendUpdates())
{
sciChart.RenderableSeries[0].DataSeries = dataSeries0;
sciChart.RenderableSeries[1].DataSeries = dataSeries1;
sciChart.RenderableSeries[2].DataSeries = dataSeries2;
}
sciChart.ZoomExtents();
}
private void OnCreateSliceClick(object sender, RoutedEventArgs e)
{
MouseButtonEventHandler mouseClick = null;
mouseClick = (s, arg) =>
{
MouseLeftButtonUp -= mouseClick;
var mousePoint = arg.GetPosition((UIElement)sciChart.GridLinesPanel).X;
var slice = new VerticalLineAnnotation()
{
X1 = sciChart.XAxis.GetDataValue(mousePoint),
Style = (Style)Resources["sliceStyle"]
};
sliceModifier.VerticalLines.Add(slice);
};
MouseLeftButtonUp += mouseClick;
}
private void OnDeleteSelectedSliceClick(object sender, RoutedEventArgs e)
{
var selectedSlices = sliceModifier.VerticalLines.Where(annotation => annotation.IsSelected).ToList();
foreach (var slice in selectedSlices)
{
sciChart.Annotations.Remove(slice);
}
}
}
}
