Telehealth Charting & Dashboard Library
Medical-grade, high-performance telehealth charting and dashboard library.
Build your telehealth platform with one of the best chart libraries for real-time medical monitoring data.
SciChart has provided high-precision data visualization for healthcare platforms since 2012.
- Endorsed by over 90% of the leading MedTech companies.
- Trusted by over 10,000 licensed developers in over 90 countries.
- HIPAA-compliant and FDA/ISO-ready.
- Our customers win awards and get industry recognition.
- Available in JavaScript, iOS, Android, and WPF with support for Linux.
- Support millions of patients worldwide.
Trusted By Industry Leaders


What Unique Problems Have We Solved?

FDA Certified, $17.5M Funded, Interface Award Secured
SciChart powered the ANNE® One platform’s FDA-cleared neonatal monitoring dashboards. Our software supported real-time ECG and respiration waveforms through high-performance, low-resource visualization.
With our customizable API, SciChart delivered intuitive interfaces that earned the Red Dot Design Award and supported $17.5M in funding, including a Gates Foundation grant. These scalable, accessible solutions are advancing maternal and neonatal care, particularly in low-resource settings, setting a benchmark for telehealth innovation.

Powering Philips Cross-Platform HealthSuite Across 3000+ Facilities
Integrated into Philips Capsule MDIP and Philips HealthSuite Platform, SciChart provides advanced data visualization for over 3,000 healthcare facilities worldwide. With native Android and JavaScript chart libraries, SciChart ensures high-performance visualizations across desktop, web, embedded devices and mobile.
As the only truly cross-platform charting library, SciChart’s unified API simplifies development and maintenance, enabling seamless integration into large-scale telehealth charting solutions. This makes it the ideal choice for precise, real-time data visualization in distributed healthcare environments.
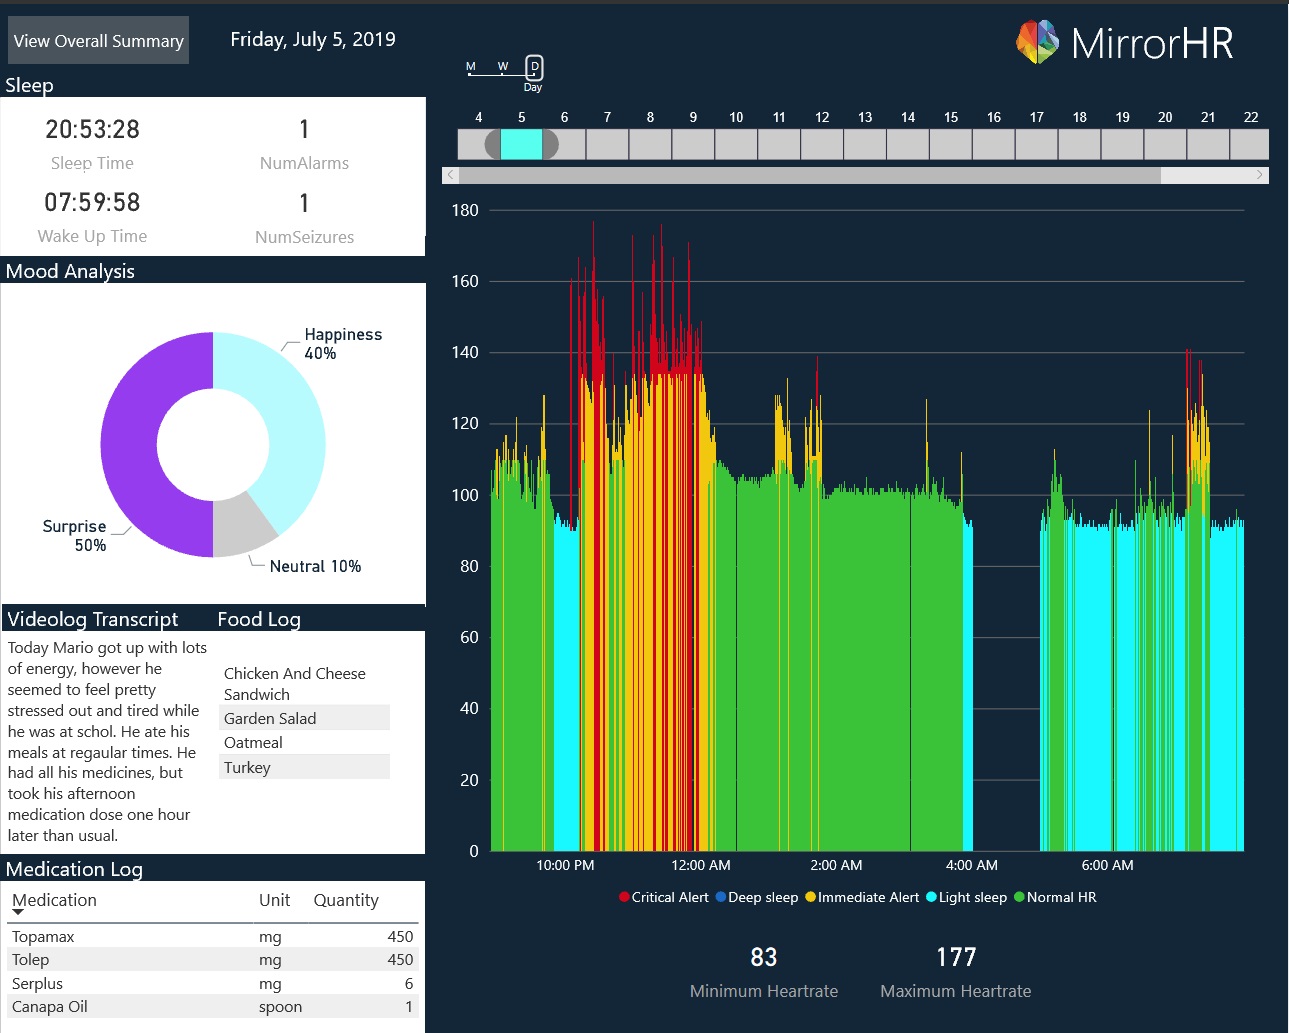
Advancing Remote Pediatric Seizure Monitoring
SciChart powers real-time data visualization in the MirrorHR epilepsy monitoring kit, developed by Microsoft staff. SciChart enables wearable devices to stream and analyze physiological signals, including heart rate variability and motion data.
These insights allow caregivers to detect potential seizures more quickly. With cross-platform capabilities and precision rendering, SciChart supports telehealth charting innovations, providing families with actionable data and peace of mind in managing complex pediatric conditions.
What Makes SciChart One of the Best Chart Libraries for Real-Time Medical Monitoring Data?
SciChart didn’t become one of the leading telehealth data visualization software by accident – we designed it that way.
With SciChart, you can:
- Accelerate product development and time-to-diagnosis with intuitive, interactive and synchronized telehealth data analytics visualization.
- Handle real-time data with high-fidelity 64-bit precision.
- Create unique customizations within your software suite.
- Avoid the need to update your hardware so frequently.
- Keep your patient data secure and accurate.
Telehealth Case Studies
See SciChart in action across pioneering telehealth systems that require the utmost reliability and real-time rendering.
Honestly one of those libraries that just gets out of your way. Performance with large datasets is genuinely impressive — smooth and responsive without any tricks or workarounds. The API clicked quickly and the docs are actually good, which is rarer than it should be. Every chart type I've needed has been there, and the visual quality is great. Hard to imagine reaching for anything else at this point.
See the Difference with SciChart
If you’re looking for telehealth tools with real-time charting features, try SciChart today and see the difference.
Examples & Demos
Discover examples and demos used for telehealth charting projects around the world.
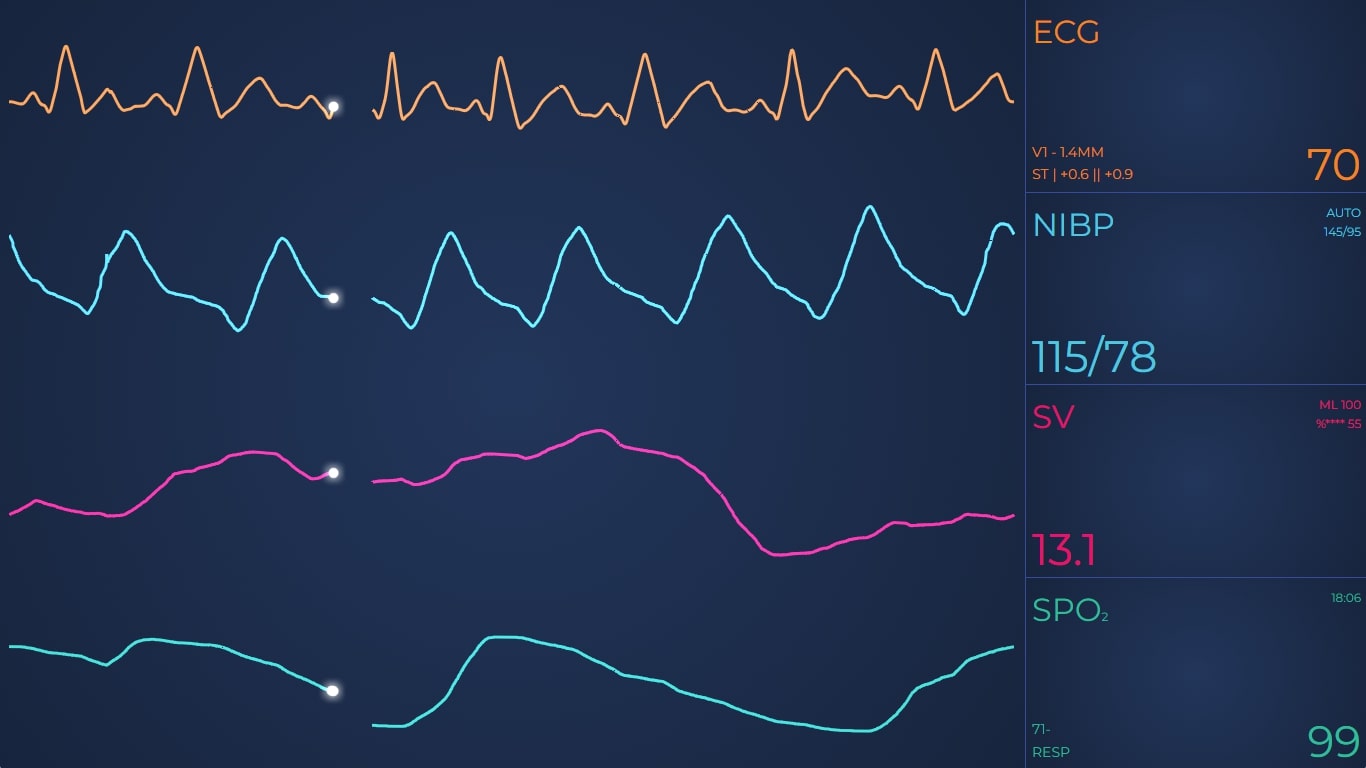
Build ECG / EKG Applications
SciChart powers high-performance, real-time ECG/EKG charts, visualizing vital metrics such as heart rate, SPO2, blood pressure, and more. GlowShader effects enhance visualization with oscilloscope-style highlights, enabling intuitive, actionable insights for telehealth applications.

Patient Vitals Visualization Made Effortless
Effortlessly navigate patient data with SciChart overview charts. Zoom, pan, and resize visualizations using draggable controls, or customize the overview to highlight critical trends and annotations, streamlining clinical workflows.
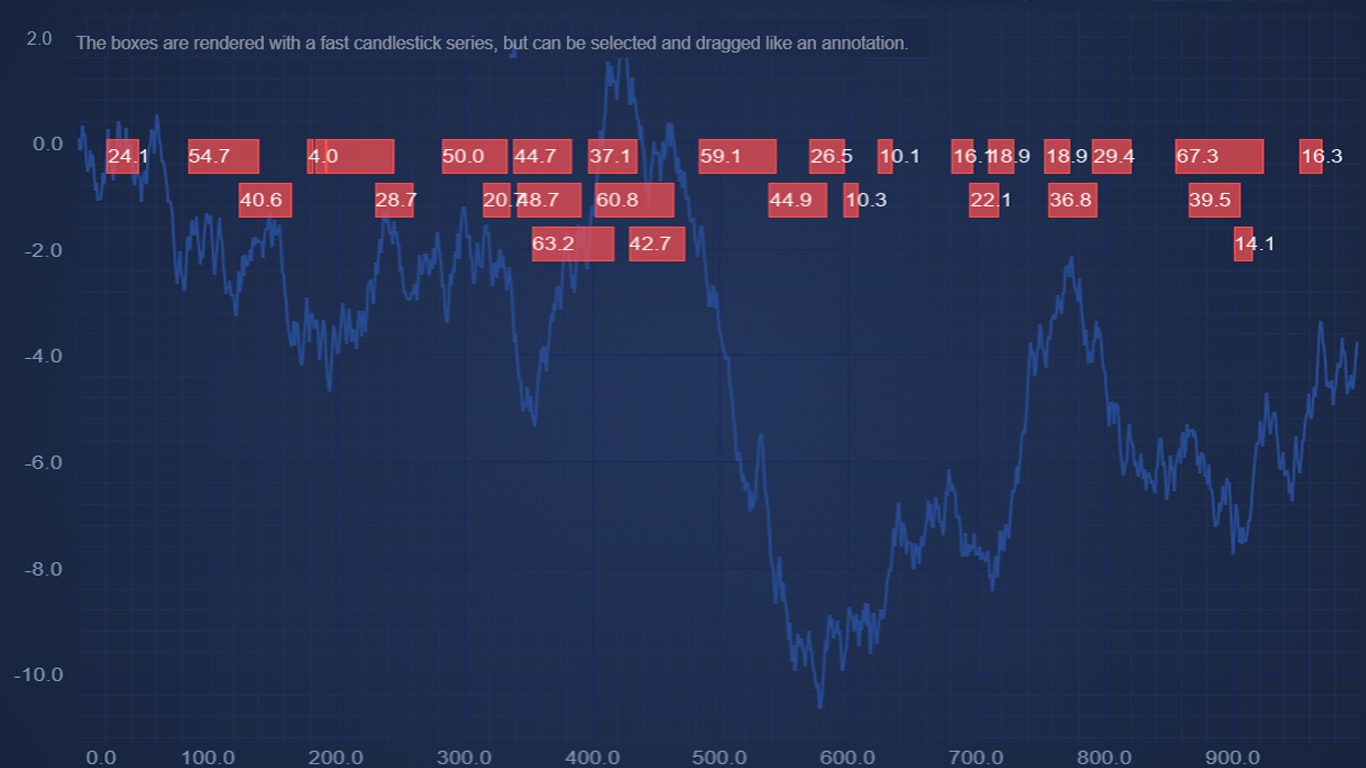
Label and Annotate on the Chart Surface
Transform data points into interactive, draggable event markers. Label and annotate key events directly on charts, simplifying data review and empowering clinicians to track critical insights effortlessly.
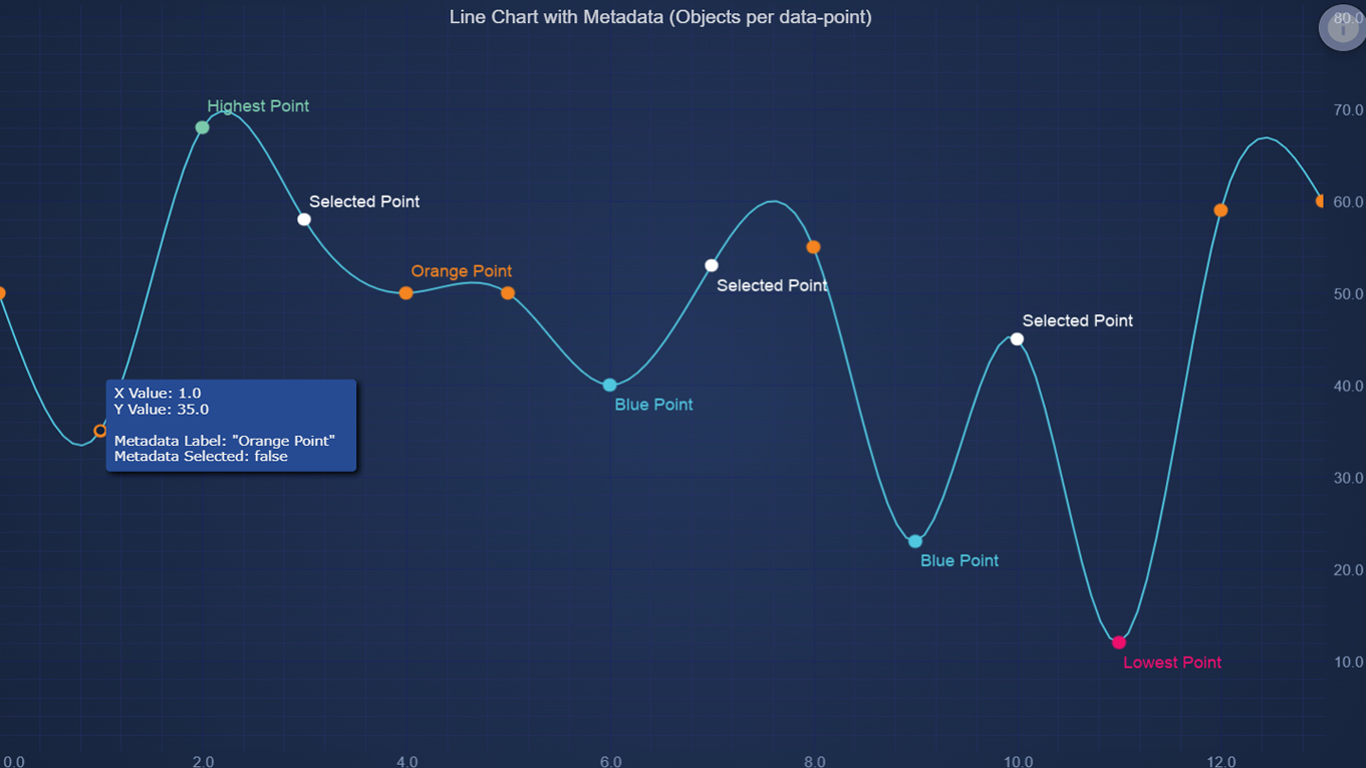
Enrich Data Through Tooltips
Add contextual metadata to data points with SciChart.js. Create detailed tooltips to provide clinicians with vital information at a glance, improving decision-making in complex datasets.
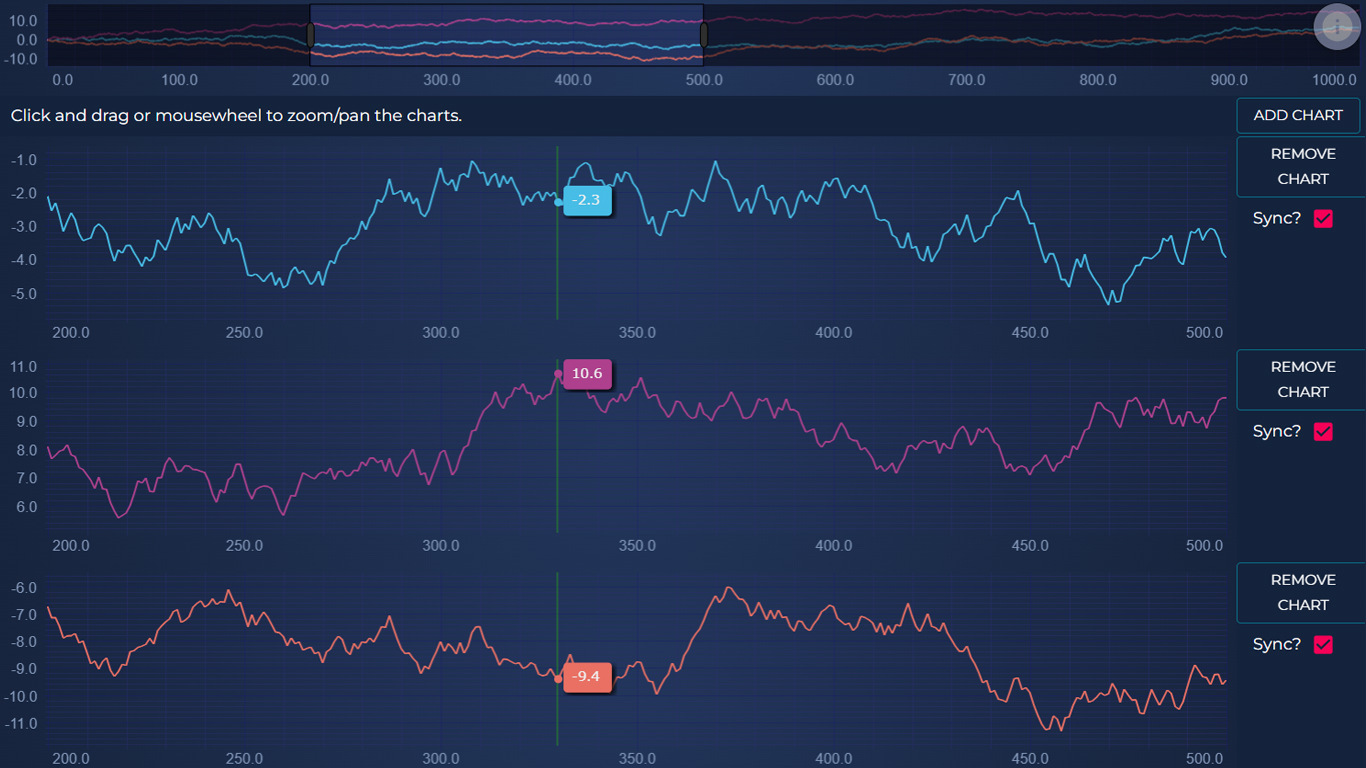
Compare Vitals Seamlessly
Link multiple dynamic charts with synchronized layouts and ranges. Integrate overview charts for seamless navigation across patient data, ensuring comprehensive analysis in real time.
What Features to Expect With SciChart?
Take a look at the chart performance you can achieve with SciChart and how our extensive charting features contribute to fully customizable charts.

Chart Performance
- Zero memory growth
- GPU-accelerated
- WebAssembly-powered
- Sub-millisecond interactivity even on larger datasets
- 2.3MB bundle size
- Float64 array and FIFO mode for enhanced data efficiency
- Cross-platform performance across JavaScript, WPF/.NET, and iOS/Android
- Continuous streaming
- Deterministic rendering
- Visualize 100 M+ points per dataset
- Continuous 24/7 operation
- Sustain 200k points per second
- Refresh 64+ charts in under one second
- Embeddable within MES, YMS, and ATE systems
- Direct integration into React, Angular, and Vue
Extensive Charting Features
- 2D & 3D plotting
- Animation of data
- Annotations on chart
- Zoom & pan
- Tooltips
- Touch interaction
- Link multiple charts
- Legend customization
- Logarithmic axis
- Multiple X & Y-Axis
- Per-point coloring
- Programmatically change viewport
- Theme or template customization
5-Star Support for Developers
See the level of support developers get when building real-time chart solutions.
 Responsive 5-Star Technical Support
With our 5-star technical support subscription, we aim to answer all support tickets within one business day* and often even faster.
 Get Answers Fast with our AI Assistant
Ask our AI Assistant anything about SciChart and it will answer your questions fast!
 Knowlegable Support Forums
With nearly 4000 answered support requests on our public support forum, you’ll never be left without an answer.
 Extensive Documentation
1000s of pages of support documentation across all platforms for expert guidance on getting the most from SciChart.
 Tutorials & Videos
Our regularly updated YouTube channel will help you understand what’s possible and answers the most commonly asked questions.
 Hundreds of Example Charts
Over 350 chart examples will get you what you need to get out of the blocks more quickly.
Testimonials & Reviews
Award Winning Software – Continually Rated Best with Hundreds of 5-Star Reviews
With a rating of 4.8, SciChart is one of the highest rated chart libraries in the world*, used by over 10,000 expert developers worldwide.
Read All Reviews