Read on to see how IMT AG adopted SciChart for Android to run on their low power & cost hardware testing device for the medical indisrty the CITREX H5 voted “The best mobile test device in its class”.
Platform: Android
Industry: Engineering & Healthcare
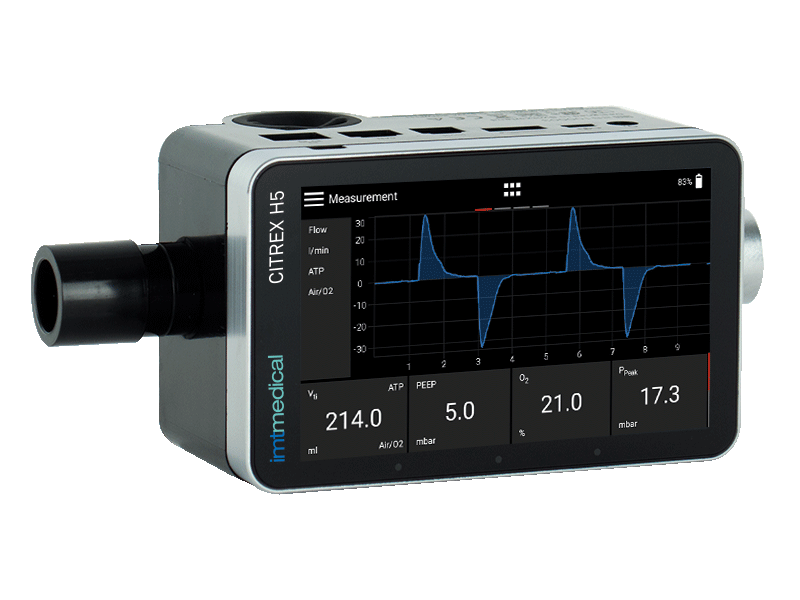
The CITREX H5 project was built as a testing device for medical industry, that measures the performance of breathing ventilators. Described as a “Gas Flow Analyzer”, the CITREX H5 was designed as an all-in-one testing device for biomedical technicians, independent service organisations and anaesthesia device and ventilation manufacturers.
Challenge: To retain a smooth Realtime line and mountain chart depiction on a custom testing device for medical industry and embedded system with very low power and cost hardware. Limited to a Dual core A9 CPU at under 800Mhz and only 1GB RAM running Android Lollipop 5.1.1 previous in house charting solutions couldn’t function.
Solution: Android charts by SciChart were designed in collaboration with IMT AG to function with their bespoke hardware limitations creating an extremely lean & efficient software package. SciChart’s High Performance capabilities were used to handle the data sets coming from 20 to 30 sensors, new data each 5 ms, whilst also enabling extra features such as pinch to zoom, drag/touch to pan, Axis drag and tooltips on all SciChart.Android charts.
