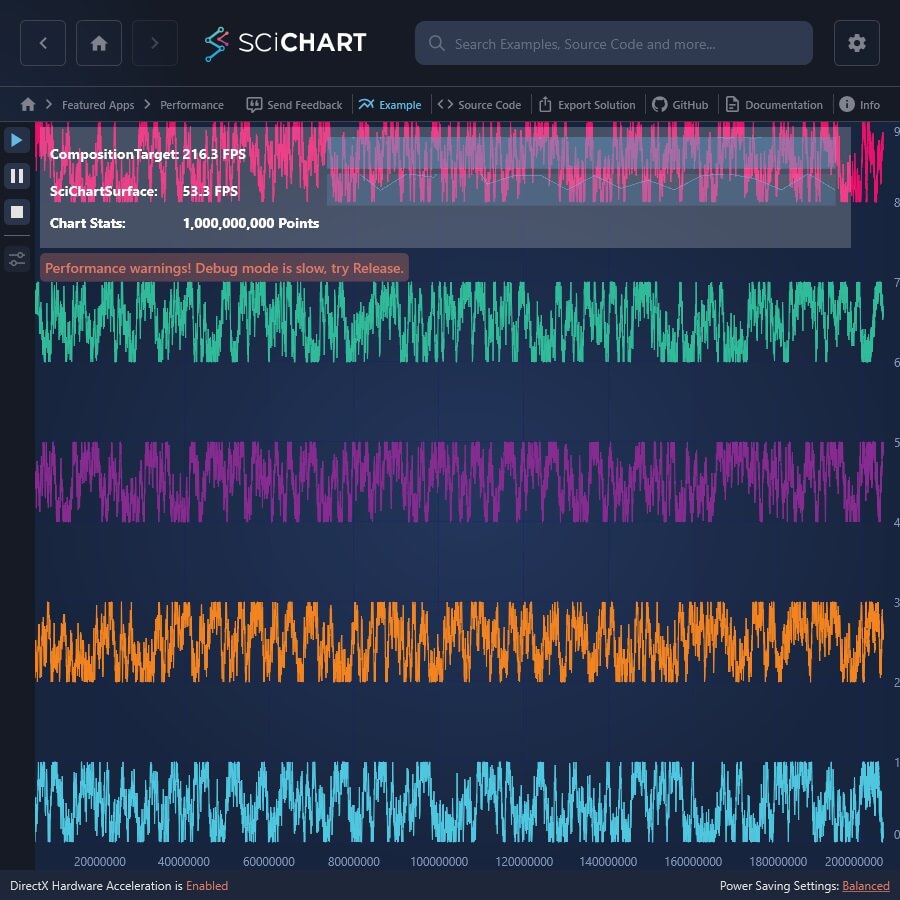
SciChart® the market leader in Fast WPF Charts, WPF 3D Charts, iOS Chart, Android Chart and JavaScript Chart Components
At SciChart we focus on speed and performance first. Our charts are engineered to be the fastest possible to allow demanding scientific, engineering and financial apps across platforms (WPF, iOS, Android, Xamarin).
Read on to find out why SciChart is Perfect for Big Data & Realtime Chart Applications
Before SciChart was created, most chart components used default graphics libraries (provided by the Operating system) to draw charts, which resulted in poor performance when charting more than a few thousand datapoints
While most applications don't need to show thousands or millions of data-points, some do. When SciChart v1 was created in 2012 there were no WPF Charts in the world which used Hardware Acceleration and most were limited to a few thousand points at most. This meant creating scientific or realtime charting applications was simply impossible
Immediately after releasing SciChart v1, we had loads of users report that previously impossible projects were now possible. SciChart Brought the ability to display Big Data and Realtime charts will millions of data-points to the Windows (WPF) platform for the First Time.
Further in 2020, We have invested in the development of our new cross-platform Visual Xccelerator engine, that works for all our charts on WPF, iOS and Android. The WPF charts rendering is now up to 100x faster and is capable of plotting of billion of points.
This makes SciChart the Perfect Choice for Big Data, & demanding applications requiring high-performance charts on the Windows and Mobile platforms.
Our charts already provided the cutting edge in data visualisation for WPF, iOS and Android applications. Our library is used across sectors by market leaders in scientific & financial sectors to deliver unbelievable results. However, our top feature request by our customers was to push the boundaries and limitations of WPF Chart performance even further.
How fast was SciChart WPF v5: We’ve built the worlds most flexible, and fully featured WPF charting component, rated by users as the best WPF chart. Read about SciChart version 5 performance benchmark. But with this popular feature request of ‘faster performance’ we’ve focused on improving our charting speed even more, bringing cutting edge GPU-accelerated technology to sectors such Finance, Scientific, Medical, Aerospace, F1 & more.
Cross-platform improvement: To achieve this, we have built a completely new proprietary cross-platform rendering engine, code-named ‘Visual Xccelerator ™’. Our engine fully leverages DirectX/OpenGL/Metal and is implemented in C++ for unbelievable performance. We’ve combined this with a complete re-write of our SciChart WPF internals, having redesigned the component from the ground up, to fully leverage GPU hardware and to scale with future hardware improvements.
Up to 10,240% faster: SciChart WPF Xccelerated Edition is up to 10,240% faster than SciChart v5.x, on average ~5,000% faster, surpassing all known WPF Chart competitors. Read about SciChart WPF v6 performance.
Across platforms with SciChart (iOS, Android, WPF) you can draw millions of data-points with our real-time, high performance charts. Have a look below
at performance tests which we have performed.
In a recent campaign to solicit reviews from our customers, we were blown away by the magnitude of the response from customers giving us 5-star ratings. Many of the reviews and testimonials mentioned SciChart's Performance.
Performance matters to our customers, who are using SciChart in scientific, medical, engineering and financial fields to create previously impossible applications, across platforms, on Windows (WPF), mobile (iOS Android) and Xamarin.
We ship a number of performance demos with SciChart to show you just what we can do. If you want to take a look then get your development team to download our examples for our WPF, iOS, Android and Xamarin Chart Components which contain our performance demos!
There's more! Have a look at the case studies below where customers of SciChart WPF, iOS and Android have used our high performance charting libraries to create incredible apps using big-data and real-time charting.
Our charting software is written by scientific software engineers with a high proportion of PhD Educated / Masters Degree educated developers on the team, in subjects such as Applied Mathematics, Electronics, Signal Processing, Engineering, Computer Science and more.
We are experts in performance optimization and thought leaders in cross platform, real-time 2D & 3D graphics and charting. We have been working on charting full-time since 2012, and the company owner wrote his first high performance .NET charts in 2005! We are the right team to deliver Big Data & High Performance Realtime Charting to your WPF, iOS, Android and Xamarin applications.