SciChart.js v5.2 and Financial Drawing Tools Released!
Continuing our rapid release cadence of new features every ~8 weeks, today we have an announcement to make. SciChart.js v5.2 […]

In this post, we compare the performance of five of the major Android Charting Libraries vs. our own brand new & upcoming Android Chart: SciChart for Android. In order to conduct a fair comparison, we’ve developed a comparison application which generates several different chart types and measures refresh rate (FPS – Frames per Second) on each chart library.
Our findings were that:
At smaller datasets all the charts appeared fine, however once we increased the volume of data and rate of updating the Android Chart control, all of the above slowed down significantly except for SciChart. In some tests SciChart for Android registered between 2-5x faster than the nearest competitor, and in one, a staggering 255x faster.
For this reason we propose SciChart’s Android Chart as the best Android Chart Library where real-time updates, or visualisation of big-data is required.
To avoid uncorroborated statements, we’ve tried find out what the most popular Android Charts can offer in terms of speedf. To our big surprise, we haven’t found any performance analysis of the existing charting packages! And that in-spite of the fact that similar questions have been asked a lot at StackOverflow, Quora, etc.! Which means that this question is topical among the Android developer community.
So we’ve created an Android application which performs a comparison of different charting packages. It was designed to help evaluating their performance under different test conditions, ranging from mild to extreme. The following aspects were considered to be the most important for such analysis:
We have compared the performance of Android Charts by SciChart against the most popular and renowned Android charting libraries, including:
We also had a look at
However due to time constraints, plus poor stability and performance of these libraries when large data was appended, we have omitted them from the results – for now.
There are four different test cases run in our Android Charts Performance Comparison app, under different conditions. They are designed to really really stress the chart, by having huge numbers of series, or points, or many updates per second, with varying thickness of pens / number of pixels filled.
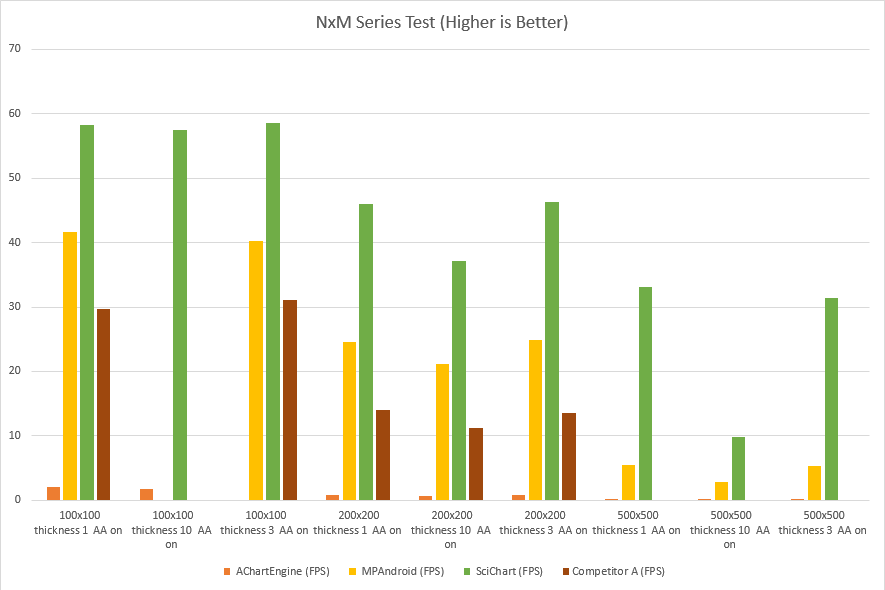
Test 1: NxM Series Test
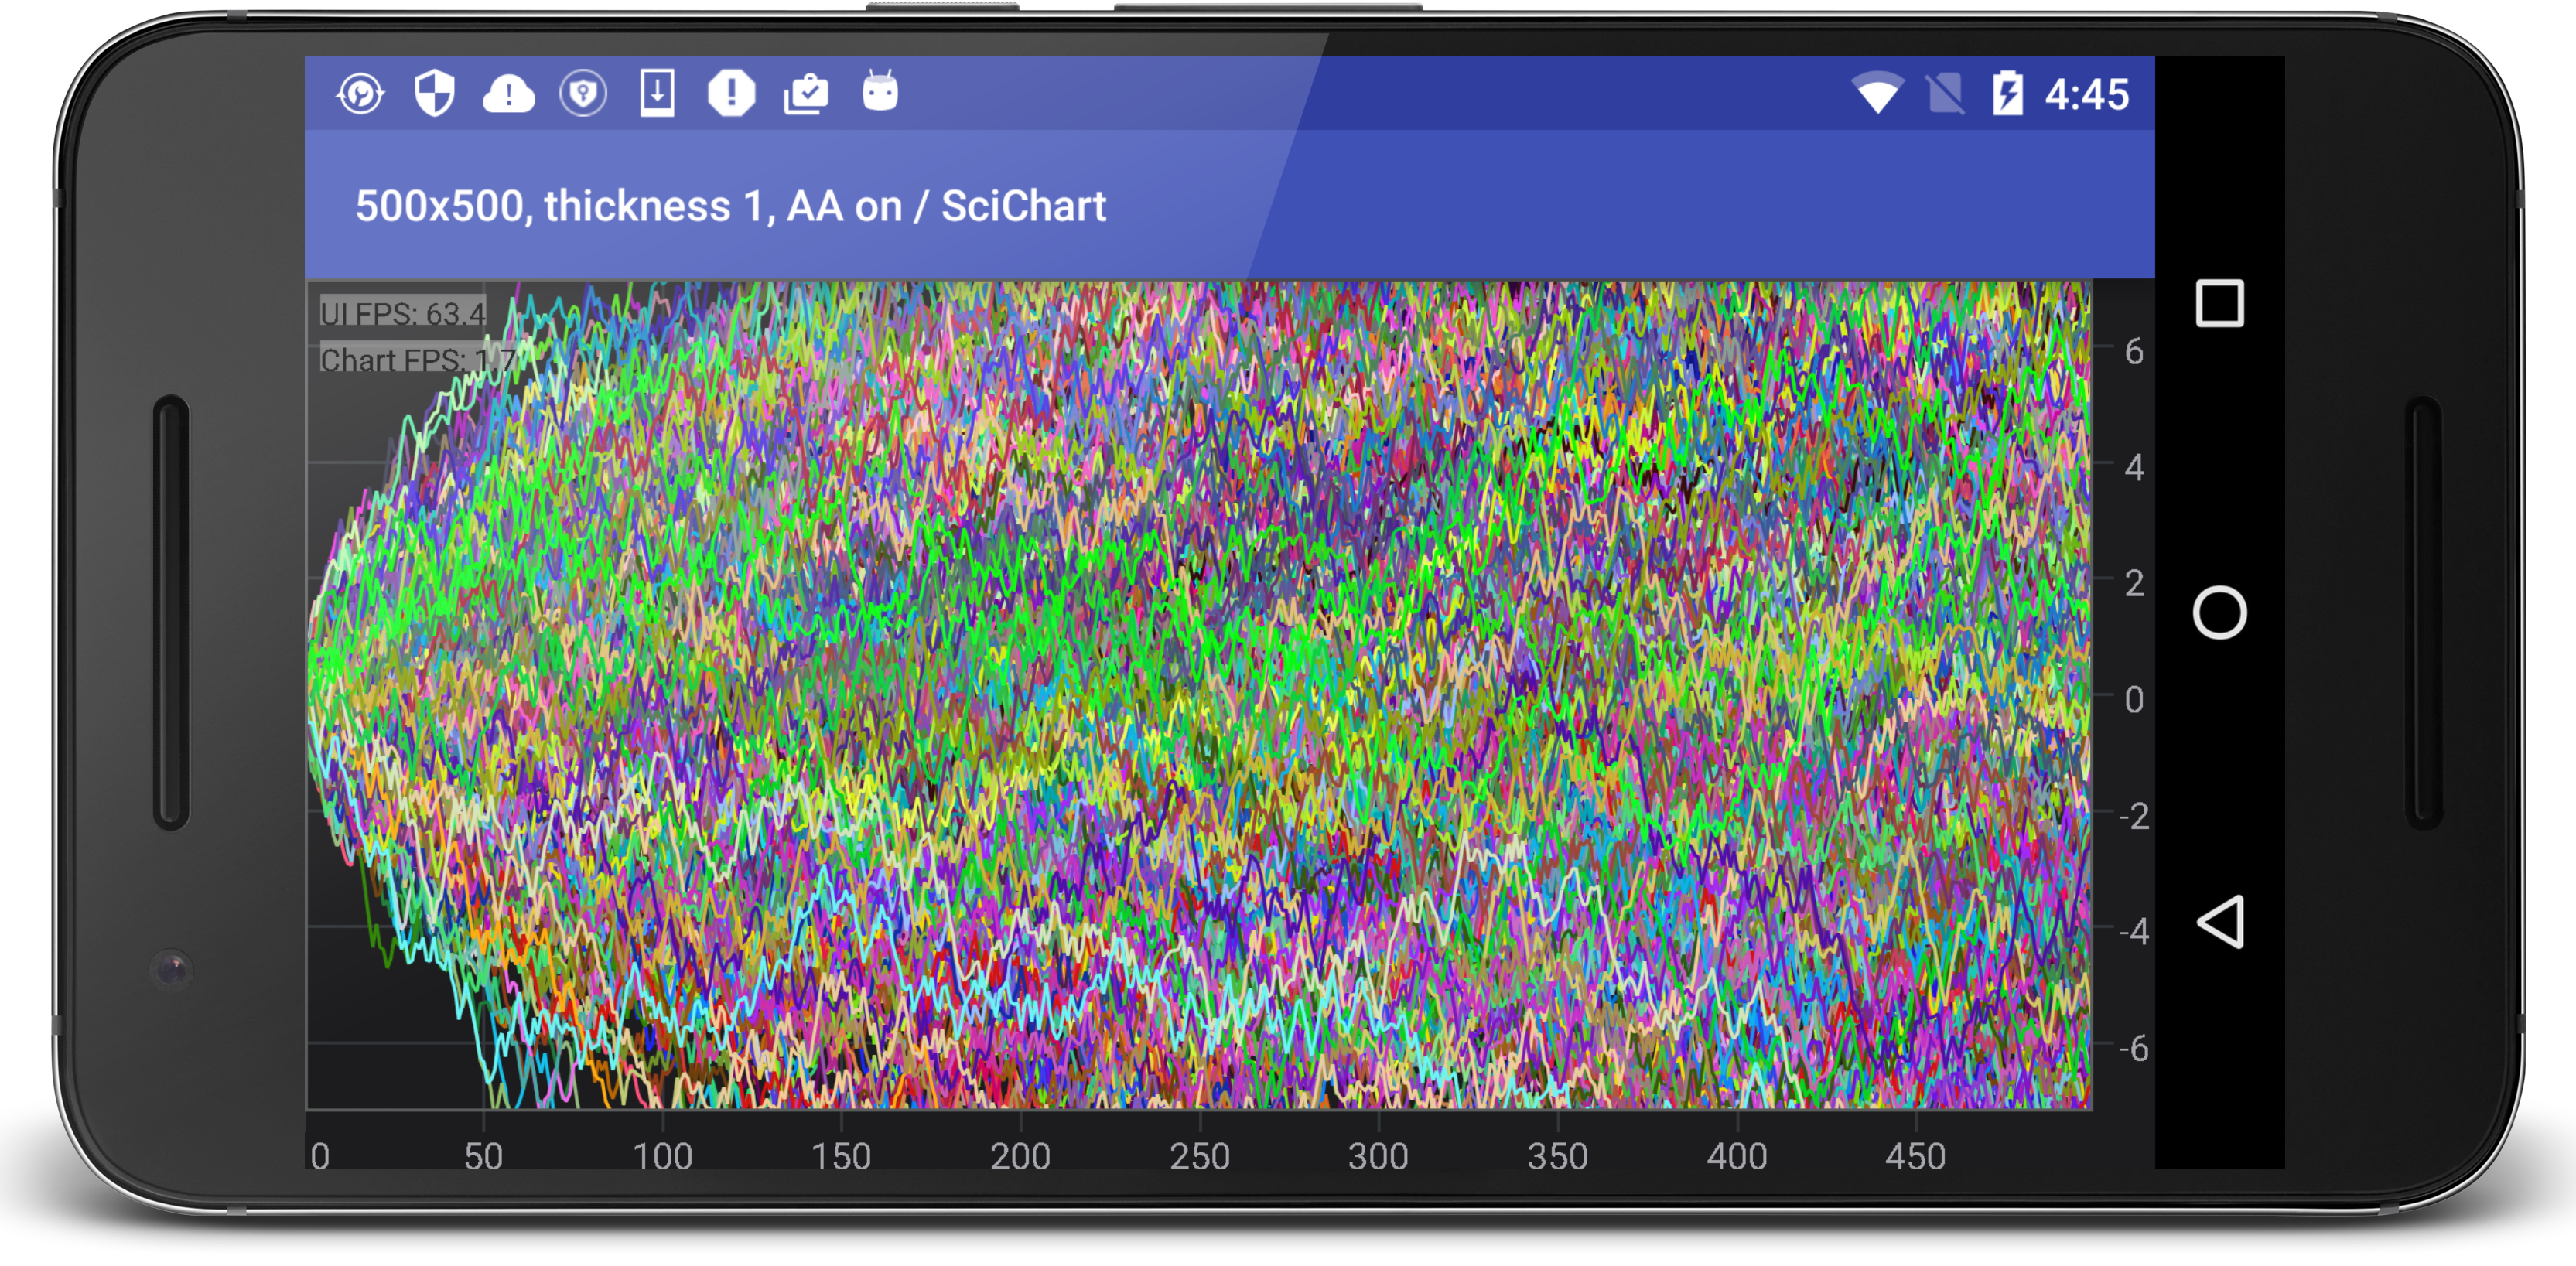
In this test, N series of M points are appended to series, then the chart redraws (the same data) as fast as possible by just resizing the Y-Axis for 10 seconds per test.
The FPS is measured using the Choreographer class from the Android API.
Areas Stressed: Iterating Data Series, Coordinate Transformation and Drawing.
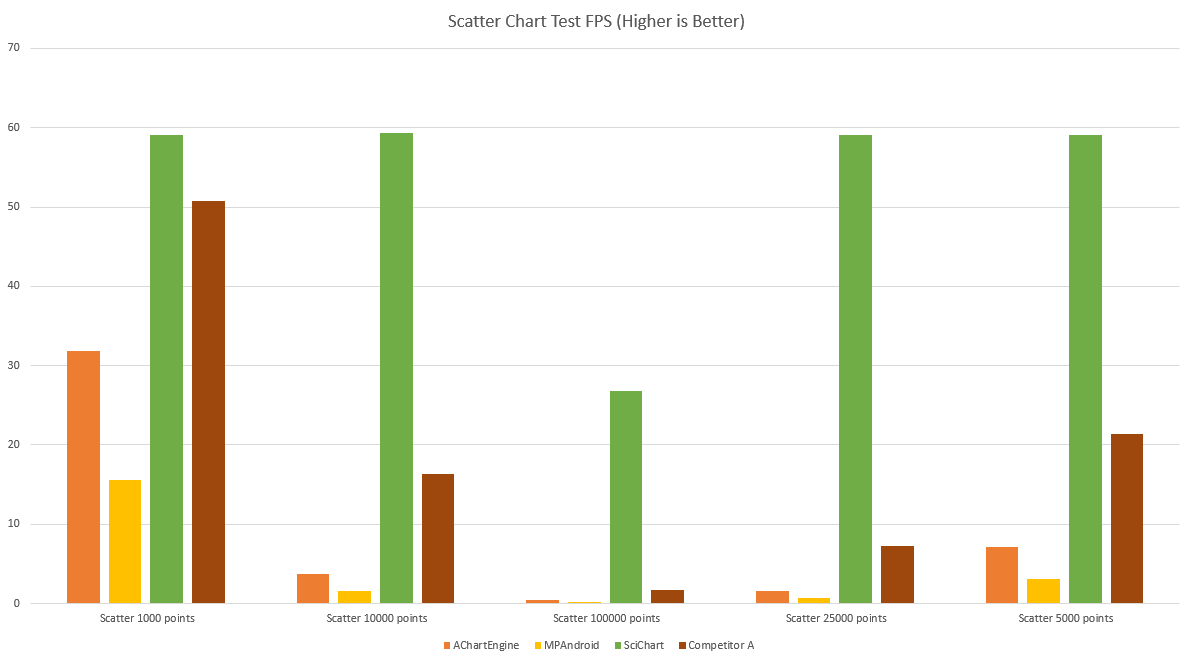
Test 2: Scatter Series Test
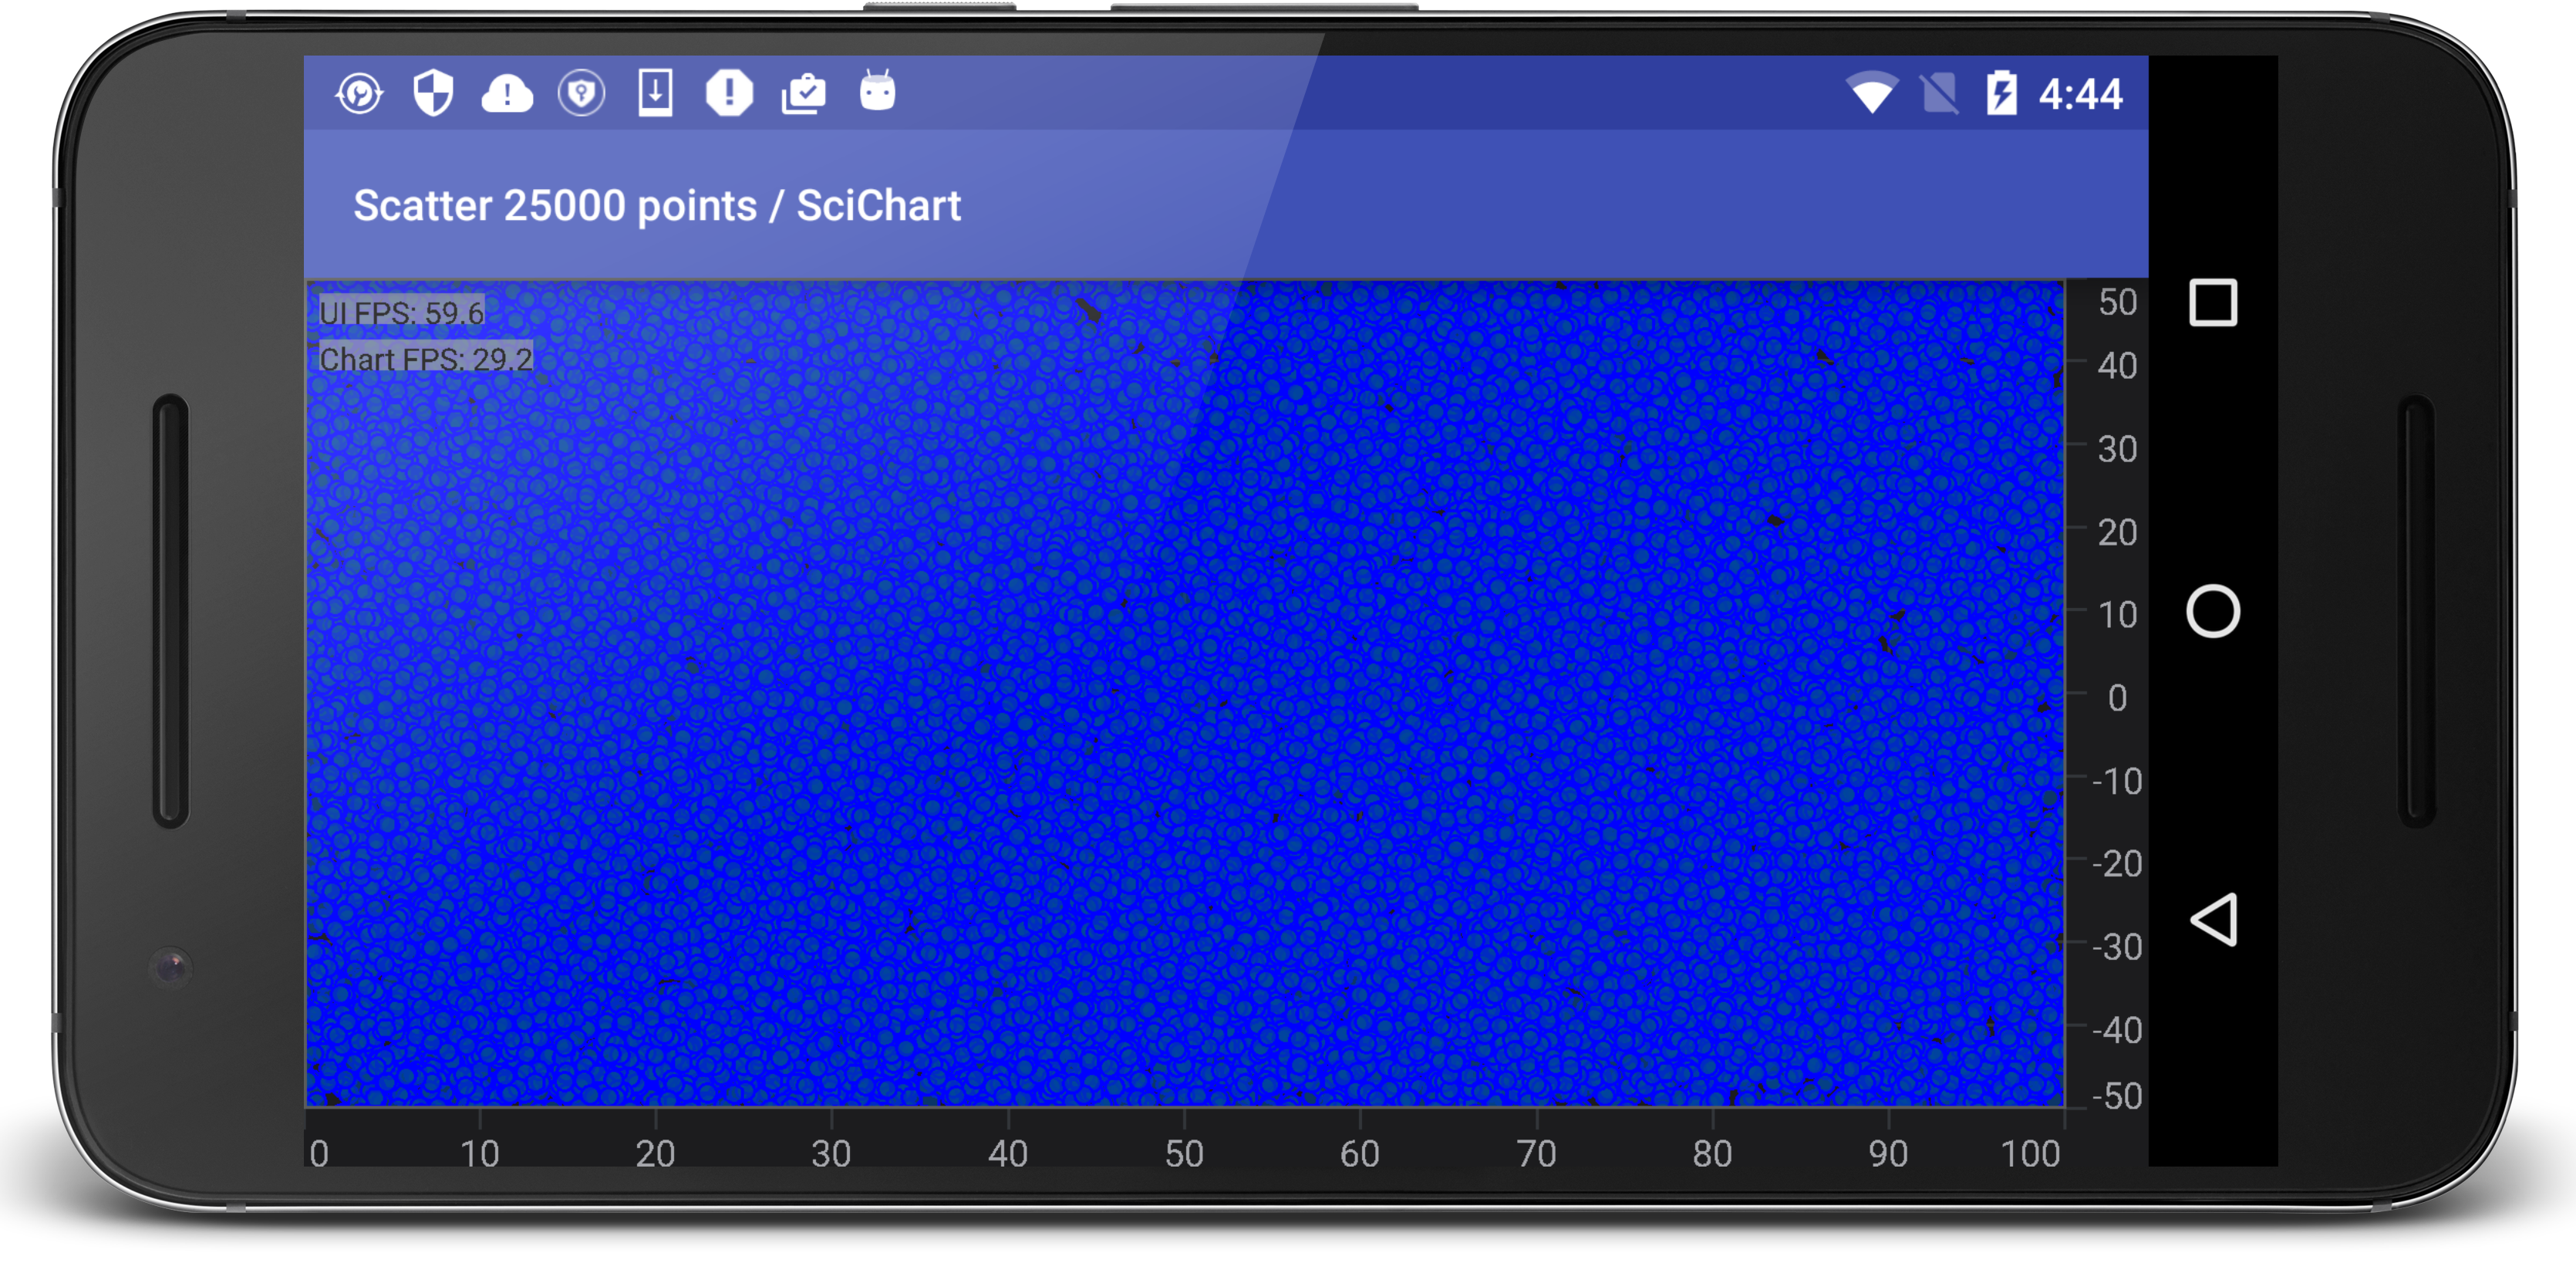
In this test, N Scatter points (ellipses) are appended to a series, then the chart redraws. Immediately after, the points are updated in a Brownian motion fashion and the chart is drawn again.
The FPS is measured using the Choreographer class from the Android API.
Areas Stressed: Coordinate Transformation, Geometry Generation (Ellipse) and Drawing.
Test 3: FIFO (Scrolling) Series Test
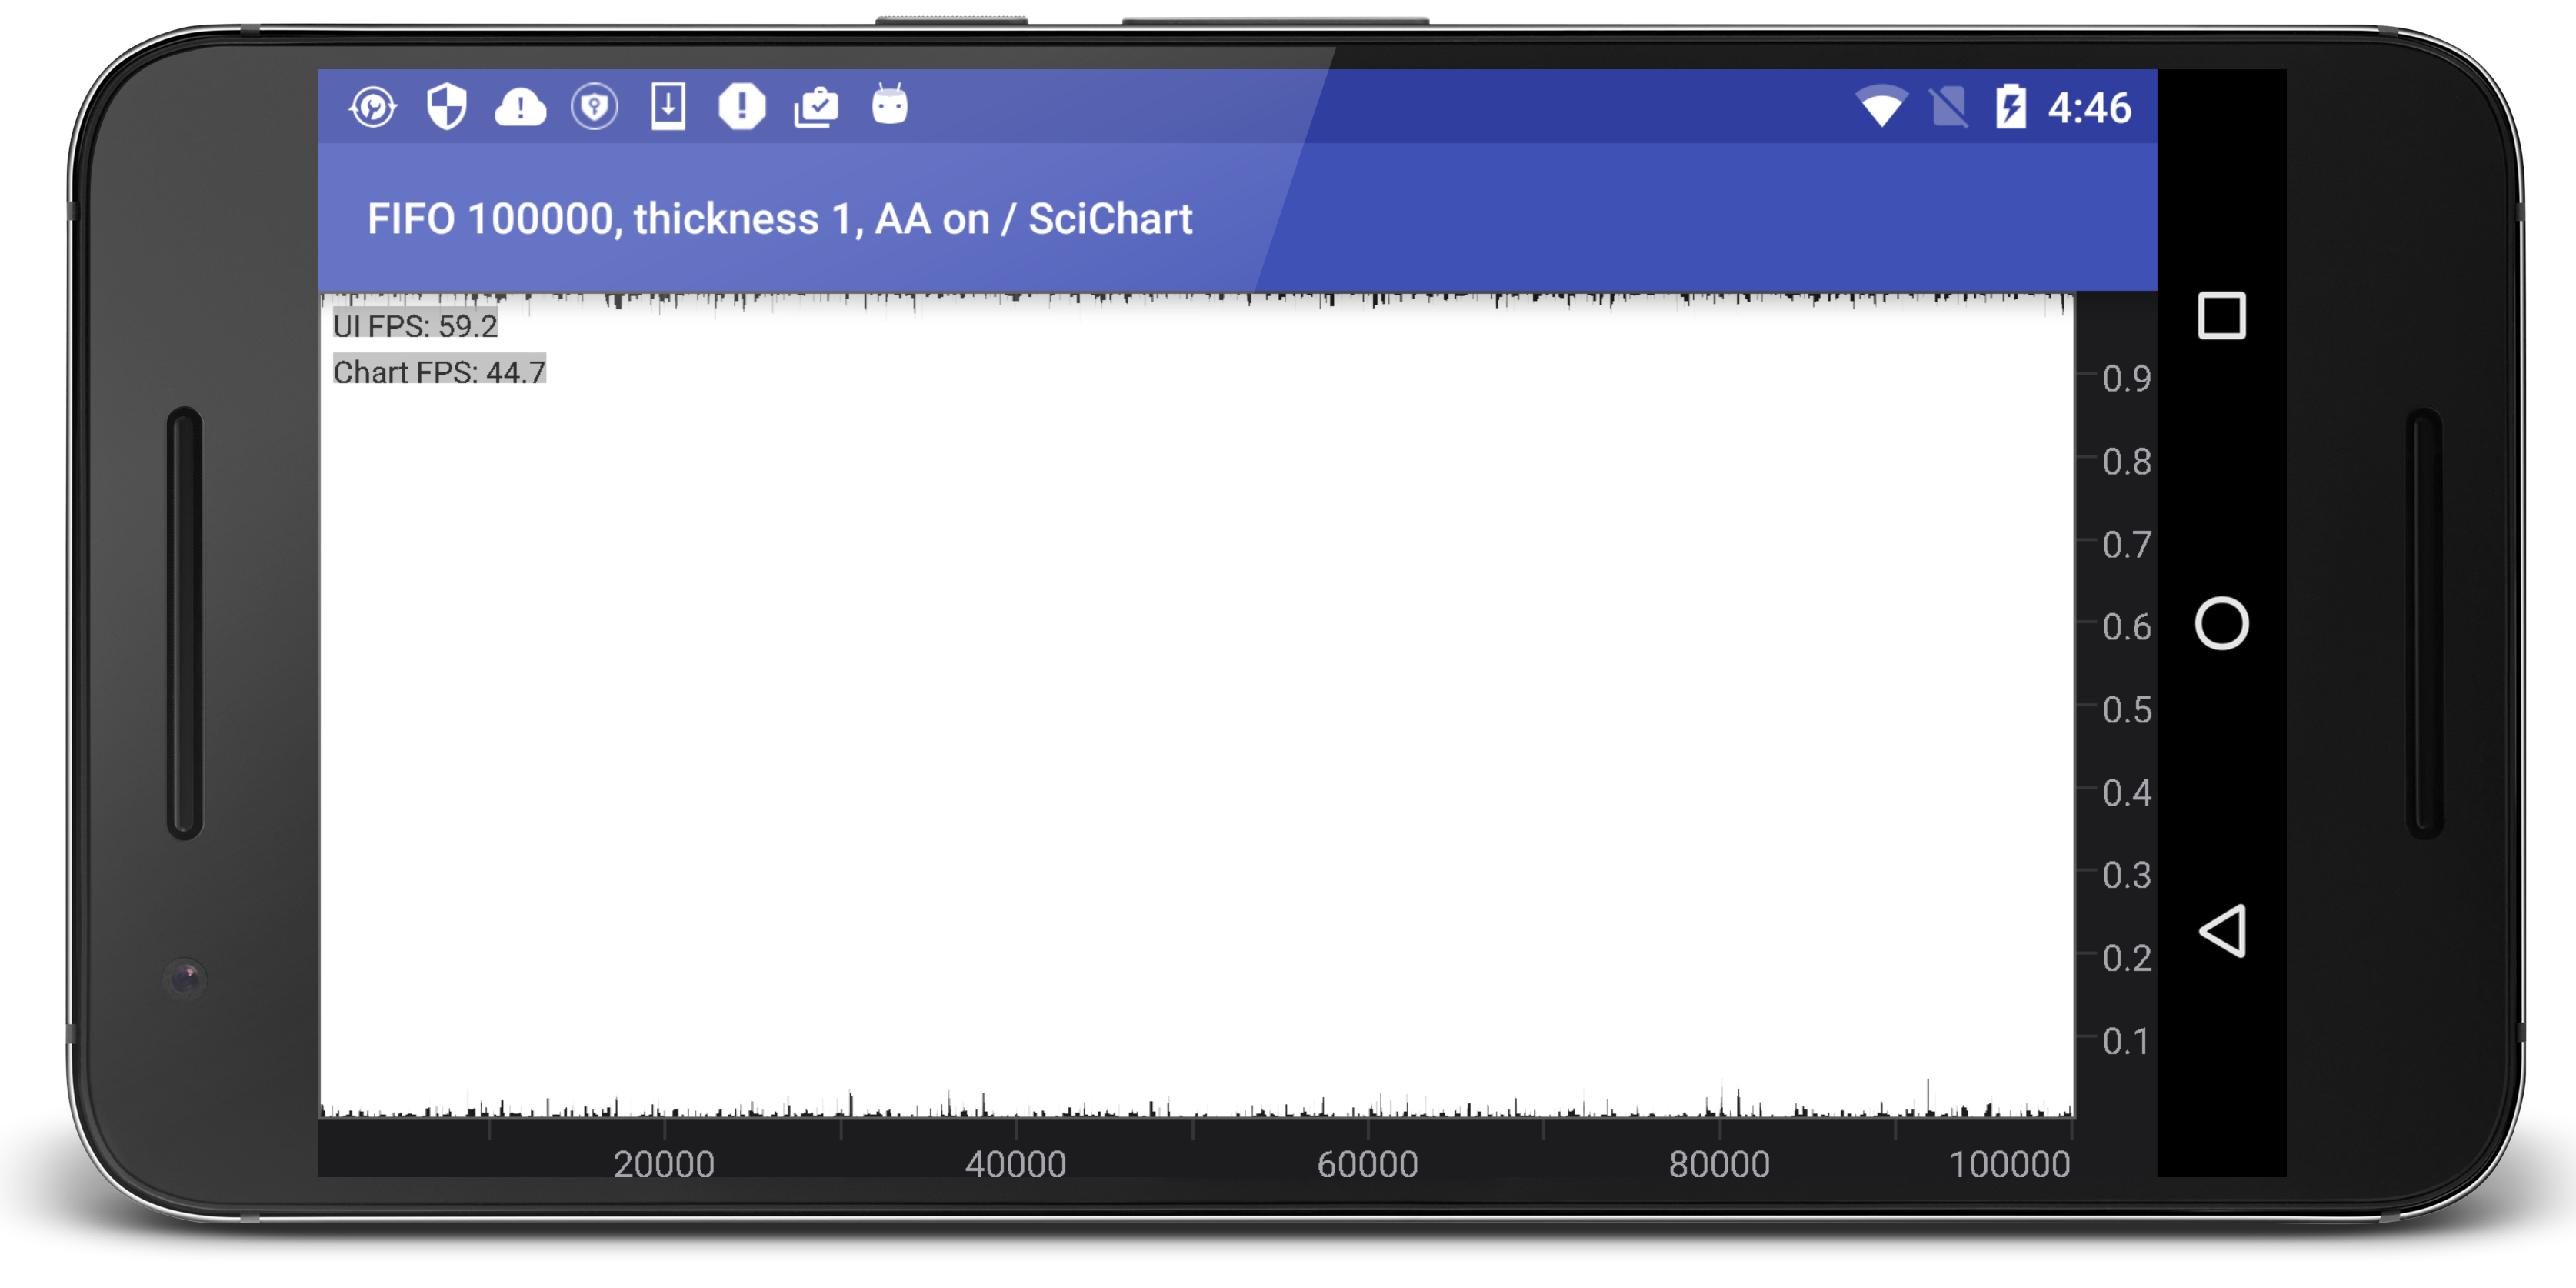
In this test N points are appended to a series, but scrolled from right to left (as new points arrive, old are discarded). SciChart for Android has a built-in mode to handle this called Fifo data series which is implemented as a circular buffer. Other chart components you simply remove a point for each point added.
The FPS is measured using the Choreographer class from the Android API.
Areas Stressed: Copying Circular Buffers (FIFO Series), Resampling and Drawing, scrolling.
Test 4: Append Data Test
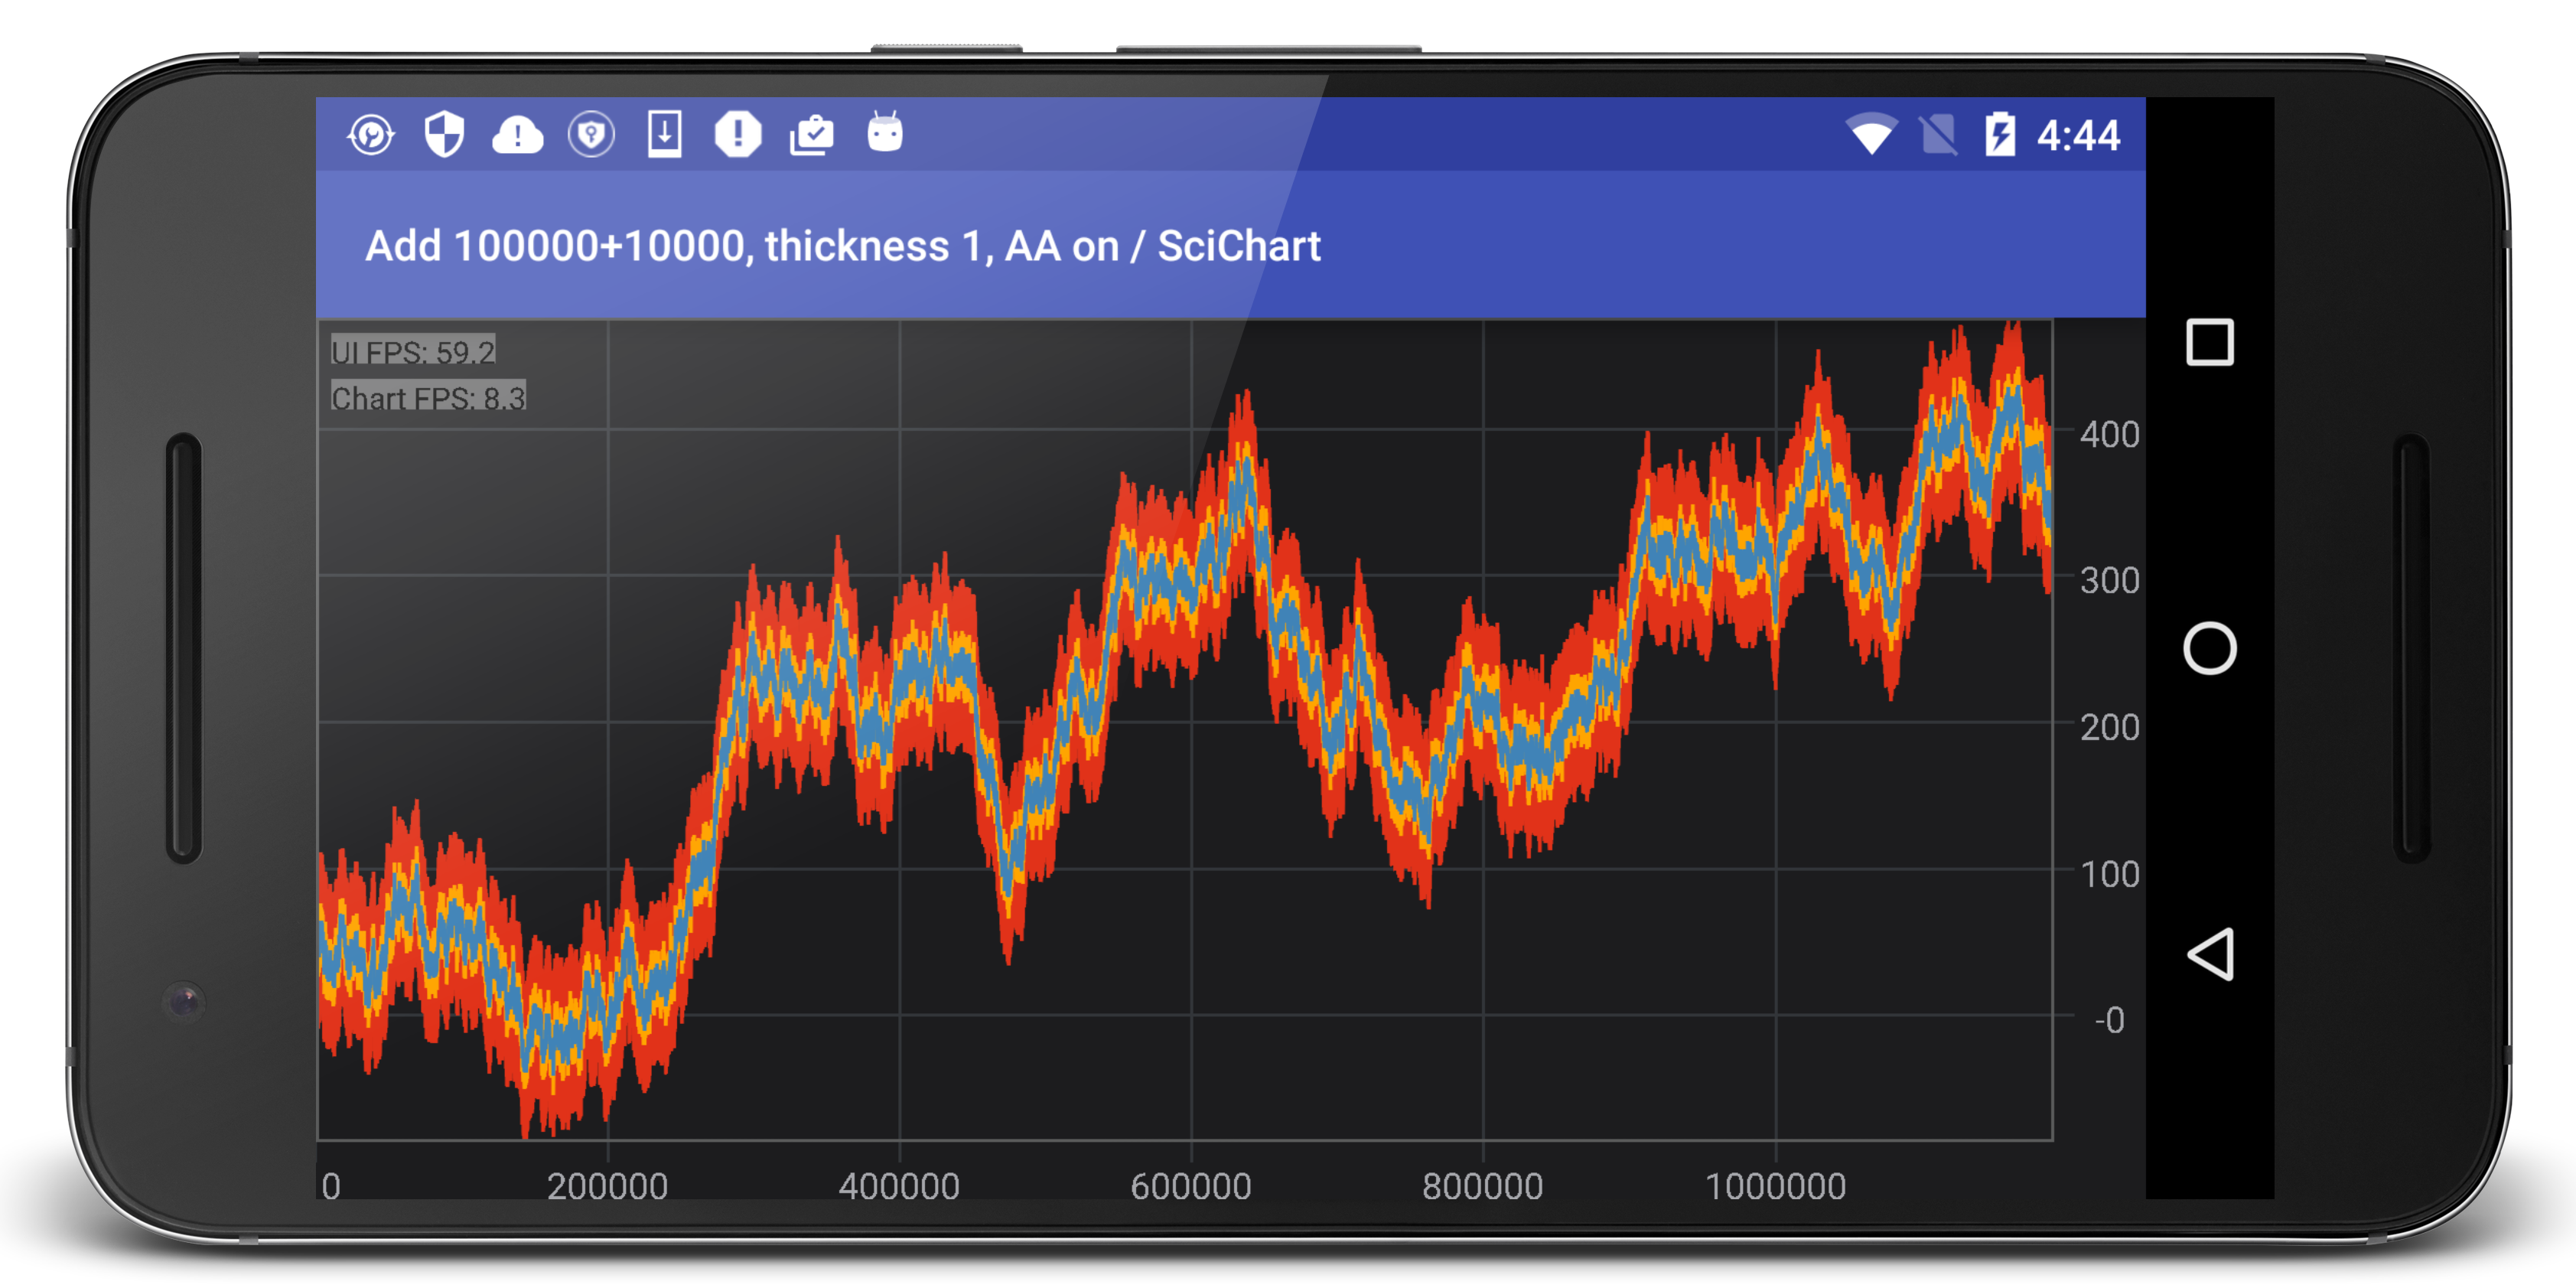 In this test N/3 points are appended to 3 series, then M points are appended between each draw of the chart. The data is random-walk but we vary noise to create more, or less noisy waves. This has the effect of stressing the actual drawing engine (when more noisy) vs. the update rate when less noisy.
The FPS is measured using the Choreographer class from the Android API.
Areas stressed: Appending Data, Resampling, Auto-Ranging and Drawing.
We’ve used SciChart Android v.1.0 for this purpose and compared it with the other Android Charts on a number of devices and emulators, among these Samsung Galaxy S6 Edge and Google Nexus 4.
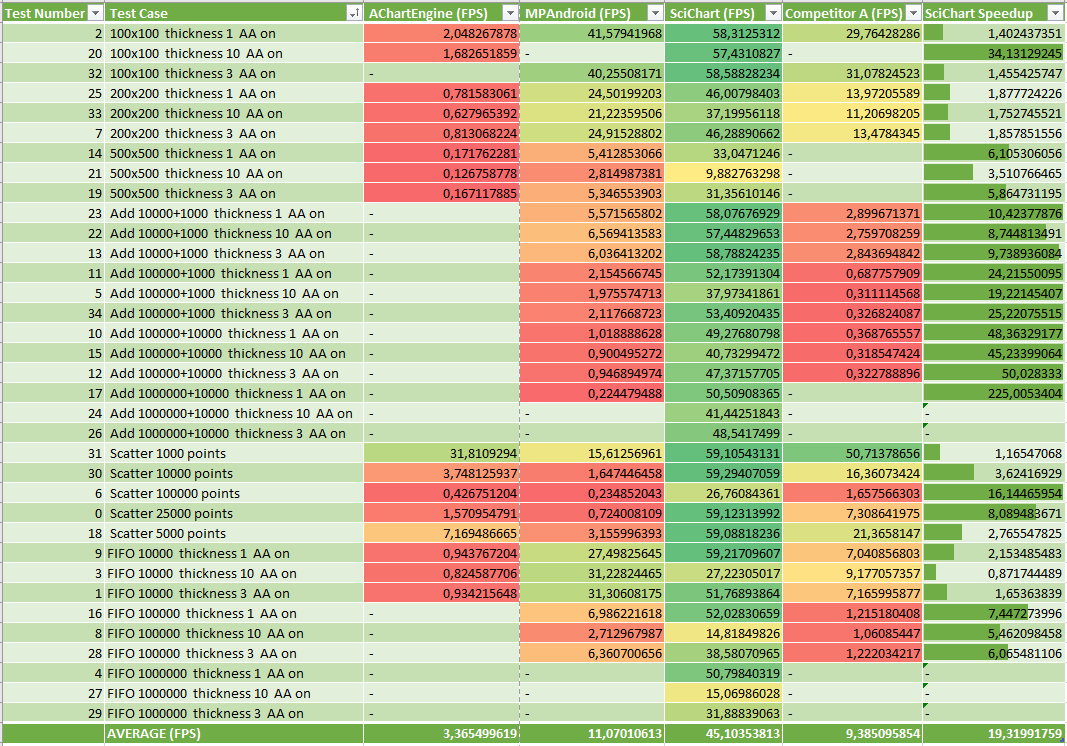
You can find the test results of our Android Chart Performance Comparison below. All test result numbers are in FPS (Frames per second – Higher is Better), meaning, the average number of redraws per second during the test, as measured by the Choreographer class from the Android API.
If a number is missed (blank), it means that a chart failed to run (crash) under a particular test-case.
The final column (SciChart Speedup) is the speed increase of SciChart Android vs. the other Android Charting Packages, e.g. 2.5 means 2.5x faster.
What Android charting performance comparison would be complete without the results in chart form?
You can find the test results plotted below:
SciChart Android is green, results are FPS (Refresh rate) so higher is better.

SciChart Android is green, results are FPS (Refresh rate) so higher is better.
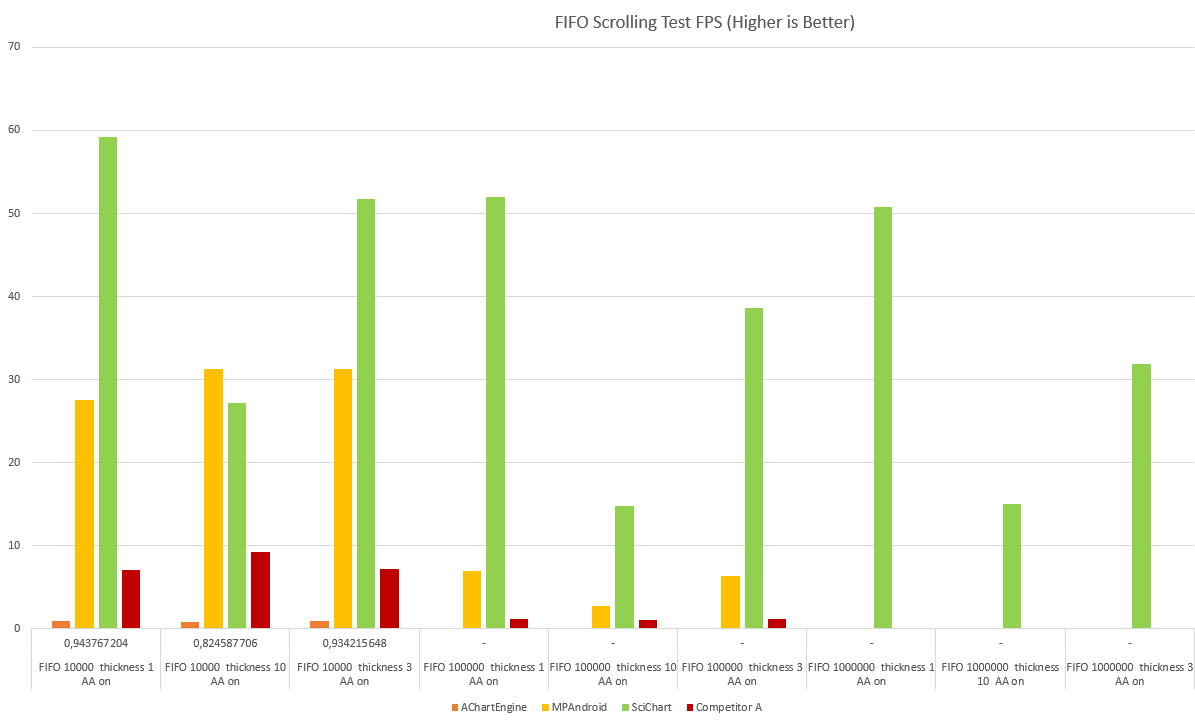
SciChart Android is green, results are FPS (Refresh rate) so higher is better.
SciChart Android is green, results are FPS (Refresh rate) so higher is better.
According to the Performance Comparison Results, Most Android Chart libraries are unsuitable for real-time updates on the chart. Most perform poorly once the amount of data reaches a few thousand points.
By contrast, the Android Charts by SciChart are extremely fast and show robust performance across a number of test cases including scatter charts, scrolling line series, appending line series and multiple series.
SciChart should be considered a very strong contender when evaluating real-time Android Charting Libraries for use in either Android Apps or Embedded systems which run the Android operating system.
A version of the test-application is available on request, if you would like to contact us. For legal reasons we can’t publish the names of CompetitorA but if you believe you are that competitor and wish to verify the results or submit a modification to optimize your code, please feel free.
Finally let us know what you think in the comments! If there’s anything else you want us to test, please ask!
Best regards,
Yuriy, SciChart Team
Related Posts
![]()
Queens Award for Innovation
Proud winners of the Queens Award for Innovation, 2019. Awarded on account of our innovative graphics engine which underpins the SciChart library and enables our world-beating charting performance
![]()
National Business Awards
Highly Commended for Lloyds National Business Awards, 2019. Awarded on account of our innovative graphics engine and impressive customer base
![]()
National Technology Awards
Awarded “Healthcare Tech of the Year” at the 2025 National Technology Awards – a top UK recognition for breakthrough innovation in technology.

Reviews
SciChart has received hundreds of verified, 3rd party reviews