SciChart for Avalonia XPF v2.0 Released!
SciChart is thrilled to announce the release of SciChart for Avalonia XPF 2.0 – a major update that brings all features and improvements […]
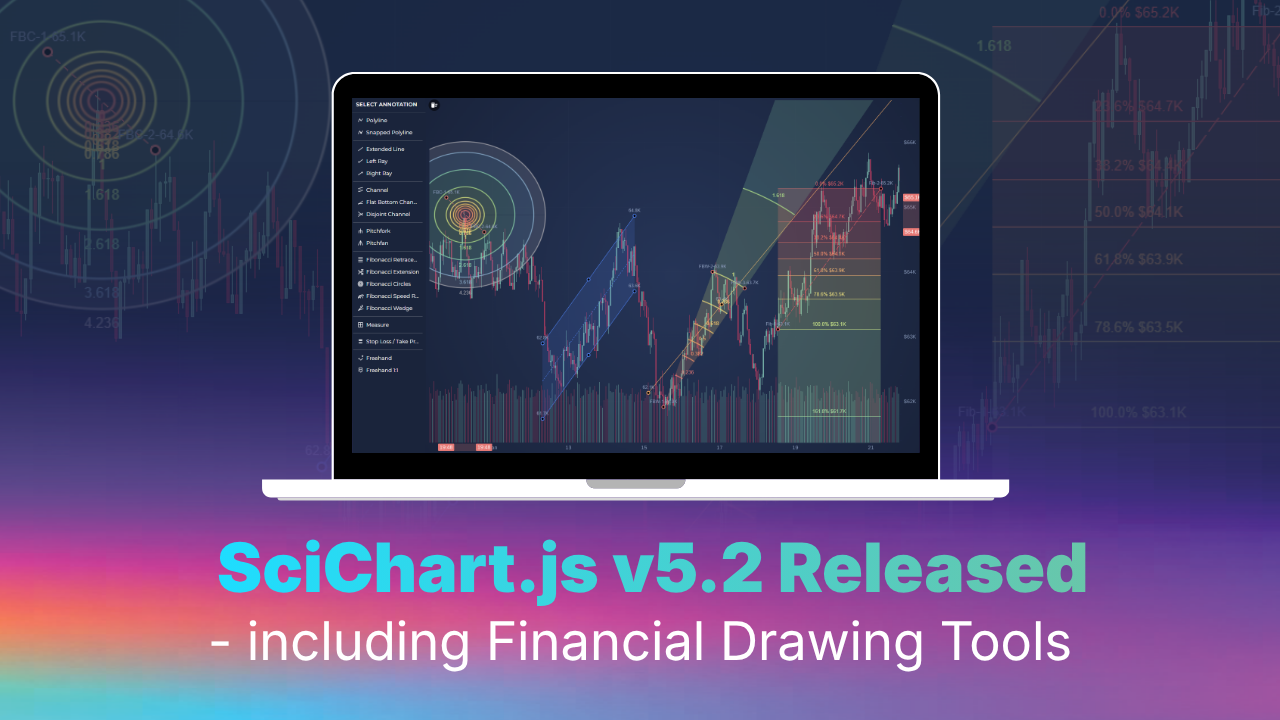
Continuing our rapid release cadence of new features every ~8 weeks, today we have an announcement to make.
SciChart.js v5.2 is released, plus we’ve released a brand new package
scichart-financial-toolsto level up your trading applications in JavaScript.Find out what’s new below!
We’ve released a new package specifically focussed on financial drawing tools in trading apps. You can get this via NPM. The license type is the same as the license for SciChart.js itself (all SciChart.js customers can use it)
npm install scichart scichart-financial-tools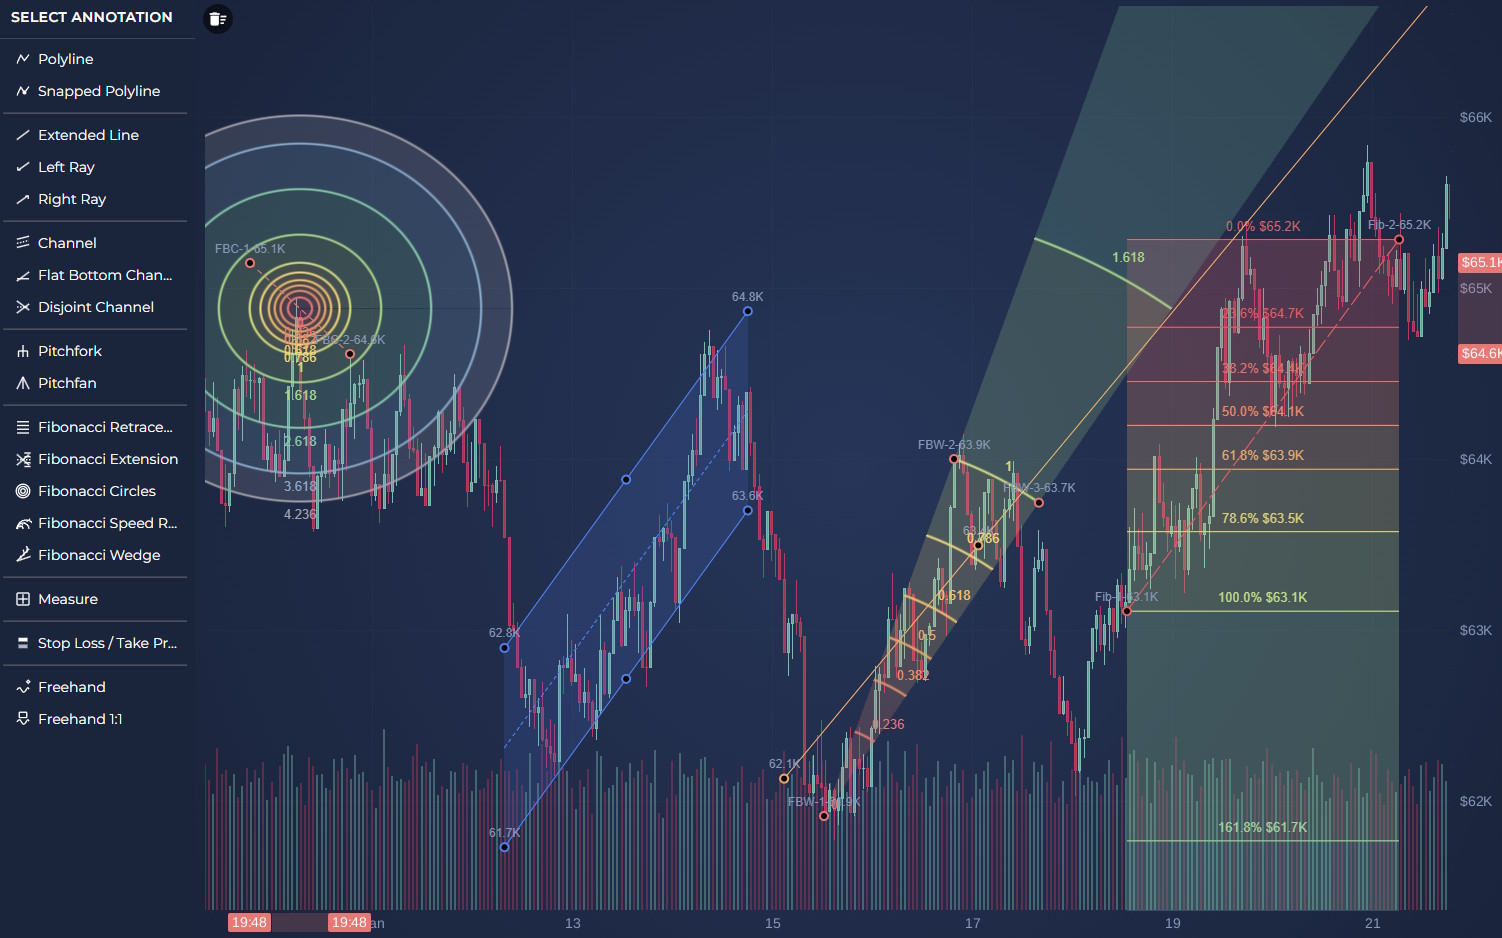
We have added various trading annotations:
ChannelAnnotation – renders a parallel channel which can be manipulated via mouse/touch (docs)DisjointChannelAnnotation – a variation of ChannelAnnotation (docs)FlatBottomChannelAnnotation – another variation with flat bottom (docs)ExtendedLineAnnotation – two point trend line (docs)FibonacciRetracementAnnotation – draws Fibonacci retracement levels from three editable points (docs).FibonacciCirclesAnnotation – draws Fibonacci support/resistance lines as a circleFibonacciSpeedResistanceArcsAnnotation– draws Fibonacci support/resistance lines as an arcFibonacciWedgeAnnotation– draws Fibonacci support/resistance lines as a wedgeMeasureAnnotation – measures the change between two points. It renders a rectangle, horizontal and vertical arrows and a dedicated measurement label (docs)PitchforkAnnotation – draws Andrews’ Pitchfork from three points: handle, shoulder A and shoulder B (docs)PitchfanAnnotation – uses the same pitchfork points and draws projected fan rays (docs)StopLossTakeProfitAnnotation – draws a stop-loss or take-profit zone from two points (docs)All of the financial drawing tools we’ve added can be programmatically placed via the API, or click-placed via a user.
To do this, we’ve added MultiPointAnnotationPlacementModifier which allows for placing different annotation types on the chart easily and FreehandDrawingModifier provides drawing functionality.
MultiPointAnnotationPlacementModifier — interactively place financial annotations on a chart (docs)FreehandDrawingModifier – Freehand drawing allows for drawing arbitrary shapes on charts (docs)SciChart already features a rich Data Filters API, allowing you to perform functions, filters or transforms on data. We’ve extended this to provide Heikin Ashi charts, Renko charts and Point & Figure charts in SciChart.js:
OhlcRenkoFilter – converts an OhlcDataSeries into Renko bricks represented as OHLC values. You will find documentation and demo here.
OhlcHeikinAshiFilter – converts an OhlcDataSeries into Heikin-Ashi candles. You will find documentation and demo here.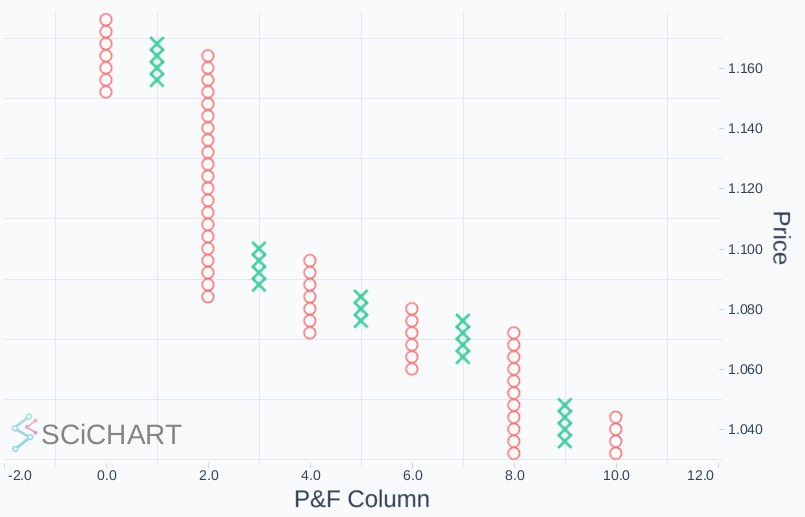
PointAndFigureFilter– converts OHLC close values into Point & Figure marks. You will find documentation and demo here.The SeriesValueModifier – a chart modifier that displays the latest value of a series as a YAxis label, has been added to the scichart-financial-tools package.
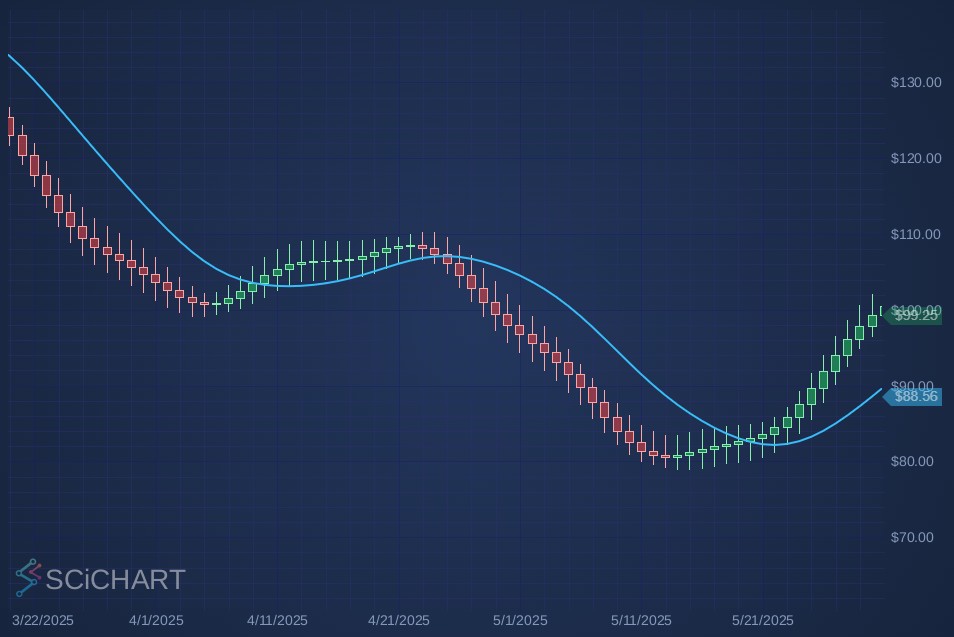
You can find a demonstration and documentation page here.
A powerful feature that has been ported from SciChart WPF to SciChart.js: CompositeAnnotation allows you to create an annotation group, for complex multi-figure annotations.
All of the financial drawing tool annotations: Fibonacci Retracements, Channels, Measure Annotations, have been built using CompositeAnnotation. Now you can create your own annotation groups by grouping two or more Annotations into a master canvas, with a multiple touch interaction points for manipulating them.
You will find documentation and demo here.
Smith Charts are complex radial charts used by RF and microwave engineers to visualise impedance mismatches. We’ve bult a powerful Smith Chart demo leveraging the extensive API endpoints of SciChart.js to show just how customisable SciChart is, plus, provide a fully featured demo for users on how to create a Smith Chart in their apps.
We will be publishing a companion blog post on Smith Chart shortly, explaining all the API overrides and extensions that are available.
In the meantime, you can find a demo here.
Force direction graphs, or node diagrams, allow you to visualise connections between nodes in a graph network. In this demo, we’ve added a React Force Directed Graph using SciChart.js, visualising US airport flight routes with a physics-based force simulation (demo).
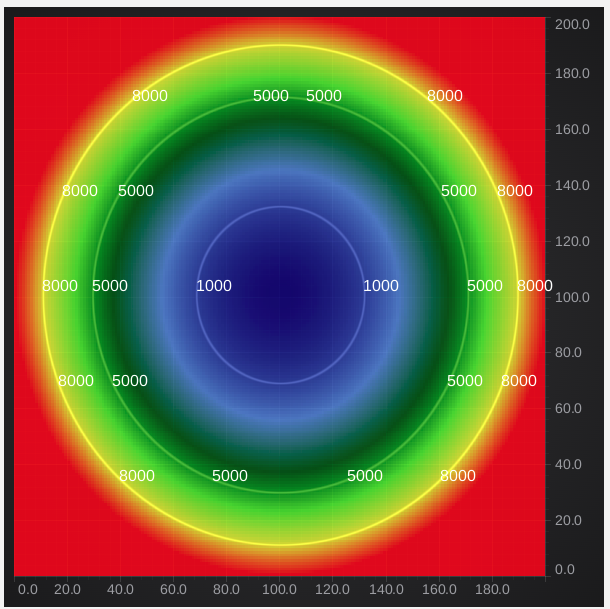
UniformContoursRenderableSeries now has a zLevels property which specify exactly at what levels to draw contour lines. On the image above we use 1000, 5000 and 8000 levels. Find documentation here.
XAxisDragModifier and YAxisDragModifier now have built-in support for pinch / touch behaviour on the axis.
We have implemented SeriesSelectionModifier for 3D charts (docs).
Above, you can see a modified version of our Waterfall Chart demo which replaces the top chart from a 2D chart to a 3D chart, with series selection and interactions being driven from the 3D chart. We will be publishing this update to our demo suite soon.
SciChart.js v5.2 introduces Simple Server Validation — a new Advanced Licensing option designed to make server-side license validation as painless as possible.
Unlike our existing Native Server (OEM) deployment, Simple Server Validation requires no native DLL, no FFI bridge, and no challenge/response handshake. Your server simply computes an HMAC-SHA256 token from a shared Server Secret and returns it to SciChart.js, which verifies it in WASM and caches the result. That means a single endpoint, a few lines of code, and you’re done.
Why you’ll like it
Simple Server Validation is ideal for OEM scenarios where you need to deploy SciChart.js to unknown or user-controlled domains, or for desktop apps built on Electron or Tauri.
Get started
The following chart types are available in SciChart.js demos but not yet covered in the chart types documentation. We have fixed this. Find updated documentation here.
Contact us to learn more
SciChart.js is a JavaScript Chart Library designed for complex, mission critical applications. Now with a FREE community edition. If you have a question or would like to learn more about our products & services, please contact us:
Related Posts
![]()
Queens Award for Innovation
Proud winners of the Queens Award for Innovation, 2019. Awarded on account of our innovative graphics engine which underpins the SciChart library and enables our world-beating charting performance
![]()
National Business Awards
Highly Commended for Lloyds National Business Awards, 2019. Awarded on account of our innovative graphics engine and impressive customer base
![]()
National Technology Awards
Awarded “Healthcare Tech of the Year” at the 2025 National Technology Awards – a top UK recognition for breakthrough innovation in technology.

Reviews
SciChart has received hundreds of verified, 3rd party reviews