So those of you who have been watching our releases page will notice that SciChart iOS & Android v1.2 were released several weeks ago, but SciChart WPF is no-where to be seen!
Well, the good news is that while we have been delayed in our SciChart WPF v4.2 release, we are now ready to publish it! The delay was due to an extra round of testing & bug fixing (over and above the norm for SciChart releases) in order to make this one of the most stable and perfected releases of SciChart ever.
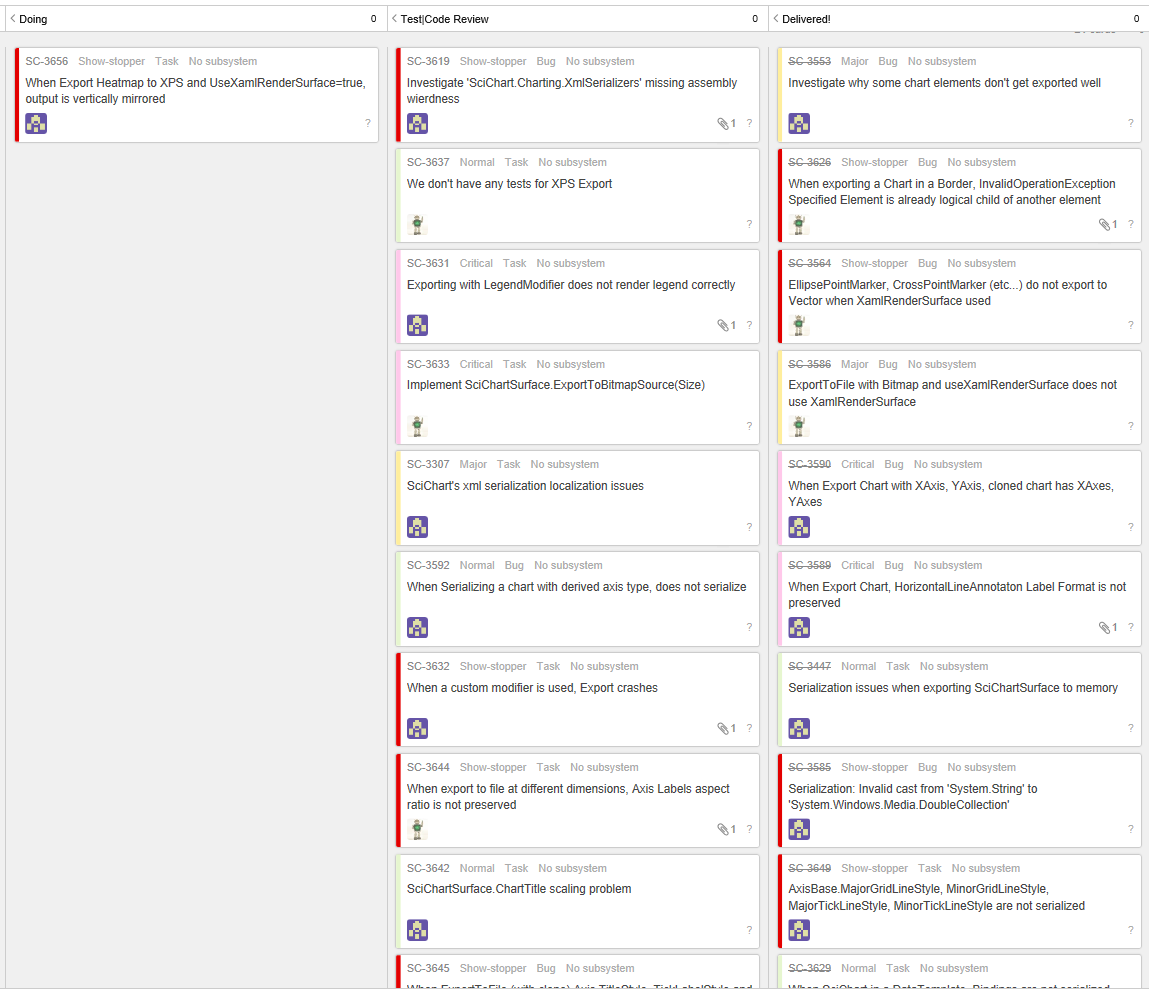
If you have a moment you can take a look at our Task Tracker board showing the status of the SciChart v4.2 Sprint. Our Issue Tracker was made public (read-only) a few weeks ago and you can now browse the status of sprints, tasks and bugs that you have reported.
Have a look below to see what’s coming soon.
XPS, Png Issues Fixed
In SciChart v4.2 we have literally fixed over 20 bugs related to Xps and Png export. The level of bugs in this feature was quite frankly, embarrassing, and we apologize to our users for putting them through this! In our defense, the image/XPS export feature is hugely complex, and requires us to make a perfect clone of the SciChartSurface in memory, and off-screen, for rendering to Png or XPS (Vector format) at a size other than the current chart.
Literally over 20 bugs reported and fixed related to XPS, Png export!
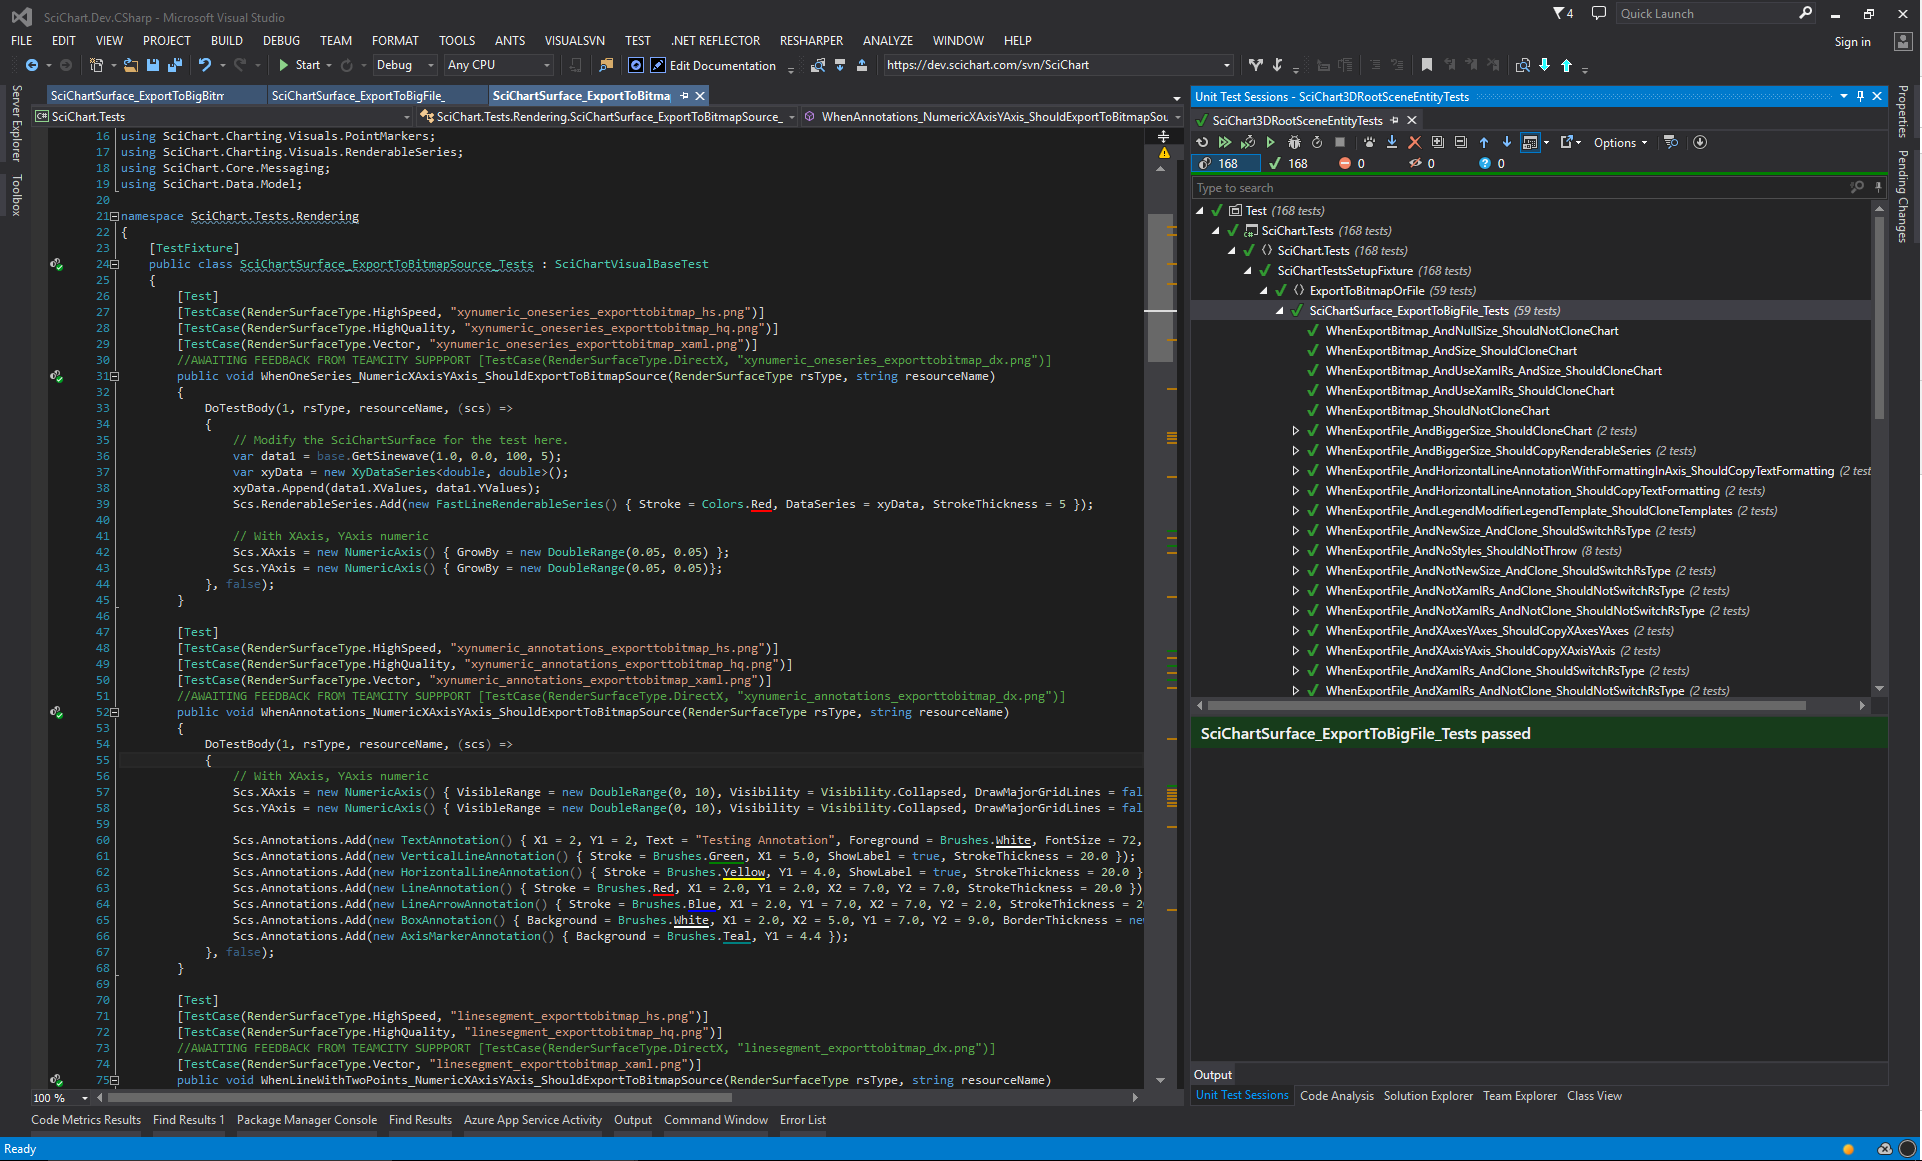
This is now done and the export works beautifully. We have also explored various ways of UIAutomation testing and come up with a Visual Test Framework that compares expected vs. actual Bitmap / XPS outputs in a variety of edge cases, plus, created over 150 test cases to cover this extremely popular feature.
SciChart’s Visual Test Framework allows UIAutomation and image comparison for the Export to XPS/Png Feature
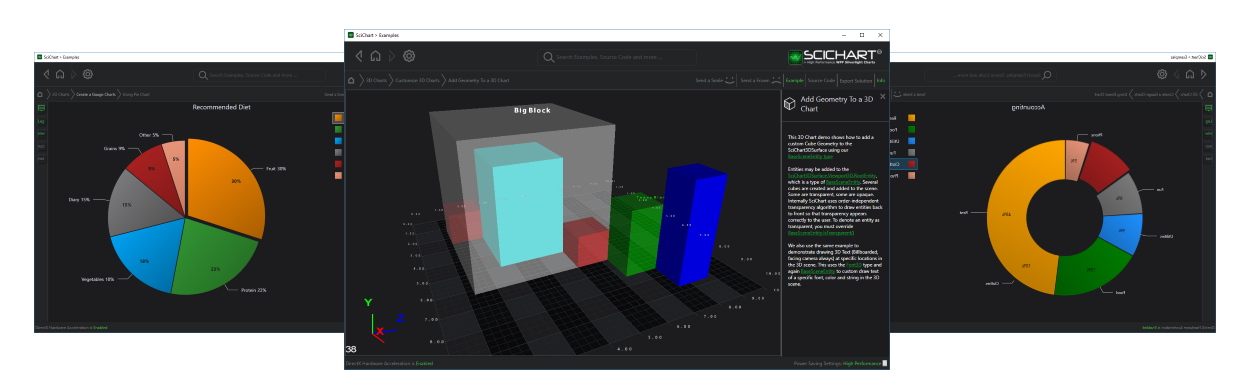
We have also added handling of order-independent transparency for some entities in the scene as well as the ability to create custom PointMarkers for 3D Charts.
We don’t know why this chart type is so popular, but you wanted it, so we built it! We hope you like it!
Negative Logarithmic Axis
It is possible to show data points with negative values on a logarithmic scale. Use our new NegativeLogarithmicAxis for that!
Some Minor Improvements
We’ve added a SciChartSurface.ZoomState property to allow you to know if the user is zooming or not. This is used in our Tutorials to allow real-time zooming and panning alongside realtime scrolling charts.
Oh and we’ve created 9 new tutorials to help new users get started with SciChart WPF.
We’ve added support of PaletteProvider to FastBoxPlotSeries.
We’ve added the properties Viewport3D.ForceStallUntilGPUIdle and Direct3D10RenderSurface.EnableForceWaitForGPU which can be used to stall DirectX rendering until GPU is idle (resolves flicker on some older hardware).
Finally, SciChartLegend.Background is bound to LegendModifier.Background by default now.
A Bazillion Bug Fixes
There are also many many bug fixes in this release, and also a lot of UIAutomation tests and unit tests have been added to reduce the chance of them creeping back in in the future. The list of bug fixes in SciChart v4.2 can be found below.
Fixes for SciChart 2D
FileNotFoundException during startup (licensing) – added a check whether file exists before loading AltStorageStrategy.
Fixed hanging tooltips (RolloverModifier, TooltipModifier) where there were gaps in data (dataPoint.Y==NaN).
Fixed regression in behavior with the ShowTooltipOn mode for RolloverModifier, VerticalSlicesModifier.
Fixed a runtime exception in VerticalSliceModifier when X1 was set to Int in XAML.
Fixed a runtime exception in VerticalSliceModifier on clearing VerticalLines.
Fixed crash in SeriesValueModifier when trying to bind its VerticalLineAnnotationCollection.
Fixed binding errors on LegendModifier when a Legend showed ScrollBars.
Fixed the issue with DataPointSelectionModifier when it allowed to select points on invisible series.
Fixed DataPointSelectionModifier to allow selecting many points for FastBubbleRenderableSeries, StackedColumnRenderableSeries.
Fixed DataPointSelectionModifier for vertical charts.
Fixed crash in IAxis: Scroll(), Zoom(), ZoomBy(), ScrollByDataPoints() methods failed if VisibleRange==Null.
Fixed LegendModifier doesn’t reorder items when series order changes.
Fixed the issue when CategoryDateTimeAxis gets scrolled by mouse clicks.
Fixed CategoryDateTimeAxis when it fails do draw gridlines if all series are hidden.
Fixed panning with CategoryNumericAxis.
Fixed Heatmap opacity when drawing using XamlRenderContext.
Fixed different Heatmap rendering with XamlRenderer when zoomed in.
Fixed text drawing on Heatmap with XamlRenderContext.
Fixed Heatmap colors with XamlRenderContext.
Fixed XAMLRenderer issue when it rendered gradients differently than other renderers.
Fixed FastBubbleRenderableSeries didn’t render with XAMLRenderContext.
Fixed disappearing lines in BoxPlotSeries with XAMLRenderer.
Fixed an issue when the Stroke of underlying series was visible through an opaque upper series with DxRenderContext.
Fixed a crash for FastBandSeries when zooming out to max with DxRenderContext.
Fixed Z-Order of series with DxRenderContext.
Fixed a NullReferenceException in SciStockChart which occured in DataTemplateSelector.OnDataTemplateChanged().
Fixed HitTest not working on vertical Impulse Chart.
Fixed HitTest for Polar Charts.
Fixed incorrect Rollover axis label on Polar Charts.
Fixed a bug in TernaryPolygonSeries where it drew text when a series was hidden.
Fixed the issue when tooltips showed empty error values for ErrorBarSeries.
Fixed the issue when tooltips showed incorrect Z Value on Ternary Charts.
Fixed an exception in VerticalLineAnnotation when changing VerticalAlignment.
Fixed the issue with CompositeAnnotations when they didn’t react on interaction with children annotations.
Fixed the bug when a CompositeAnnotation couldn’t be hidden.
Fixed an intermittent crash with annotations when an exception was thrown during animation of ResizingGrips on Selection.
Fixed TextAnnotation incorrect positioning when YAxes are stacked vertically.
Fixed a positioning issue with VerticalLineAnnotation and AnnotationLabel margin issues.
Fixed a regression with the default PointMarker.DataContext.
Fixed a bug when SciChart didn’t release event subscribtions on Dispose().
Fixed ShiftedAxesBehavior which placed axes incorrectly when the size of a Window changed.
Fixed an intermittent internal InvalidOperationException in TransformToVisual().
Fixes for SciChart Export to File / XPS
Changed the error message for exceptions that occur during exporting a chart. Now it reports the property which caused a crash.
Fixed the ExportToFile() method which did not use XamlRenderSurface when it had to.
Fixed serialization (exporting) of CompositeAnnotations.
Fixed serialization (exporting) of CustomAnnotations.
Fixed serialization (exporting) of other annotation types.
Fixed serialization (exporting) of AnnotationCreationModifier.
Fixed serialization (exporting) of the default themes.
Fixed serialization (exporting) of custom axis types.
Fixed serialization (exporting) of LegendModifier when a Legend was configured via Templates.
Fixed serialization (exporting) of SciChartSurface properties when inside a DataTemplate.
Fixed serialization (exporting) of RenderableSeries with the PointMarker, PointMarkerTemplate properties set.
Fixed an intermittent InvalidOperationException during exporting to XPS (“Specified Element is already logical child of another element”).
Fixed an export issue with AxisId when ScichartSurface was inside a DataTemplate.
Fixed serialization the ColorMap property on Heatmap.
Fixed serialization of the TextFormatting, CursorTextFormatting, AxisTitle properties of axes.
Fixed an exception when trying to serialize TimeSpan.
Fixed serialization of the VerticalScrollBarVisibility property of the LegendModifier.
Fixed serialization of gradient brushes.
Fixed deserialization of StrokeDashArray.
Added text scaling for exporting a chart with larger size for: – CompositeAnnotations – AxisTitles – ChartTitle – TextAnnotaions – HorizontalLineAnnotations – VerticalLineAnnotations – CustomAnnotations – AxisMarkerAnnotations – Legends
Fixes for SciChart 3D:
Fixed a crash caused by creating a type before SCRTDllLoader.InitNativeLibs was called “DllNotFoundException” for SciChart3DNative.dll
Fixed the issue when the TooltipModifier3D always showed a tooltip for the first SurfaceMesh only.
Fixed 3D hit-test (tooltip) failure when there were more than one Scatter or Bubble Series on a chart.
Changed default TooltipModifier3D tooltips – they show SeriesName now.
Fixed incorrect screen coordinates computations when camera is not right in front of surface.
Fixed the issue when a 3D chart did not obey Major/Minor GridLine Color from SC3D Themes.
Fixed a crash with the SelectionModifier3D.
Fixed the issue when RenderableSeries3D would appear despite that DataSeries was set to Null.
Fixed incorrect property definition in the BasePointMarker3D (SelectedFill)
Fixed PointMarkers3D transparency issue when they ignored alpha channel of a color coming from a metadata.
Added the default color for a selected PointMarker3D.
Fixed the issue when custom PointMarkers3D weren’t disposed.
Fixed Z fighting issue with columns using back face culling.
Fixed columns shader, which would invert models when the heights were negative.
Fixed incorrect x,z columns sizes in GridData. It caused exception in UniformGridDataSeries3D.CopyFrom(TY[][] innerArray)
Fixes Entityid not incremented to next available value when scene entities attached meaning it was not possible to have more than one Scatter Series 3D with a tooltip.
Improvements to the Examples Application
Added a showcase for a new NegativeLogarithmicAxis to the “Logarithmic Axis” example.
Created the example called “Add Geometry to a 3D Chart” to demonstrate custom cube geometry and custom text in a 3D chart.
Added the MouseWheelModifier as a default modifier to the SciChartInteractionToolbar.
Added possibility to edit segments in the “Using Pie Chart”, “Using Donut Chart” examples.
Added a possibility to zoom to extents on double-click in the “Annotations Are Easy” example.
Changed the “SciChart Trader Demo” example to fix Rollover, Cursor bindings from the toolbar.
Changed the “Series Binding with MVVM” example to use ObservableCollection.
Cosmetic changes to the “Interaction With Annotations” example.
Fixed an issue when a FibonacciExtensionAnnotations, FibonacciRetracementAnnotations couldn’t be interacted with when a mouse was over the internal TrendLine.
Fixed the FlipModifier in the SciChartInteractionToolbar.
Fixed toolbar buttons in the “Chart Legends API” example.
Fixed the FPS counter in the “50-Channel EEG” example. It failed to show FPS after chart data was reset.
Fixed parsing of YAxis.VisibleRange from text in the “Modify Axis Properties” example.
Fixed the ZoomExtentsY option in the “Pan X or Y Direction” example.
Fixed mixed up settings in the toolbar in the “Modify Camera3D Properties” example.
Fixed the toolbar in the “RealTime Polar Charts” example.
Fixed the background chart of the SciChartScrollbar in the “Multi-Pane Stock Charts” example.
Fixed the “Stacked Bar Chart” example – sometimes it appeared upside down because of bindings.
Fixed empty error values in tooltips in the “ErrorBar Series TernaryChart” example.
Fixed the “Series Custom Tooltips 3D Chart” example crash on startup.
Fixed the “Dashboard Charts” examples. Charts did not zoom to fit after switching between views.
Fixed some examples which failed to compile after export.
Fixed examples export crash when SciChart is installed on “C:/”.
Added a possibility to cancel export when choosing directory.
Added a check whether the chosen directory, file is available.
Where to get it?!
You can get all the SciChart Releases from the www.scichart.com/downloads page. If you haven’t created an account with SciChart.com yet, please do. You will need to in order to access the downloads.
If you are a customer of SciChart you can also access our binaries via our NuGet feed as well as Github (for source-code customers).
CEO / Founder of SciChart.
Masters (MEng) and PhD in Electronics & Signal Processing.Follow me on LinkedIn for more SciChart content, or twitter at @drandrewbt.
Queens Award for Innovation Proud winners of the Queens Award for Innovation, 2019. Awarded on account of our innovative graphics engine which underpins the SciChart library and enables our world-beating charting performance
National Business Awards Highly Commended for Lloyds National Business Awards, 2019. Awarded on account of our innovative graphics engine and impressive customer base
National Technology Awards Awarded “Healthcare Tech of the Year” at the 2025 National Technology Awards – a top UK recognition for breakthrough innovation in technology.
Reviews SciChart has received hundreds of verified, 3rd party reviews
Try SciChart Today
Start a trial and discover why we are the choice of demanding developers worldwide