Medical Data Visualization Solutions That You Can Rely On
Build mission-critical medical dashboards with reliable, high-performance medical data visualization solutions from SciChart.
SciChart’s charting software is trusted by 90% of top medical device companies globally and is used in FDA‑cleared and HIPAA‑compliant solutions across web, desktop, and mobile.
Whether you’re looking to pioneer a life-changing medical device, push the boundaries of research or enhance your healthcare service, with SciChart, you can.
- Smooth, real-time ECG, telemetry, and sensor data even on legacy or embedded hardware.
- Predictable behavior that fits into your validation and verification workflows.
- Built for regulated environments and proven inside FDA‑cleared and HIPAA‑compliant products.
- With one visualization stack you can reuse concepts across WPF/.NET, WebAssembly/JS, and iOS/Android.
Trusted By Industry Leaders


What Unique Problems Have We Solved?
As one of the best medical charting solutions, SciChart offers reliability for diagnosing and monitoring conditions or pushing the boundaries of MedTech and healthcare solutions.
Build FDA‑Cleared & HIPAA‑Compliant Platforms
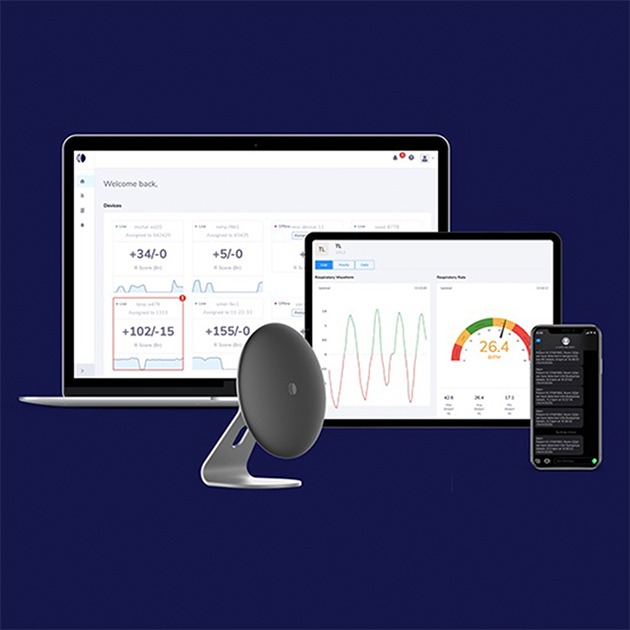
The world’s first FDA-cleared contactless monitoring system, powered by SciChart, provides a HIPAA-compliant platform.
Circadia Health leverages SciChart on mobile and web, delivering a unified medical data visualization solution. When you’re handling patient data and building your compliance profile, you can’t take risks. You need a charting and data visualization solution you can trust with your patients’ health.
With our cross-platform API, you can deliver certified products the first time, whatever the hardware and software language.

Deliver Cutting Edge Research, Powered By Unbeatable Medical Data Visualization
The NeuroRestore treatment center in Switzerland used SciChart to help restore mobility in paralyzed patients – a world first.
Using our accelerated charting solutions, they visualized, interpreted, and responded to live synaptic data bridging spinal injuries.
This cutting-edge technology was made possible with SciChart and is now contributing to new Parkinson’s disease and stroke treatments.
Only SciChart delivered the performance and comprehensive functionality needed for their truly innovative work.

Identify At-Risk Patients Sooner
Capsule Technologies, a Philips firm, uses SciChart in their Vitals Plus cardiac telemetry and patient monitoring application to simplify vitals visualization.
Our unified API and cross-platform expertise ensure that the development and maintenance remain consistent across the software interface and unlocks the power of medical device data in a unified environment.
Only SciChart delivers the native performance and flexibility needed for a truly cross-platform medical data suite.
Guarantee Data Integrity
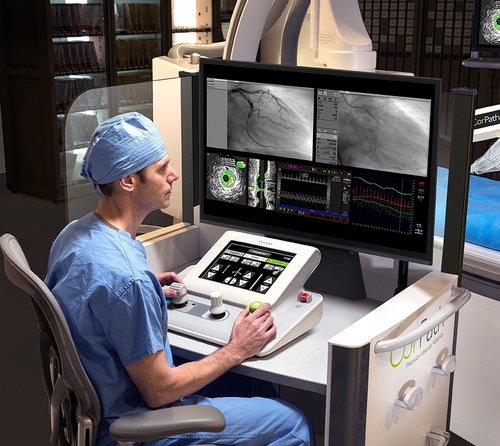
Siemens Healthineers needed to replace their medical data visualization in their CorpathGRX system, a vascular robotic system used to guide catheters during myocardial infarction treatment.
Their existing solution was cumbersome, but with SciChart, they were able to display all relevant charts with just a couple of clicks.
SciChart was able to guarantee data integrity. Our software is tried and tested across MedTech and healthcare. Don’t take risks with your project when SciChart is proven to deliver.

What Makes SciChart One of the Best Graphing Tools for Medical Research Visualization?
SciChart didn’t become one of the leading clinical data visualization tools by accident. We designed it that way.
With SciChart, you can:
- Accelerate product development and time-to-diagnosis.
- Handle real-time data with high-fidelity 64-bit precision.
- Create unique customizations within your software suite.
- Avoid the need to update your hardware so frequently.
- Keep your patient data secure and accurate.
MedTech Case Studies
Proven in pioneering MedTech technology and healthcare systems, where reliability and real-time rendering are critical.
Honestly one of those libraries that just gets out of your way. Performance with large datasets is genuinely impressive — smooth and responsive without any tricks or workarounds. The API clicked quickly and the docs are actually good, which is rarer than it should be. Every chart type I've needed has been there, and the visual quality is great. Hard to imagine reaching for anything else at this point.
See the Difference with SciChart
Deliver a professional software experience and reliable medical data visualization, even on outdated hardware. Try SciChart today and see the difference.
Examples & Demos
Discover examples and demos used for MedTech projects around the world.
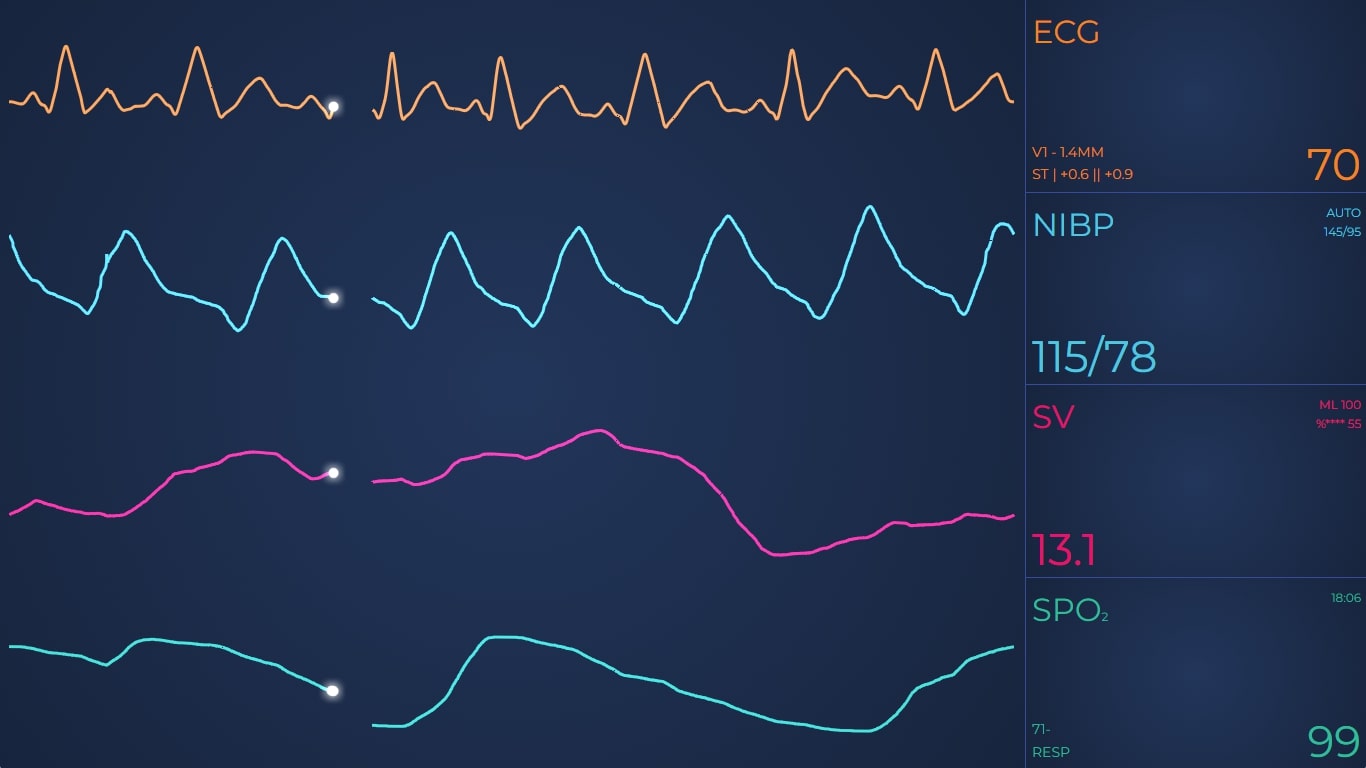
Build ECG / EKG Applications
SciChart’s ability to link multiple charts (or have many traces on one chart control) and its smooth real-time updates make it ideal for ECG and EKG applications and Cardiac Telemetry applications. Our charts are used in healthcare applications across platforms as well as medical testing devices.

Build Oscilloscopes and Spectrum Analyzers
With fast, real-time charts, SciChart allows you to build oscilloscopes and spectrum analyzers.
Our charts can handle over 100 million points in real-time and process demanding updates (sub-1 millisecond) all while delivering an efficient CPU and memory footprint

Medical Heatmaps for Ultrasound Scans
SciChart supports Ultrasound Heatmaps in SciChart.js, by taking a 2D array of data points as hex values between 00 and FF, and displaying them in a polar heatmap.
What Features to Expect With SciChart?
Take a look at the chart performance you can achieve with SciChart and how our extensive charting features contribute to fully customizable medical data visualization.

Chart Performance
- Zero memory growth
- GPU-accelerated
- WebAssembly-powered
- Sub-millisecond interactivity even on larger datasets
- 2.3MB bundle size
- Float64 array and FIFO mode for enhanced data efficiency
- Cross-platform performance across JavaScript, WPF/.NET, and iOS/Android
- Continuous streaming
- Deterministic rendering
- Visualize 100 M+ points per dataset
- Continuous 24/7 operation
- Sustain 200k points per second
- Refresh 64+ charts in under one second
- Embeddable within MES, YMS, and ATE systems
- Direct integration into React, Angular, and Vue
Extensive Charting Features
- 2D & 3D plotting
- Animation of data
- Annotations on chart
- Zoom & pan
- Tooltips
- Touch interaction
- Link multiple charts
- Legend customization
- Logarithmic axis
- Multiple X & Y-Axis
- Per-point coloring
- Programmatically change viewport
- Theme or template customization
5-Star Support for Developers
See the level of support developers get when building real-time chart solutions for medical device monitoring.
 Responsive 5-Star Technical Support
With our 5-star technical support subscription, we aim to answer all support tickets within one business day* and often even faster.
 Get Answers Fast with our AI Assistant
Ask our AI Assistant anything about SciChart and it will answer your questions fast!
 Knowlegable Support Forums
With nearly 4000 answered support requests on our public support forum, you’ll never be left without an answer.
 Extensive Documentation
1000s of pages of support documentation across all platforms for expert guidance on getting the most from SciChart.
 Tutorials & Videos
Our regularly updated YouTube channel will help you understand what’s possible and answers the most commonly asked questions.
 Hundreds of Example Charts
Over 350 chart examples will get you what you need to get out of the blocks more quickly.
Testimonials & Reviews
Award Winning Software – Continually Rated Best with Hundreds of 5-Star Reviews
With a rating of 4.8, SciChart is one of the highest rated chart libraries in the world*, used by over 10,000 expert developers worldwide.
Read All Reviews