Unlocking the Potential of Aerospace & Defense
Robust Data Visualization Solutions for the Modern World.
Used by over half of Fortune 500 companies in the Aerospace & Defense sector, trusted by Government agencies globally, and deployed across our NATO allies. SciChart is unparalleled in data integrity and flexibility, delivering visualization solutions across orbital tracking, telemetry, next-generation space exploration, ELINT/SIGINT, aerodynamics, and complex traceability data applications.
- Plot billions of datapoints
Real-time or Big Data performance, powerful enough to visualize data in the most demanding applications. - Develop cross-platform
Get the same levels of power and performance across JavaScript, iOS/Android, Windows and Linux. - Purpose-built for performance and scalability
Engineered for speed and flexibility – no third-party dependencies or vendor lock-in. Power real-time visualization and telemetry anywhere. - 5 Star Developer-led support
Expert help when you need it – through our AI Chat Assistant, documentation, and direct engineer support.
Trusted By Industry Leaders


SciChart Provides Mission-Critical Data Analysis Solutions
From powering next-generation satellites to visualizing mission-critical telemetry, these examples showcase our proven ability to deliver robust, high-performance solutions that meet the rigorous demands of the sector.
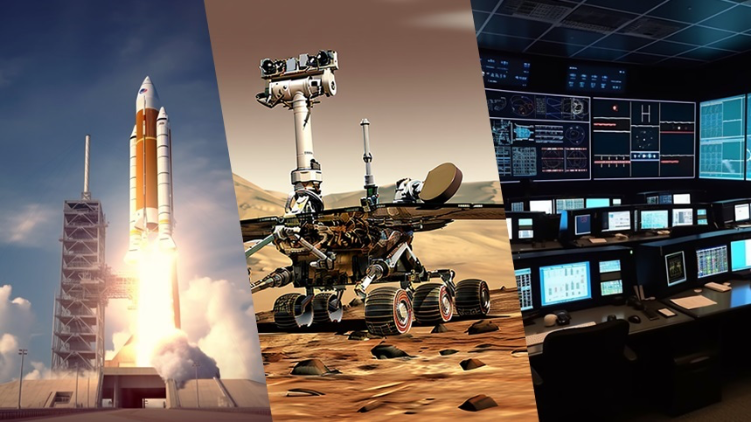
Developed for Moon to Mars Missions
The Key to NASA Streams & Next-Gen Space Exploration
Leveraged by the Space Mission Analysis Branch and created by the Jet Propulsion Laboratory, NASA’s Streams application enables interactive, hands-on analysis of billions of data points in real time, pushing the boundaries of spacecraft analytics. SciChart’s proprietary rendering engine and expansive API were selected to help in the upcoming Moon to Mars missions.
- Billions of data points from spacecraft in real time
- Thermal rover telemetry data analysed from the other side of the solar system
- Interactive analysis across missions reducing cost and risk
- Global collaboration with experts anywhere in the world

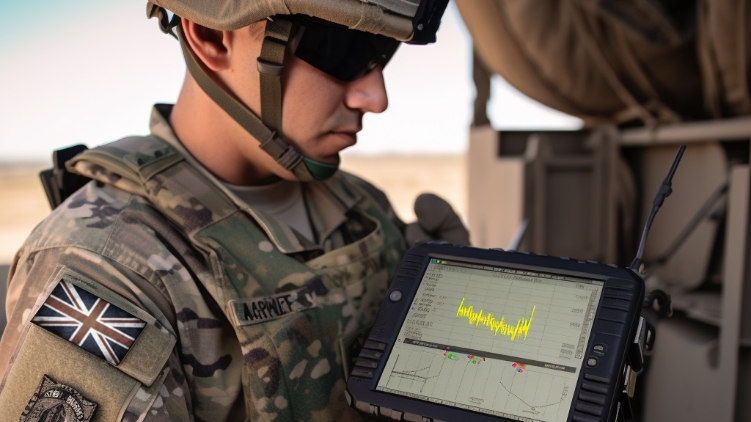
Enhanced Military Capabilities
Defense Telemetry: Comprehensive Solutions for Military Applications
SciChart powers telemetry, situational awareness, and defense systems for our NATO allies. Our robust solution replaces legacy systems, mitigating risks from ageing infrastructure, spectrum reallocation, and capability shortfalls.
Serving militaries and contractors alike, our high-performance visualization solution enhances fleet integrity through dashboarding solutions for vibrational analysis, rotor imbalance, maintenance data, flight safety assessments, test articles, spectrum analysis as well as both theatre and strategic telemetry. Let us help you win your next contract or deliver the solution needed for your nation’s security.
German Signals Intelligence Program
Control the Spectrum, Control the Threat
Employed by Governments and the private sector alike, SciChart is essential for ELINT/SIGINT platforms, specializing in RF analysis, Radar testing, and FMCW training systems across EW scenarios.
Our advanced rendering engine enables LIDAR, multi-channel RF spectral analysis, and linked heatmaps on any device, including embedded and custom hardware.
SciChart ensures you never miss a threat, offering unparalleled synchronized channels and complex multi-chart pane dashboards designed for enhanced sensitivity. Trust a proven solution for your defense strategy’s data analysis needs.
Case Studies
Dive into our collection of case studies to see how SciChart has solved some of the most complex data visualization challenges in the aerospace and defense industries.
I researched chart controls and tested out the trial versions of SciChart, LightningChart, and Syncfusion and decided that SciChart was far superior to the other options. The more I use it, the more impressed I am by your product.
SciChart uses DirectX and WebGL for hardware-accelerated rendering and handles millions — even billions of data points in WPF — with smooth interactivity.
With optimized rendering pipelines and real-time resampling, it delivers ultra-responsive UIs even under heavy load. It’s built for performance at every level — proven in real-world environments like Formula 1 telemetry, oil & gas dashboards, hospital diagnostics, and aerospace simulations.
To see SciChart in action see our JavaScript Performance demo page or for a more tailored demonstration book a live demo session with a member of our sales team.
See Our Aerospace & Defense Chart Examples
Explore our gallery of interactive chart examples to see how SciChart’s powerful data visualization libraries meet the unique challenges of the aerospace and defense sectors. From real-time telemetry to complex multi-channel dashboards, these demos highlight our ability to deliver high-performance, mission-critical visualizations across a wide range of applications.
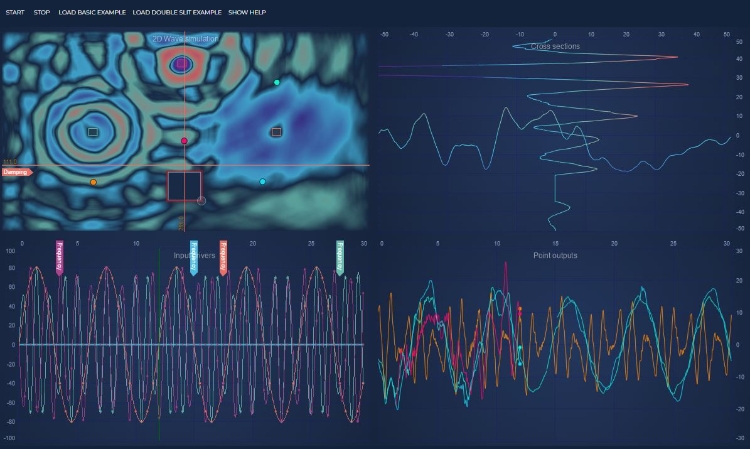
Rich Interactions Showcase
Build Adaptive Dashboards
With SciChart’s expansive API you can create rich interactive dashboards out of the box. Our custom modifiers can be used to create waveform simulations and cross-linked charts with inputs and outputs defined on mouse click. These dynamic and flexible functions enable real time situational awareness solutions, aerodynamics analysis and stress analysis in manufacturing processes with greatly reduced code requirements. Let us help you shortcut your development.
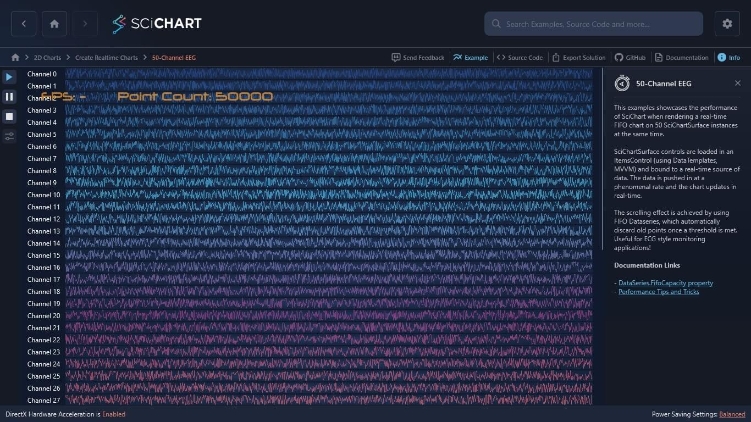
50 Channel Example
Build Complex Real-Time Multi-Channel Applications
SciChart’s performance allows multi-channel visualizations straight out of the box. As a data source agnostic product, your data source can be piped in directly, in real-time, for up to hundreds of channels simultaneously allowing enhanced concurrent analysis.

Polar Charts WPF Demo
Build Radar Systems and Integrated Platforms
Leverage EW data sources and the extensive SciChart API to build custom radar systems or visualize signal intelligence using our specialized RenderableSeries to present information exactly how you need to see it.
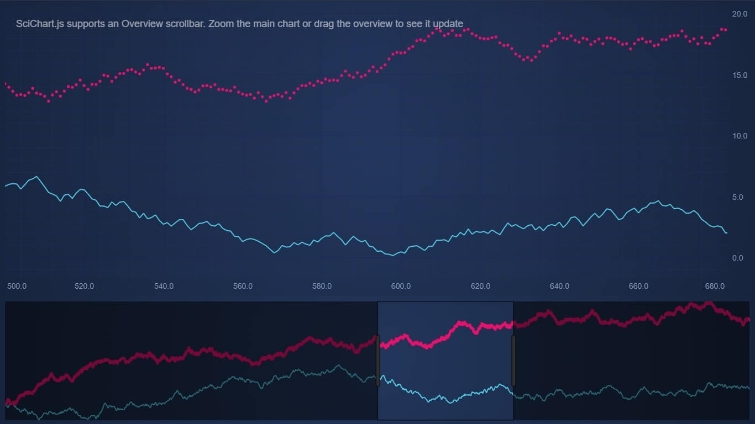
Zoom and Pan with Overview Chart
Build Complex Real-Time Multi-Channel Applications
SciChart’s performance allows multi-channel visualizations straight out of the box. As a data source agnostic product, your data source can be piped in directly, in real-time, for up to hundreds of channels simultaneously allowing enhanced concurrent analysis.
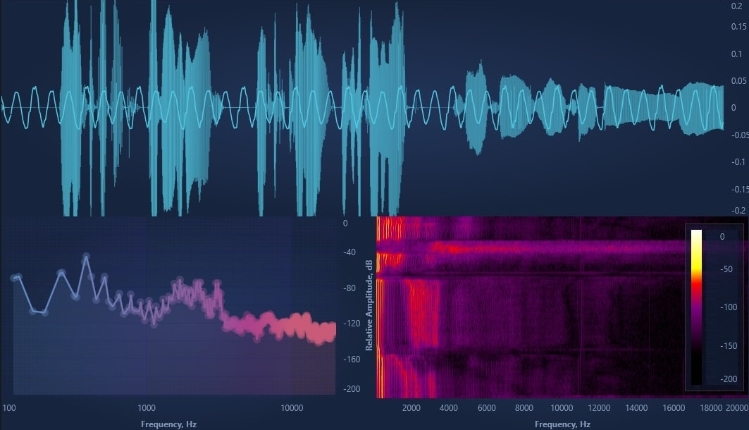
Realtime Audio & RF Analyzer
Build Realtime Waveform Analyzers
With fast, real-time charts, SciChart allows you to build real-time multi-pane waveform analyzers. Our charts can handle up to billions of points in real-time and process demanding updates (sub-1 millisecond) all while delivering an efficient CPU and memory footprint and linking chart types out of the box.
What Features Does SciChart Offer Aerospace & Defense Developers?
Thousands of examples, searchable forums, and rich documentation make onboarding easy. The intuitive and easy-to-use API delivers great functionality out of the box, so you can integrate quickly and get to value faster. SciChart charts are polished, efficient, and backed by great support. They’re flexible and customizable, so you can build exactly what you want — quicker than anyone else.

Performance & Support When You Need It
SciChart combines powerful charting software with comprehensive support, designed to meet the needs of developers – here’s what you can expect:
- .NET, iOS, Android, JavaScript, third-party libraries.
- Hardware-accelerated rendering (GPU)
- High-performance, optimized for large datasets and real-time rendering
- Handles datasets of 100M+ points
- Real-time data support and live updates
- 64 bit processor
- Up to 60 FPS
- Dynamic LOD
- Fully documented
- Technical support
- Professional support, extensive documentation and examples
Extensive Charting Features
SciChart is packed with powerful features designed to handle complex data visualization with speed and precision:
- 2D Plotting
- 3D Plotting
- Active, Searchable Forums
- Animation of Data
- Annotations on Chart
- Custom Series
- Custom Zoom or Pan behaviours
- Export / Print
- Link Multiple Charts
- Legend Customization
- Logarithmic Axis
- Multiple X-Axis
- Multiple Y-Axis
- Per-point colouring
- Programmatically Change Viewport
- Theme or template customization
- Tooltips
- Touch Interaction
- Zoom and Pan
5-Star Support for Developers
When you push the boundaries of charting you may need access to additional resources to help you to cross that boundary. That’s why we ensure you can always access the information and support you need – when you need it. If you are working in mission-critical environments where time is critical we can also talk to you about building a Developer Support package based around what you and your organization needs.
 Responsive 5-Star Technical Support
With our 5-star technical support subscription, we aim to answer all support tickets within one business day* and often even faster.
 Get Answers Fast with our AI Assistant
Ask our AI Assistant anything about SciChart and it will answer your questions fast!
 Knowlegable Support Forums
With nearly 4000 answered support requests on our public support forum, you’ll never be left without an answer.
 Extensive Documentation
1000s of pages of support documentation across all platforms for expert guidance on getting the most from SciChart.
 Tutorials & Videos
Our regularly updated YouTube channel will help you understand what’s possible and answers the most commonly asked questions.
 Hundreds of Example Charts
Over 350 chart examples will get you what you need to get out of the blocks more quickly.
Testimonials & Reviews
Award Winning Software – Continually Rated Best with Hundreds of 5-Star Reviews
With a rating of 4.8, SciChart is one of the highest rated chart libraries in the world*, used by over 10,000 expert developers worldwide.
Read All Reviews