Pre loader
Try wave

Best React Charts: Performance Without Limits

The React Chart Library Built For High-Performance Data Engineers.

You’re building systems where performance is a requirement, not just a feature. Think real-time telemetry, high-frequency trading, and 24/7 monitoring. Most React chart libraries simply aren’t designed for this kind of demand.

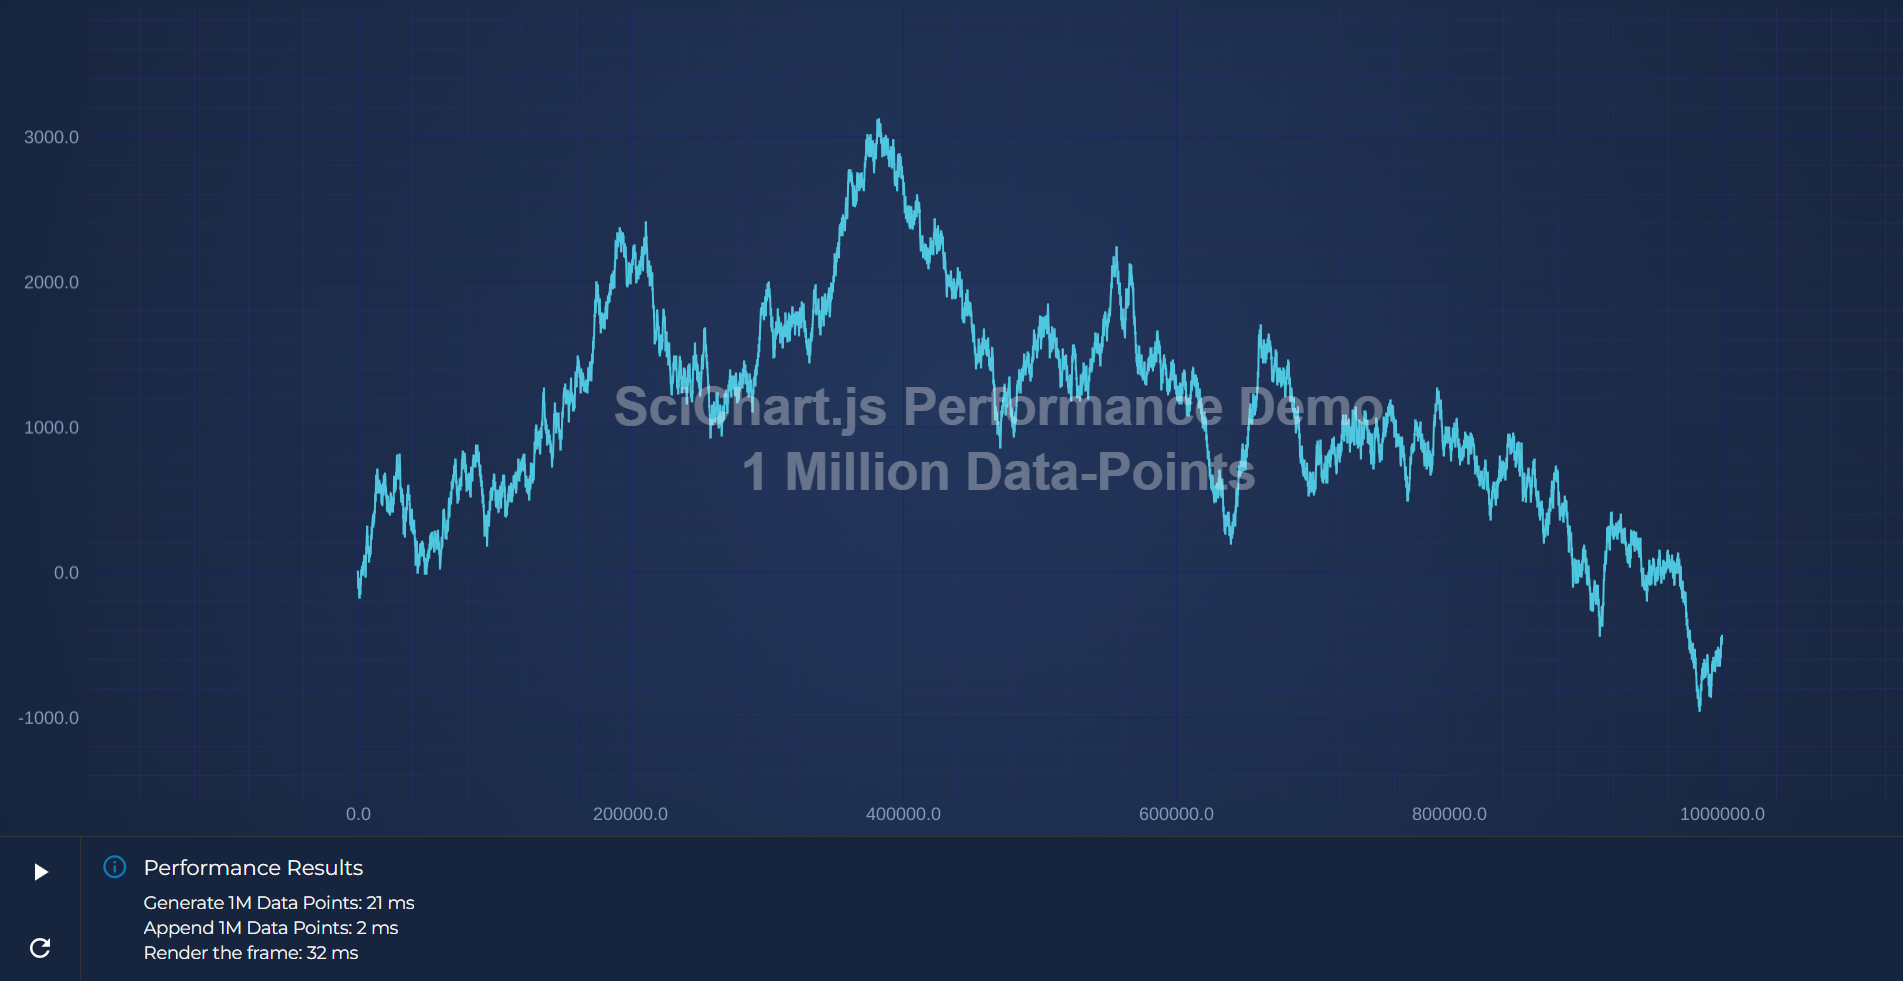
SciChart’s WebAssembly-powered Visual Xccelerator™, with GPU acceleration, is built for mission-critical performance, rendering millions of data points at a smooth 60 FPS with no frame drops. Experience continuous, stable dashboards, even after days of use, thanks to our real-time, GPU-accelerated React charts.

The Fastest React Charts, Without Lag

Handle millions of data-points and hundreds of thousands of updates per second with our WebGL and WebAssembly hardware accelerated React chart library.

It doesn’t end there. You can also create React charts with many millions of data points while zooming, panning and updating interactively. Dashboards stay smooth, even with hundreds of real-time charts.

No more chart data lagging – you can consistently maintain 60 FPS with zero frame drops. Chart start-up time is fast and our low memory and CPU footprint improves your application performance.

Learn More

React Charts for Complex, Mission-Critical Requirements

For complex, demanding charts in aerospace, F1 motorsport, or oil & gas, you need to take the interactions in your React graphs to a new level.

Compatible with TypeScript and JavaScript, these charts are made for demanding enterprise, financial, medical and scientific apps.

With SciChart.js you can get callbacks on series hover, series selection, data-point selection and even update chart data via the mouse.

Don’t struggle to create complex requirements; use SciChart.js to achieve more in less time.

The React Chart Library that Lets You Do More

SciChart provides the building blocks to create rich React Dashboards, complex financial or stock charts or apps with dynamic linked chart panes.

  • Full render control and responsive interactivity.
  • Theme everything down to the pixel without performance loss.
  • Add annotations and labels at scale.
  • Unlimited and mixed axes (linear, log, date, category) with custom layouts.
  • Multi-chart linking to sync zoom, pan, tooltips, and cursors.
  • Built-in hit-testing APIs for precision interactivity.

Even More Possibilities with SciChart v4

With v4, there are even more features and charting possibilities available.

  • React Polar Charts: Line, column, mountain, band, scatter, stacked, heatmap, sunburst, partial arcs
  • Radar Charts & Arc Heatmaps: Multi-axis or cyclical data made easy
  • Box, Triangle, Polygon Charts: Statistical & spatial overlays
  • Vector Field & Segment Series: For flow, engineering, scientific apps
  • Treemaps & Rectangle Series: Hierarchies, part-to-whole relationships
  • GeoJSON Choropleth Maps: High-resolution, interactive mapping (500k+ triangles)
  • Radial & Linear Gauges: Fully animated, customizable monitoring tools

Support That Gets You Back on Track in no Time

We get it—you don’t have time to wait around for answers to technical questions. That’s why we provide thousands of documentation, clean code samples (that work every time), a responsive customer service desk and AI-powered chart building support.

Get access to expert data engineers. Whether you’re debugging a dashboard or pushing performance boundaries, we’re here to help. Share your progress and attempts, and we’ll provide suggestions to get you back on track.

Supercharge your progress with AI support. Explore our SciChart GPT tool for quick answers to your questions and instant access to all the documentation and code samples you need.

Get Started With React Charts

Discover our helpful resources below to get started and get the answers you’re looking for with ease.

Responsive 5-Star Technical Support

With our 5-star technical support subscription, we aim to answer all support tickets within one business day* and often even faster.

Learn More
Get Answers Fast with our AI Assistant

Ask our AI Assistant anything about SciChart and it will answer your questions fast!

Learn More
Knowlegable Support Forums

With nearly 4000 answered support requests on our public support forum, you’ll never be left without an answer.

Learn More
Extensive Documentation

1000s of pages of support documentation across all platforms for expert guidance on getting the most from SciChart.

Learn More
Tutorials & Videos

Our regularly updated YouTube channel will help you understand what’s possible and answers the most commonly asked questions.

Learn More
Hundreds of Example Charts

Over 350 chart examples will get you what you need to get out of the blocks more quickly.

Learn More

What Makes SciChart the Best React Chart Library?

  • Get started with ambitious React chart projects in minutes. We provide all the examples and documentation that you need to excel with project briefs.
  • Developers love our extensive, flexible API. Extensive API documentation enables zooming and panning behavior, tooltips, legends, and much more. This enables a more interactive and seamless experience for your end user.
  • Hardware-accelerated charting engine that exceeds performance and precision expectations. We built our Visual Xccelerator™ charting engine to enable the rendering of millions of data points in real-time.

Other Benefits of SciChart

  • Reliable, secure, future-proof—SciChart is always levelling up so you can build better and faster charts. Both SciChart.js and the React wrapper are regularly updated and we take security seriously, so you can trust our product and code.
  • Top-rated developer support—because you’ve got better things to do than wait! Quick responses on technical support helps to reduce your time to completion on big data projects. With an active forum, community, and SciChart-GPT, developers can easily find the answers they’re looking for.

 Learn More About SciChart

Trusted By Developers & Game-Changers Around the World

star starstarstarstarstar 4.9 Average - 425 Reviews
G2 starstarstarstar 4.7 Average - 9 Reviews
G2 starstarstarstar 4.4 Average - 4 Reviews

One of SciChart’s main selling points is our tech support. We operate a support desk for paid customers of SciChart who purchase priority support. We aim to answer requests within one business day. You will be able to speak to the developers who made SciChart and get back to work quickly with our outstanding technical support.

Read what some of our customers say:

Read Testimonials
quote
Arne
star
star
star
star
star

After one year of using SciChart I can say that I really like it. I am able to find good examples in their library sorted by topics and they responded to my questions as quickly as their graphs render. Keep up the good work!

quote
Narmada H
star
star
star
star
star

I have used SciCharts for nearly 3 years now. The charts look amazing. They are very fast and there is a wide range of chart types to choose from. You guys provide excellent support! Great work guys. Good Luck!

quote
Francois C
star
star
star
star
star

SciChart is an awesome product with an API that behaves like you expect. If it doesn't, the out-of-this-world support will take care of it pretty quickly. How fast? They sometimes answered me back minutes after creating a support ticket!

quote
Doug
star
star
star
star
star

Excellent software that is flexible & efficient, and creates powerful visualizations. The support staff is very responsive and always helpful. I'm very pleased.

quote
Paul E F
star
star
star
star
star

SciChart is a joy to work with. They’ve got great documentation for their 2D charts and respond quickly and helpfully to questions.

Free for Non-Commercial Use, Simple Transparent Pricing for Enterprise

SciChart’s React charts come with a free community edition for non-commercial, educational and non-profit use. Our enterprise pricing is simple, transparent, and often cheaper than many commercial competitors.

Contact us to find out more about our pricing options.

Contact UsTry SciChart Today

Frequently Asked Questions

icon

What makes SciChart different from other React chart libraries?

SciChart isn’t just another React chart wrapper – it’s a GPU-accelerated, WebGL-powered engine built for serious performance. Unlike typical React chart libraries that struggle with large datasets or real-time updates, SciChart renders millions of points smoothly and keeps interaction lag-free. It’s designed for complex, high-demand applications in finance, engineering, and scientific research where precision and speed really matter.

icon

How does SciChart integrate into a React workflow?

SciChart was built from the ground up with React developers in mind. It fits naturally into a component-based workflow, letting you structure charts just like any other UI element. You can create charts that respond to props and state, and still take advantage of SciChart’s optimized rendering layer. The result is a truly React-native experience without the performance trade-offs.

icon

How customizable is SciChart for React projects?

Every aspect of SciChart is customizable – from chart themes and colors to axes, legends, and interactions. React developers can easily adapt the look and feel to match brand guidelines or UX requirements. The library also supports extensibility, so teams can add custom behaviors, interactivity, and annotations that fit their specific use cases, without being locked into rigid defaults.

icon

Does SciChart support enterprise-grade React development needs?

Absolutely. SciChart is trusted by enterprise teams across sectors like healthcare, finance, and energy for mission-critical visualization. It supports long-term projects with professional documentation, dedicated technical support, and predictable versioning. For companies building scalable React applications, SciChart offers both performance and stability at an enterprise level.

icon

Can SciChart handle real-time or live-updating React applications?

Yes – SciChart excels in real-time scenarios. Whether you’re streaming stock data or sensor feeds, it can process and display high-frequency updates with virtually no lag. Its architecture is optimized for continuous updates, so React developers can build dashboards and live visualizations that remain smooth even under heavy data loads.