SciChart.js v6 in Alpha – WebGPU, Incredible Performance Gains and more
Our team has been working hard on continued R&D with SciChart.js – High Performance JavaScript Charts – and today we’d […]
It’s been just over a year since we released SciChart.js: a High Performance Realtime JavaScript Chart Library. From the start, our goal has been to create the fastest possible JavaScript Charts, but also produce visually appealing, productive, highly configurable and flexible / powerful TypeScript / JavaScript charting controls, capable of being used in demanding business apps.
Our first version of SciChart.js was able to draw a million data points in a browser, and we have only worked to improve our performance since then.
Version 2.1 of SciChart.js (in BETA now) can draw over 10 million data points and has even been tested up to 100 million data points. That’s more than enough to show the entire history of Bitcoin in a 1-minute chart, or visualise data in the most demanding applications.
Currently, most JavaScript applications use charting in the sense that they may have a few hundred to a few thousand data-points on an infographic, chart, or graph.
Most existing Fast JavaScript Chart Libraries can only render a few thousand points before slowdown. However, trends in Js application development are changing.
Most JavaScript Chart Libraries can render a few thousand points before slowing down. Big-Data is a trend across industries and the amount of data is only getting bigger. If the speed of your JS Chart Library is not an issue now, it will be soon.
There are a lot of legacy native-code applications in Science, Engineering and Finance which need to render millions of data-points from big-data stores, sensors (telemetry, IoT). Even hardware devices like electronic test equipment, process monitoring equipment can have integrated displays which include real-time charts to visualise data. Many legacy applications are moving toward npm / Typescript / React as a UI tech stack.
Big-Data is a trend across industries and the amount of data to visualise is only getting bigger. If the performance of your JS Chart Library is not an issue now, it will be soon. With new tools like SciChart allowing you to visualise bigger datasets, it will become a competitive advantage to be able to visualise and gain valuable insights from the rich data your organisation has collected.
Before SciChart, there was no viable solution for big-data, dynamic or real-time charts in JavaScript applications, however we’ve built an award-winning, cutting-edge solution based on gaming technology, with WebGL and WebAssembly to provide high performance JavaScript Charts.
SciChart solves tomorrow’s problems today: visualising large datasets, or dynamic datasets in data-intensive applications.
We’ve built a demanding test-suite which compares the performance across a number of chart components. Included in the test are the following JavaScript Chart libraries:
Note: Other chart libraries were tested internally but not included in the results below, as we are on focussing on the most popular libraries.
We put them head to head in a demanding performance test that stress your CPU & GPU to the max to find out which is the fastest.
These are the test cases:

Demanding, Varied test cases stress different types of drawing or rendering. In our JavaScript Chart Library Performance Comparison we test:
You can find the test results of our JavaScript Chart Performance Comparison below.
Below, you can find the performance test results in table form. The test case & parameters are on the left, and the results are in FPS (Frames per second). Drawing speed is measured in FPS (Frames per second – Higher is Better), meaning, the average number of redraws per second during the test. An FPS result above 30 is smooth to the eye.
Heatmap colours highlight the winners & losers. On the right, find the Speed Increase of SciChart.js compared to the second-fastest JS Chart Library as a percentage.
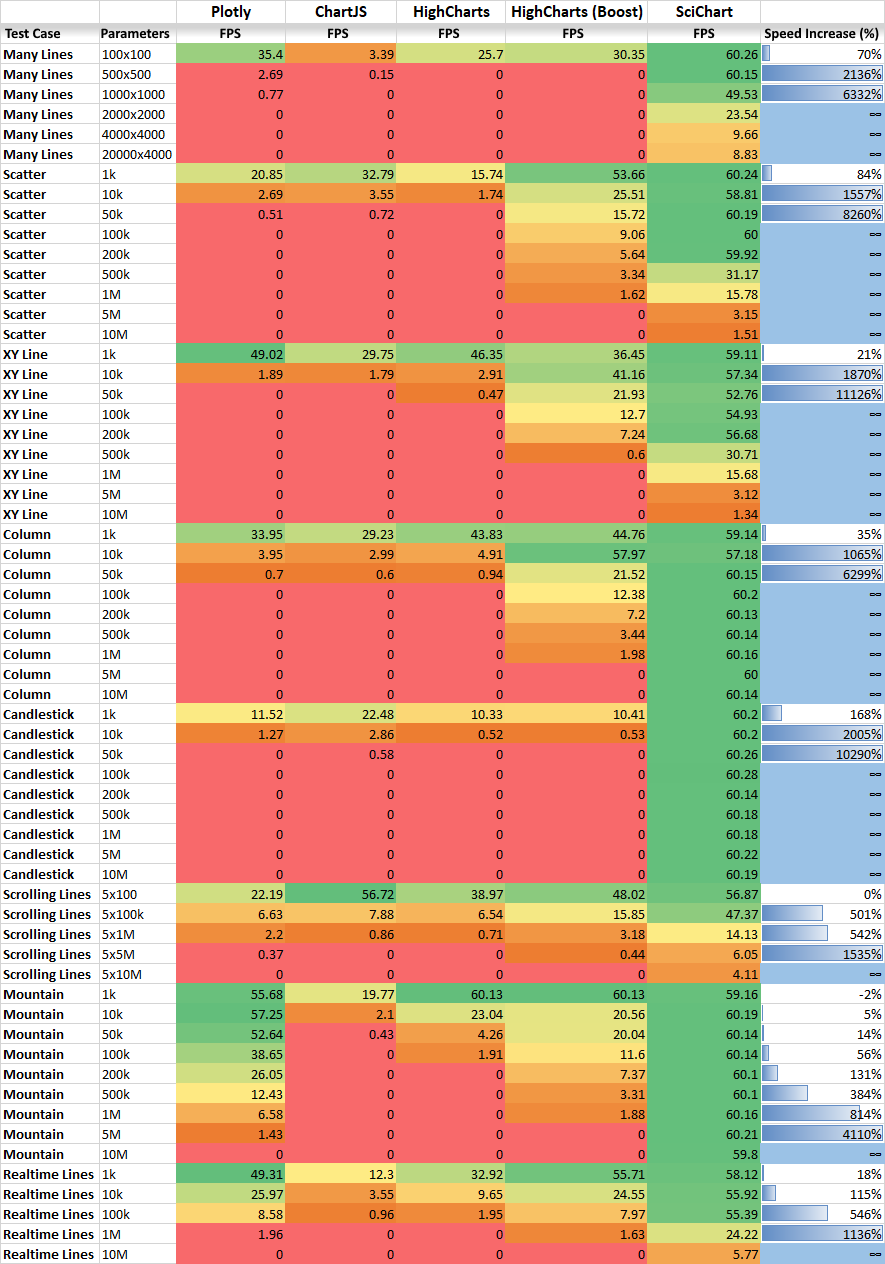
We’ll draw a conclusion below, but some immediate takeaways from the table above:
SciChart.js is incredibly fast!
Of the test results which passed, the average speed increase was 1,975% (~20x faster). The maximum speed increase was 11,126% (111x faster than the second-fastest competing JavaScript Chart). In some cases, SciChart.js was able to draw hundreds, or even thousands of times more data.
More on the performance test results below…
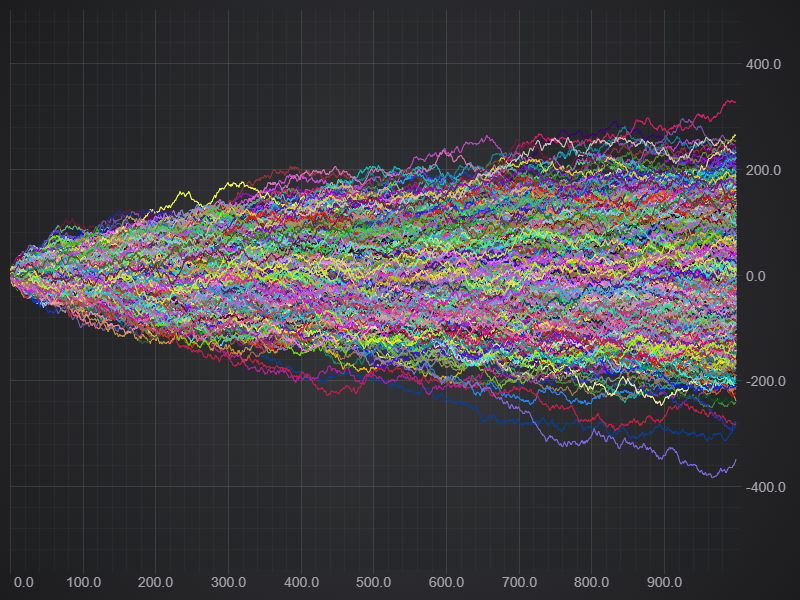
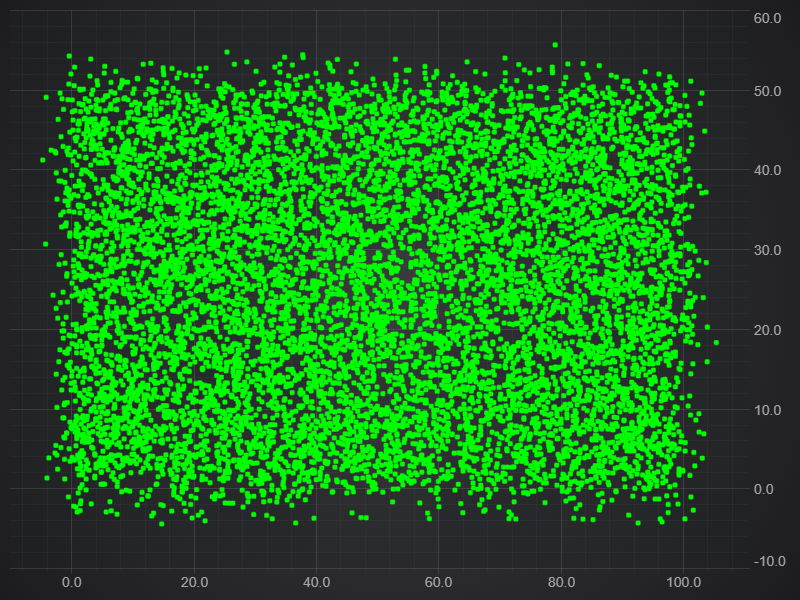
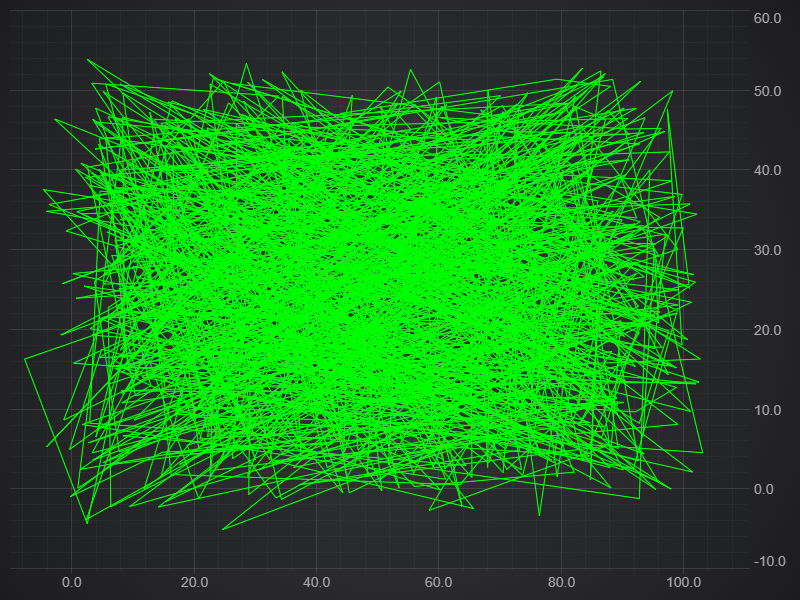
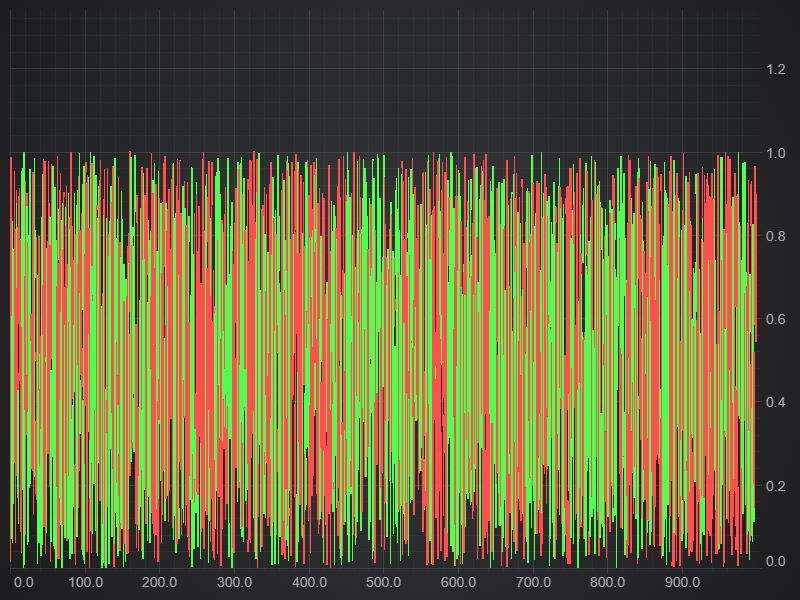
Let’s see the test results in chart form. Click on a chart to view full size!
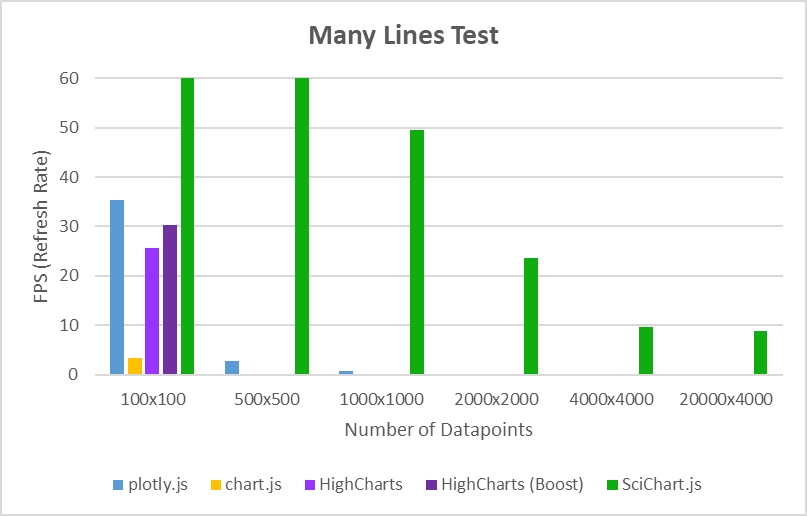
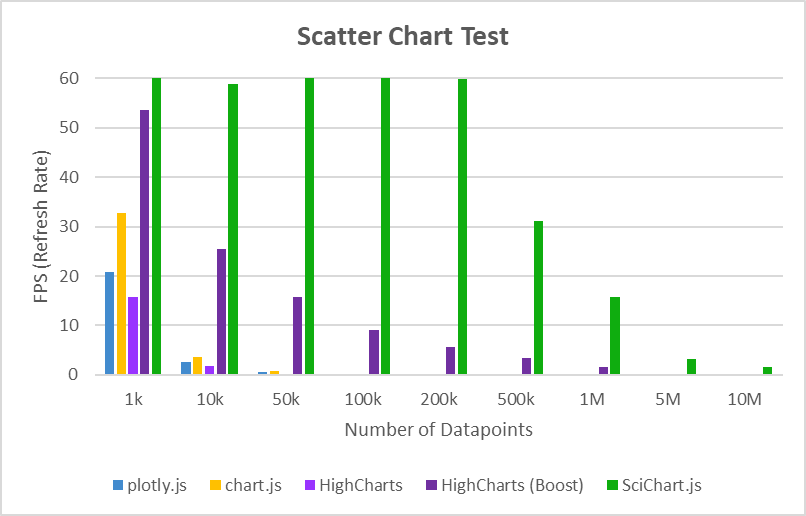
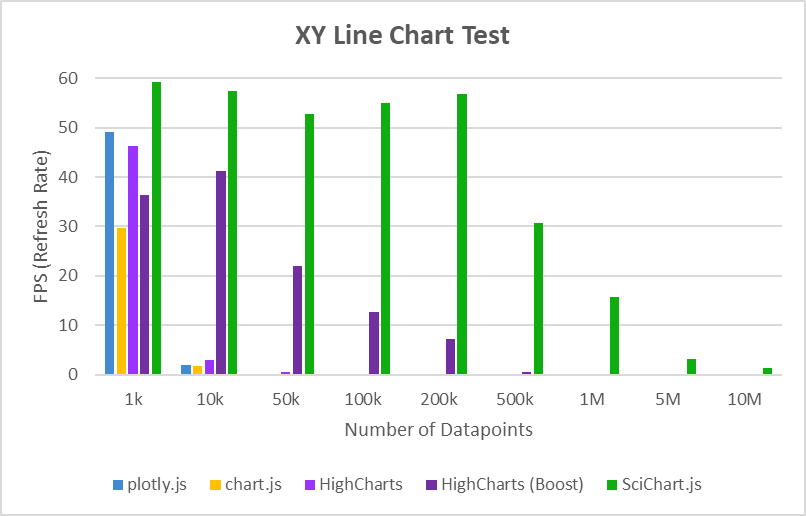
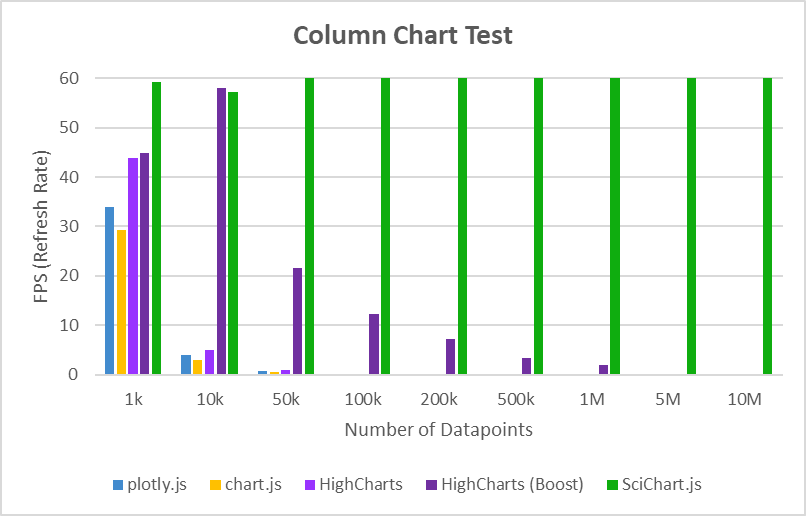
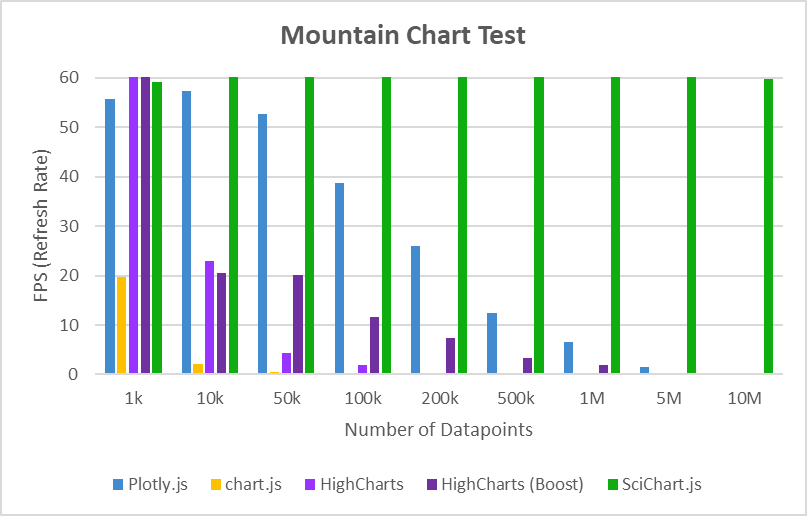
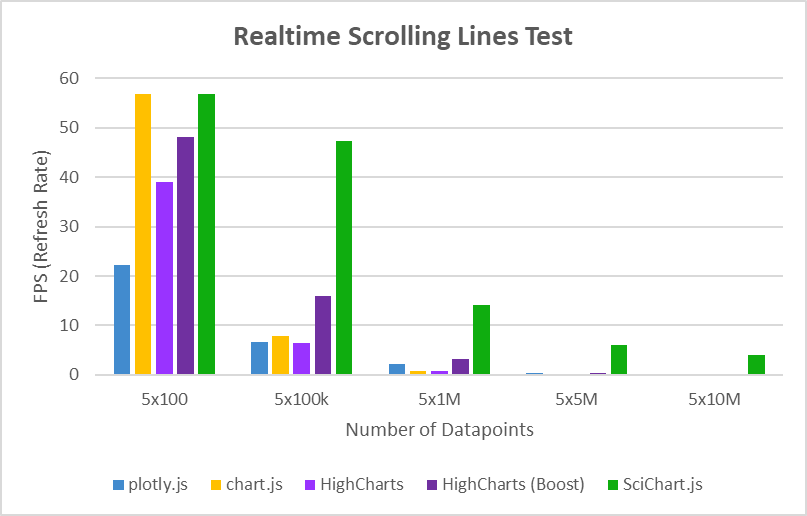
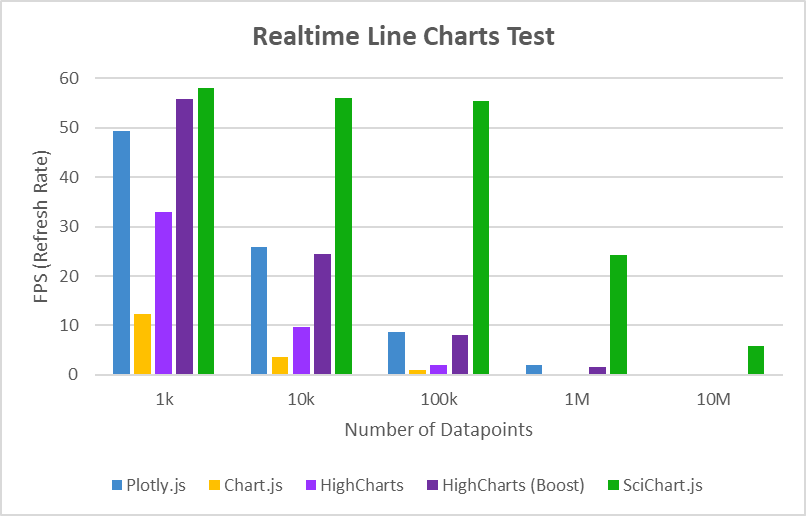
The bar charts above make it easier to see how SciChart.js (green) is performing vs. the competition. Even with 1 to 10 million data-points, SciChart.js is drawing charts at high refresh rates, meaning that SciChart is able to plot a chart in record time.
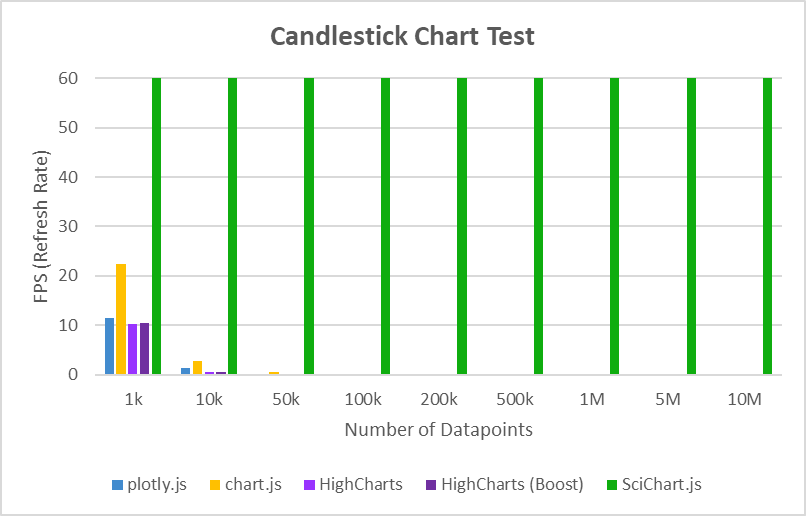
Some competing JS charts drop off very quickly. Take a look at the Candlestick chart test for example. All competitors are struggling with only 1,000 candles. At 10,000, they can barely redraw. Only SciChart.js can handle millions of candlesticks – enough to plot the entire history of Bitcoin in a 1-minute timeframe.
So, some pretty incredible performance results above for a variety of popular JavaScript chart libraries! What conclusions can we draw from these?
If you are building an application with demanding data-visualisation requirements, or porting from Windows (native code) to JavaScript, then SciChart is the only viable solution today for big-data applications, complex and data-intensive apps. If chart flexibility, rendering performance and reliability are mission critical to the success of the app, and your business, then we hope we’ve demonstrated why we remain the expert’s choice.
Find out More at the link below.
High-Performance JavaScript Chart & Graph Library v4
JavaScript Charts by SciChart are extremely fast and allow robust, high performance data-visualisation across a number of chart types & scenarios. Learn more about the features and start a trial today by clicking the button below.
Recent Blogs
![]()
Queens Award for Innovation
Proud winners of the Queens Award for Innovation, 2019. Awarded on account of our innovative graphics engine which underpins the SciChart library and enables our world-beating charting performance
![]()
National Business Awards
Highly Commended for Lloyds National Business Awards, 2019. Awarded on account of our innovative graphics engine and impressive customer base
![]()
National Technology Awards
Awarded “Healthcare Tech of the Year” at the 2025 National Technology Awards – a top UK recognition for breakthrough innovation in technology.

Reviews
SciChart has received hundreds of verified, 3rd party reviews