Building a Smith Chart in JavaScript: Inside the Rendering Pipeline
See how SciChart.js was extended to build a fully interactive Smith chart using standard APIs. This article highlights the flexibility of custom rendering and advanced interactions.

I started programming a long while ago, in 1987 I wrote my first lines of code in Basic on a ZX Spectrum, in 1999 I was programming microcontrollers in RISC Assembly, progressed to C, C++ and C# in 2003, and now work with JavaScript & TypeScript. During that time CPU hardware has come an extremely long way. Processors used to have MegaHertz clock rates and now run at GigaHertz speeds. Single core processors have become 16-core parallel processing monsters. Memory and storage has exploded from kilobytes to terabytes. Bandwidth has increased exponentially, and yet, it’s still possible in this day & age to write slow software. In fact, it’s everywhere! But what if we could change that?
In this post, we’re going to explore how, by getting hands-on with profiling and pinpointing the slow spots in your JavaScript code, you can make your applications run smoother and faster. We’ll look at why despite having more powerful computers, our apps don’t always speed up as we expect them to, and how you can use various developer tools to turn the tide.
Whether you’re looking to boost the performance of complex charts or streamline your web applications, this blog will provide practical insights into making the most of the hardware at your disposal. Let’s get started on this journey to unlock the full potential of your JavaScript applications.
JavaScript profiling is a technique used to measure the performance of a JavaScript application or script to identify bottlenecks or areas that are consuming excessive resources, such as CPU time or memory.
Profiling helps developers understand how their code executes, providing insights into which functions are called, how often they are called, and how long they take to execute.
This information is crucial for optimising application performance, as it allows developers to pinpoint inefficient code paths, unnecessary computations, and memory leaks that could slow down the application or even lead to crashes.
If your application has certain performance requirements, and if you don’t achieve those requirements, then you will need to profile the code to find out where the time is being spent, and why it’s not fast enough. Often the result can be surprising.
By profiling JavaScript code, you may reveal that a certain small function, which you wouldn’t expect to be a slow execution path, is being called millions of times. Or, alternatively, you may find that an algorithm, function or implementation is inefficient. Sometimes, profiling reveals that the structure of your application should be improved or radically changed rather than low-level code optimisations.
By finding these performance issues and fixing them, you can improve the overall performance of your application, leading to a better user experience or even achieving more than expected when it comes to project goals.
There is a famous phrase which says “Premature optimization is the root of all evil” (i). Donald Knuth is quoted as saying that programmers spend far too much time worrying about efficiency in the wrong places and at the wrong times, and should not prematurely optimize or analyze application performance. This means optimizing only after application performance becomes a problem. However, I’d also suggest you should analyze performance earlier and regularly re-analyze when you know a piece of code must hit demanding performance goals.
Optimizing ahead of time is a good idea for critical sections where performance or fast executing code is a key requirement or solves a business problem.
For example, in Quantitative Finance or Cardiac Telemetry applications it’s absolutely the right thing to prematurely optimize your code to ensure that critical sections are fast & performing well. For generic line of business apps this may not be necessary, or prudent, but when the goal of your application is to track every known piece of debris in space, or plot the vehicular telemetry data from aircraft or Formula One cars in dashboards and charts, then profiling early and often is paramount to the overall success of the app.
There are several ways to profile & analyze the performance of JavaScript code. All of them are freely available. I’ll go through the methods below:
The first method is the simplest, creating a micro benchmark using Console.time() (ii).
console.time() and console.timeEnd() methods in JavaScript provide a straightforward way to perform micro-benchmarking by measuring the time it takes to execute a block of code. This approach is particularly useful for quickly assessing the performance of small, isolated functions or operations. Here’s a code sample:
console.time('myFunction');

// Place the function or code snippet you want to benchmark here
for (let i = 0; i < 1000000; i++) {
    // Example operation
}

console.timeEnd('myFunction'); // Outputs the time taken to execute the loop to the console
This method allows developers to easily compare the execution time of code blocks, helping identify which parts of their code might benefit from optimization. It’s important to remember, however, that micro-benchmarking with console.time() is best suited for simple performance evaluations.
console.timeEnd() outputs the time elapsed to the JavaScript console, but not to a variable. A slight variation on using console.time() and console.timeEnd() is to use window.performance.now. This returns a high resolution timestamp in milliseconds which can be stored in a variable (iii).
const start = window.performance.now();
doLongRunningOperation();
const end = window.performance.now();
const time = end - start;

console.log(`performance test: ${time.toFixed(2)}ms`);Google Chrome Developer Tools offer some rich performance profiling information including the time taken for function calls, call trees or network requests. This is not my favourite method (I’ll get onto that below), but it is the most popular and most well known.
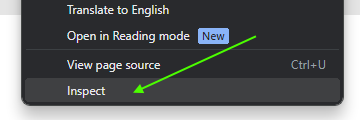
To open the Chrome Dev tools Performance Profiling right-click your web application and select ‘Inspect Element’
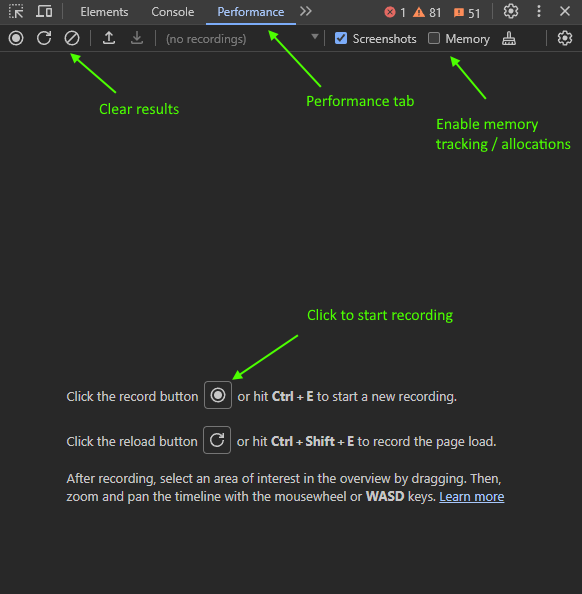
Next, go the Performance tab.
Try it out on one of our examples, for example, this realtime JavaScript Oscilloscope Demo which renders a real-time updating chart in a browser.
Enable and run Chrome Dev Tools performance profiling and you should see some output like this:
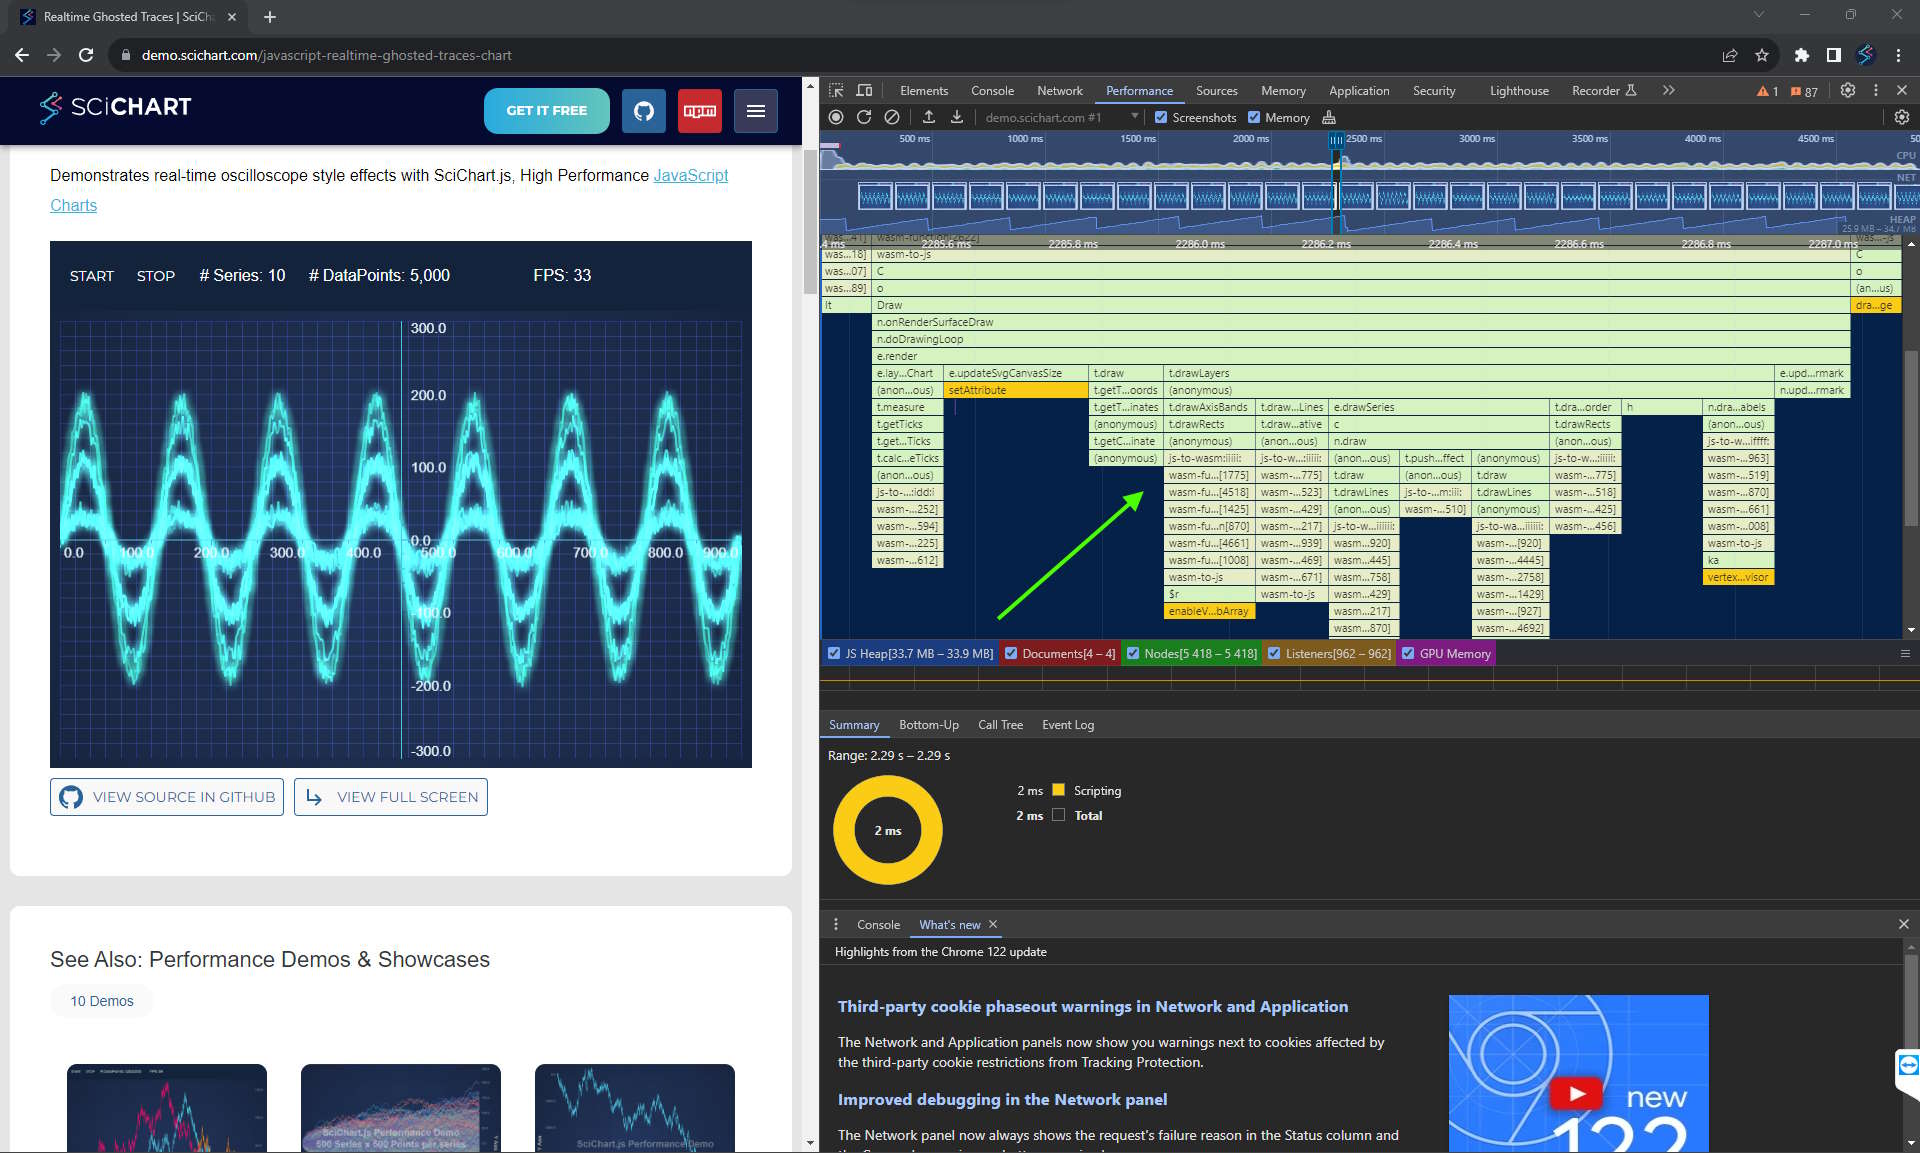
Zoom in onto the Treemap on the right and you should see individual frames of the JavaScript Chart updating, and zooming in further you can see detail of how long individual functions take plus the contribution of each function it calls.
For example, in the JavaScript Oscilloscope Demo, a single redraw denoted by onRenderSurfaceDraw takes around 1.5ms on my PC, with around 0.35ms for drawing chart sieries, 0.14ms for drawing axis bands and 0.11ms for drawing axis labels.
When zooming in, you can also see the time spent by child functions, the memory allocations (if memory tracking is enabled), and webassembly (wasm) calls where applicable. This allows you to gauge the relative performance of functions or operations in JavaScript code and find bottlenecks or ‘hot areas’ to optimize.
Note: Some overhead is added in the profiling process, so you should view the results as relative not absolute. For example. focus less on a function taking X millisconds and more on the fact that it’s a large or small percentage of the total time spent.
A tool I personally prefer to Chrome Developer Tools for performance profiling is Firefox Developer Edition (iv).
It has some advanced performance profilers in it with a call tree view that is far more intuitive than Chrome Dev Tools at finding and analyzing performance hot-spots in your JavaScript code. There are some caveats in that FireFox will measure performance slightly differently to Chrome. We’ll go into those below.
In order to access the performance profiler in FireFox Developer Edition, you carry out the same steps.
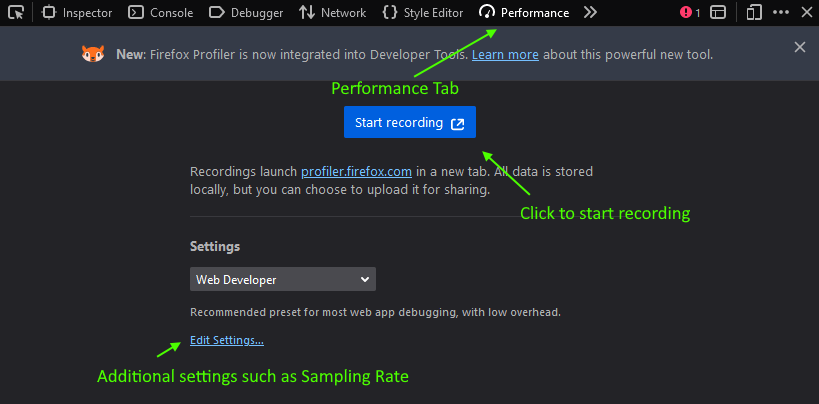
Here are the results when running the JavaScript Oscilloscope Demo.
The Firefox Developer Edition profiler gives you a much more easy to navigate call-tree, with a breakdown of percentage time spent in each function.
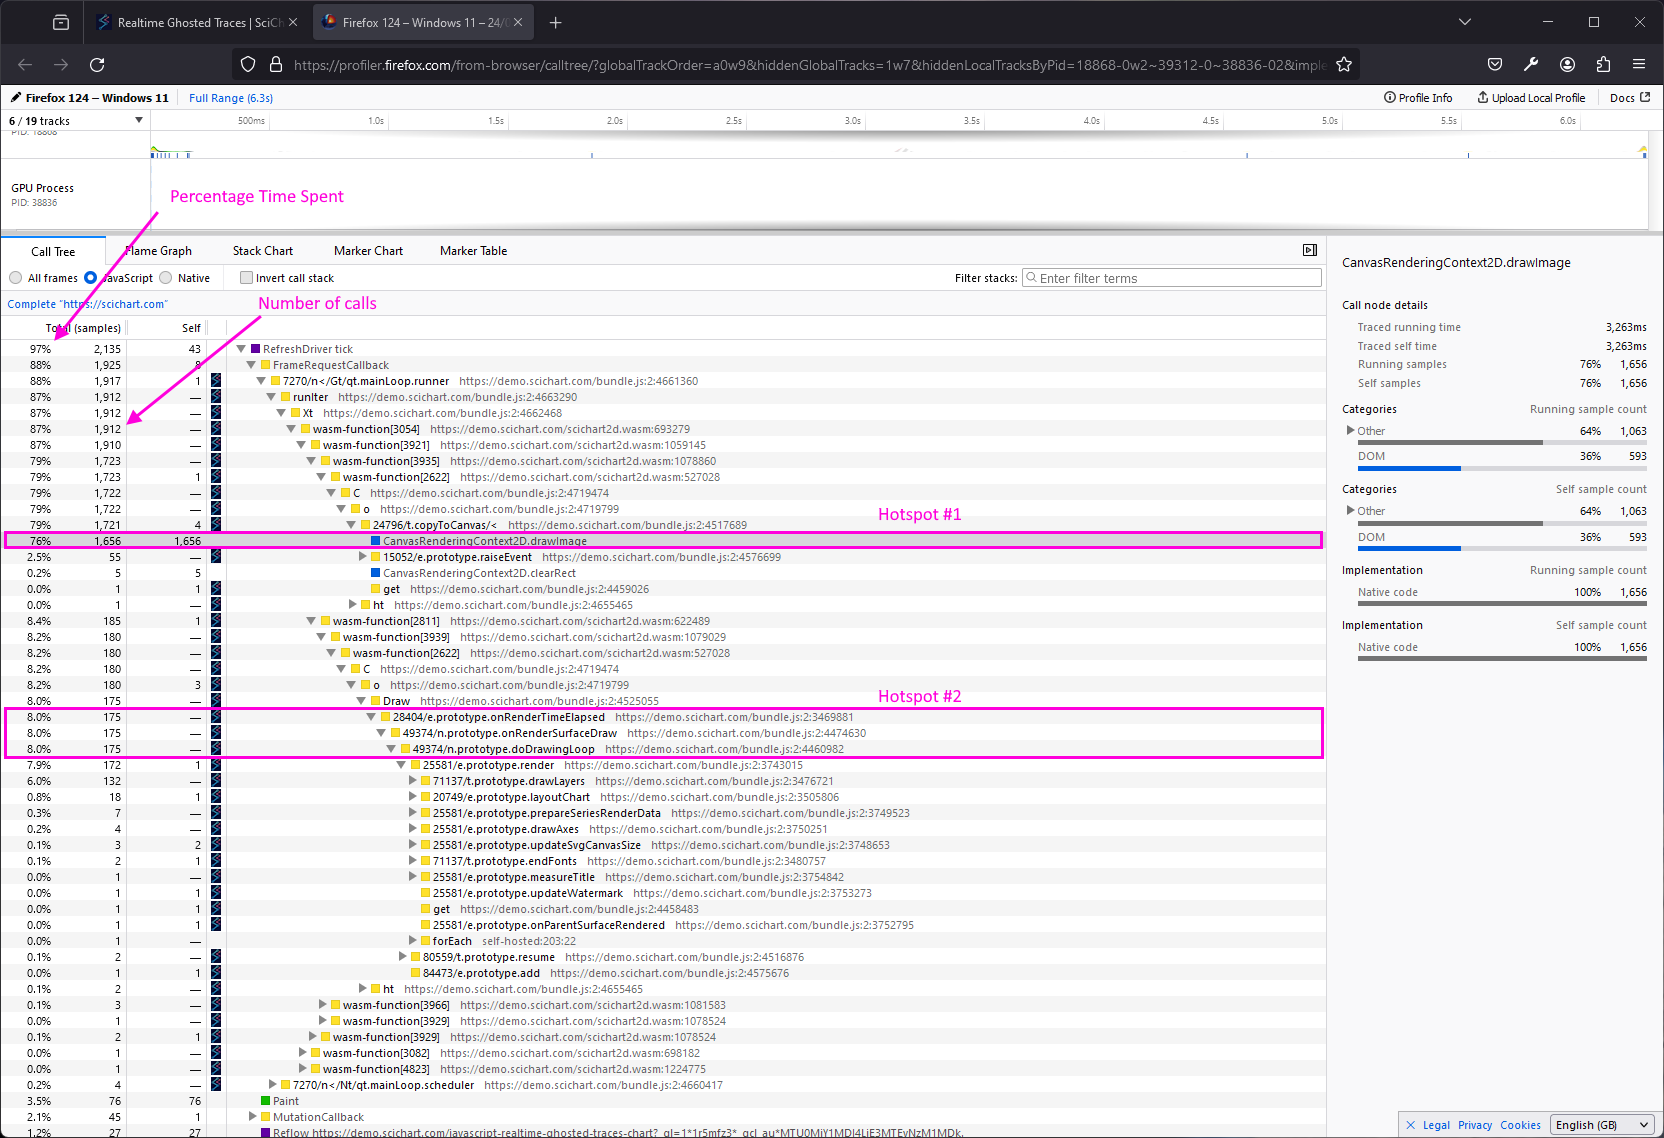
What you’ll notice above:
CanvasRenderingContext2D.drawImage – drawing to canvas is a known bottleneck in Firefox (v) and this time is much smaller on chrome. It can be ignored for the sake of profiling if your target browser is Chrome, but you should be aware: too many canvas draws will slow your application down.Draw – where the actual chart is drawn.If you want to focus on the latter 8% and identify areas for improvement, then right click a function and select ‘focus on function’.
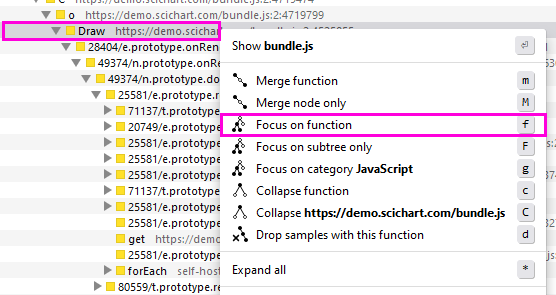
This takes you into a view where that function is considered 100% of your application time, allowing you to analyse the performance of every function it calls relatively.
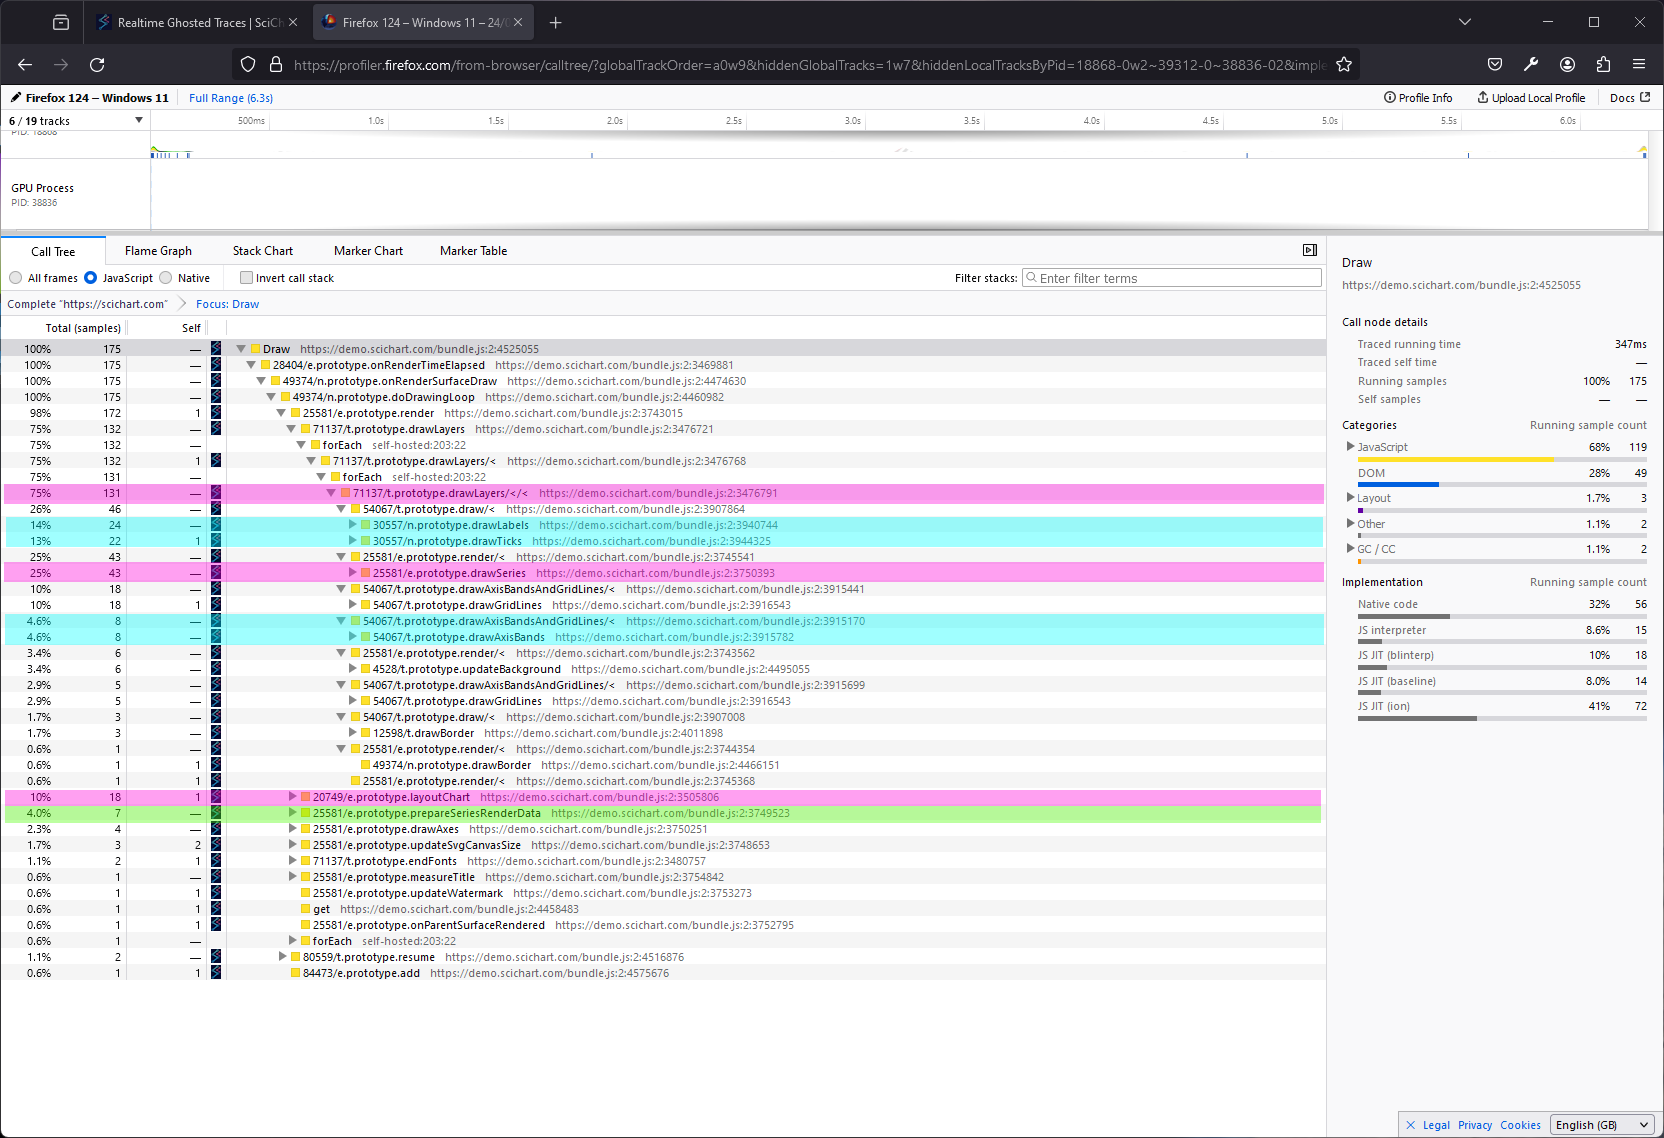
Let’s have a closer look at the Draw function in SciChart’s JavaScript Oscilloscope Chart demo.
Draw function is considered 100% of the application timedrawLayers where the actual drawing occurs.drawLabels and drawTicks – small marks on the axisdrawSeries – the actual chart seriesdrawAxisBandsand drawGridLines – more axis componentsIt sounds counter intuitive but analyzing the above example, just drawing axis labels, ticks and axis gridlines takes more time than drawing the chart series. So, this is one possible area for optimisation in this example.
When analysing performance of a JavaScript application, try to follow these tips to get a good read on where the bottlenecks are in your code.
Here are some tips to improve performance of your JavaScript applications.
Float64Array with size, or Array with a size rather than an empty array and calling push frequently.If you have some slow code and need to improve it, try to follow the steps above and create a profiler report.
Sometimes however, minor changes are not enough and you will need to make a major overhaul to an application to hit required performance goals.
Consider for example the area of JavaScript Charting. It doesn’t matter how much you optimize allocations, network requests or use WebWorkers, if your chart drawing is a major bottleneck in the app then you may need to replace it.
If so, consider something like SciChart for your applications: an extremely fast, high performance JavaScript Chart library built from the ground up for optimal performance.
To learn more about SciChart.js or to discover it’s features in more detail, take a look at the post below:

Learn more about the features & benefits of SciChart.js: an enterprise-grade alternative to HighCharts, which allows you to integrate complex & demanding JavaScript & React Charts your applications. … Continue reading High Performance JavaScript Charts & Graphs for Enterprise Applications
Alternatively, to see in-depth performance of SciChart vs. several chart libraries, read the article with a performance comparison below:
In this post, we compare the performance of SciChart.js, a WebGL hardware accelerated chart library with HighCharts (with / without Boost), Chart.js and Plotly.js. In all performance tests, SciChart outstrips competitor performance considerably, making this a strong choice for applications which require big-data, or where the application is visualization heavy … Continue reading Comparing the Performance of JavaScript Charts
Finally, if you have a difficult requirement to hit performance goals in your app and need expert assistance, that’s also something we can help with. Our team are experts in analyzing and improving performance in JavaScript, TypeScript and WebAssembly. Contact us to find out more.
Contact us to learn more
SciChart.js is a fully WebGL accelerated JavaScript and React Chart Library designed for complex, mission critical data visualization applications. Now with a FREE community edition. If you have a question or would like to learn more about our products & services, please contact us:
Recent Blogs
![]()
Queens Award for Innovation
Proud winners of the Queens Award for Innovation, 2019. Awarded on account of our innovative graphics engine which underpins the SciChart library and enables our world-beating charting performance
![]()
National Business Awards
Highly Commended for Lloyds National Business Awards, 2019. Awarded on account of our innovative graphics engine and impressive customer base
![]()
National Technology Awards
Awarded “Healthcare Tech of the Year” at the 2025 National Technology Awards – a top UK recognition for breakthrough innovation in technology.

Reviews
SciChart has received hundreds of verified, 3rd party reviews