At SciChart we are big fans of open source! We use open source in some of our chart controls, such as SharpDX (a managed wrapper around DirectX), Rene Schulte’s brilliant WriteableBitmapEx (for line drawing in WPF), WordPress/PhP on the website and more. We’ve even written some open source components such as the popular, free WPF Transitionz library. So, we don’t want to disparage the hard work of any open source chart component developers.
However, we do often get asked the questions ‘is your software free?’ and ‘why should I buy SciChart vs. using a free open source chart component?’
In this article we compare our software vs. a few popular free WPF, iOS & Android chart libraries and present reasons & benefits when it may be better to choose SciChart’s best wpf charts over open source, free charts for your WPF, iOS, Android & Xamarin applications.
Topics in this article include:
Reason #1: Enterprise Tech Support
This first reason almost goes without saying. One of the biggest value-adds of using a commercial, JavaScript, WPF, iOS or Android chart control is the insurance of knowing you have Enterprise technical support. If charts are mission critical to your project, and resolving any issues, should they occur, is important to you, it’s a very strong reason to consider a commercial chart control such as SciChart’s chart library.
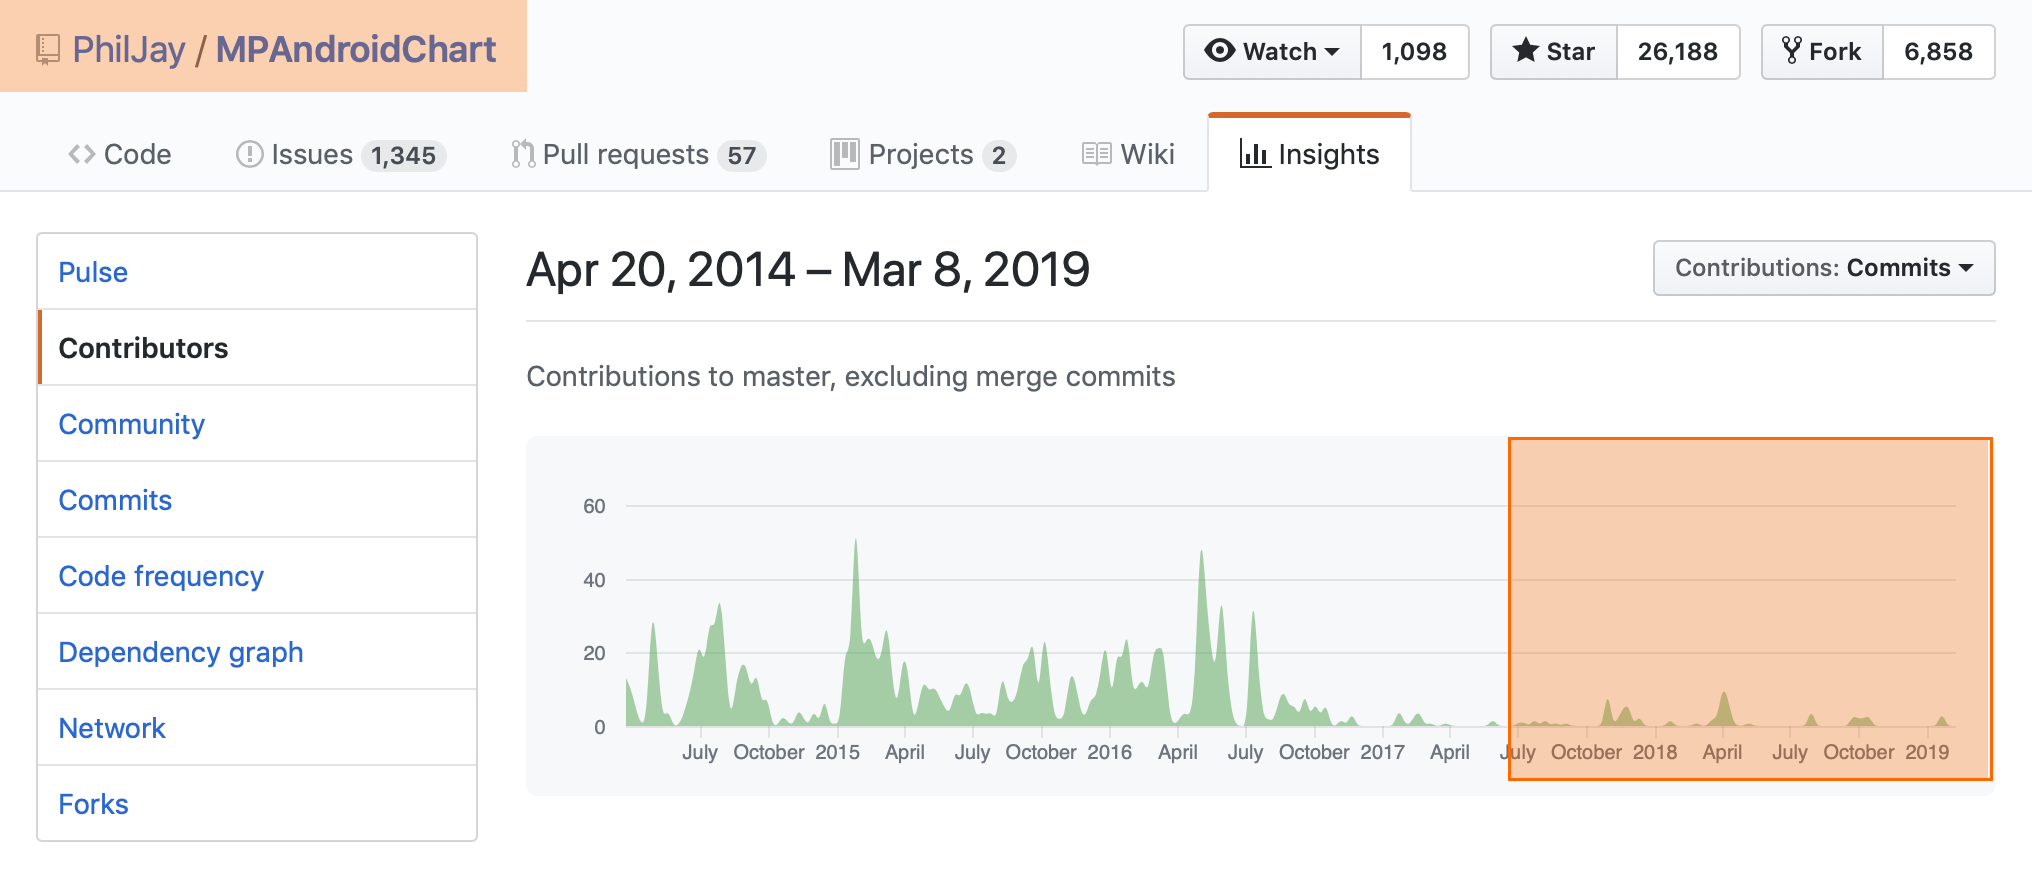
The following table shows the reported open issues on four major open source chart projects: OxyPlot (WPF Charts), LiveCharts (WPF Charts), MPAndroidChart (Android Charts) and Charts (iOS). New questions are asked every day on the github repositories for these libraries, and many are unanswered.
| Open source project | Number of open issues |
| OxyPlot (WPF Charts) | 553 open issues |
| LiveCharts (WPF Charts) | 514 open issues |
| MPAndroidChart (Android Charts) | 1983 open issues |
| Charts (iOS Charts) | 789 open issues |
| SciChart (WPF, iOS, Android, Xamarin Charts) | Over 7,500 support incidents resolved. |
Table 1: Open issues on popular open source chart components
We’re not surprised! One twitter influencer described the flood of open source help requests as ‘the fire-hose of open source’: When your open source chart library becomes popular you will be flooded with requests from users asking for help, demanding bug fixes and features, and it can quickly become unsustainable to handle them. So, the open source developers (some of whom have done a great job writing software!) quite rightly stop answering. Even we find it hard work sometimes to answer as many support requests as we do: over 7,500 requests for help, technical support or forum questions to date, and its our job! I can’t imagine having to do this level of work in spare time.
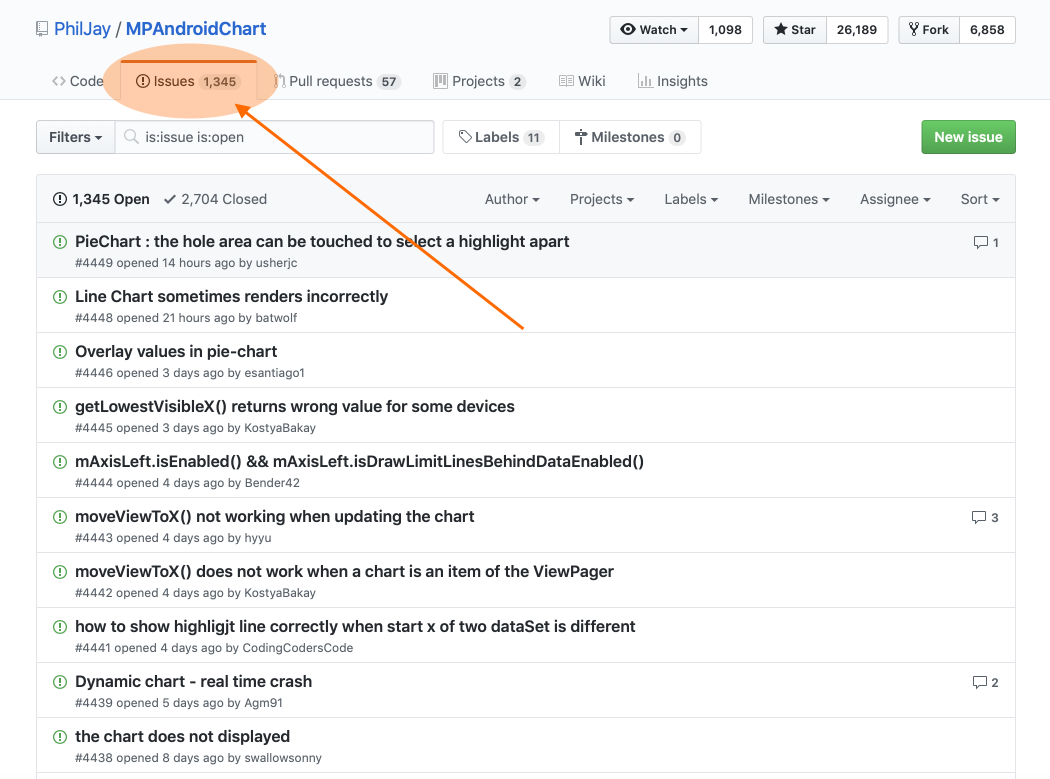
Figure 1: Issues outstanding on the MPAndroidChart open source chart library
What this means for you is, if you use an open source chart control in your business-critical project and one day you need help, and stackoverflow or the community is unable to provide it, you will be stuck… This could cost your business time and money if your application development is delayed if your productivity is affected while trying to find a solution.
SciChart’s 5-star rated Enterprise tech support is an insurance policy against problems you might encounter during your project. Our tech support is not meant to be a replacement for google, or research, but if WPF, iOS, Android or Xamarin charts in your project are mission critical to your business, at some point you may encounter a problem or issue that needs our team to help you. This can save you time and money to get back to what you are supposed to do: developing your application.
Reason #2: Ease of Use & Productivity
Technical support isn’t the only reason to choose SciChart vs. an open source chart component. We think you’ll find that if an API or library is productive and easy to use, it can lead to bigger cost saving than those provided by tech support.
- Consider how much is your time worth per hour or per day?
- How much time might you save in a year of using SciChart vs. an open source chart?
Think about the time to get started, learn the API, to find information you need on the web. If you have a requirement that is not simple, you might need to do some research to find the answers. With SciChart, you won’t need to save much time for the license to pay for itself entirely.
Example:
- Cost of developer time: $75 / hour ($600 per day)
- Cost of SciChart License: approx ~$1699 for SciChart WPF 2D Professional
- Only 3 developer days need to be saved in a year before SciChart pays for itself.
It’s quite reasonable to assume you might save an hour per week when using SciChart vs. an Open Source chart component. More if your project is chart heavy. An hour per week adds up to 48 working hours per year, or 5 days of developer time: much more than the cost of the license.
One of our customers left us a great review, which said this:
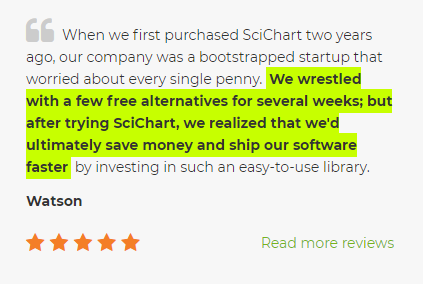
This is really an incredible review and we’re grateful, but did you notice that the author spent several weeks evaluating free alternatives to SciChart? Free software can come with a cost of your time, and although SciChart is a commercial control meaning initial cost to your team, the care and attention that has gone into the API, examples, documentation and online help resources such as tutorials and forums will lead to faster development of the application & cost savings in the long run.
Reason #3: Developer activity & Speed of Bug Fixes
This reason is closely linked to #1. We have noticed that the development activity of many of the popular open source chart controls has declined over time, however, the demand for features and improvements has increased with their popularity.
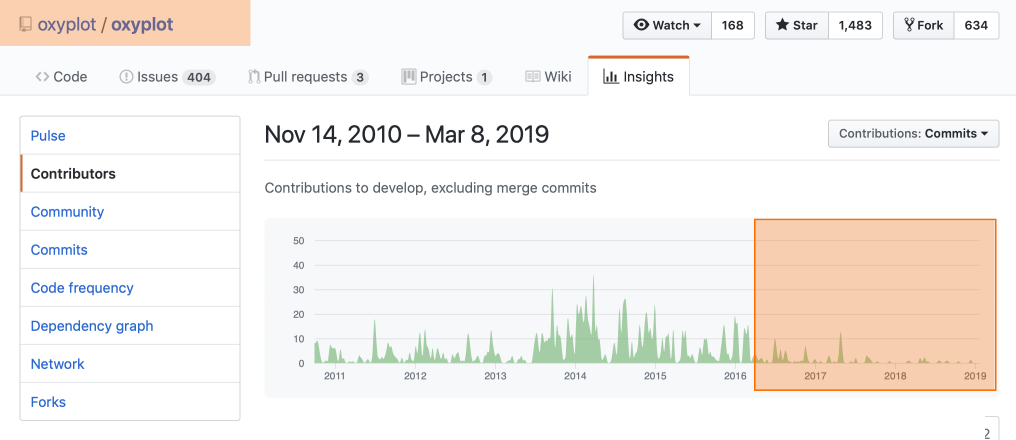
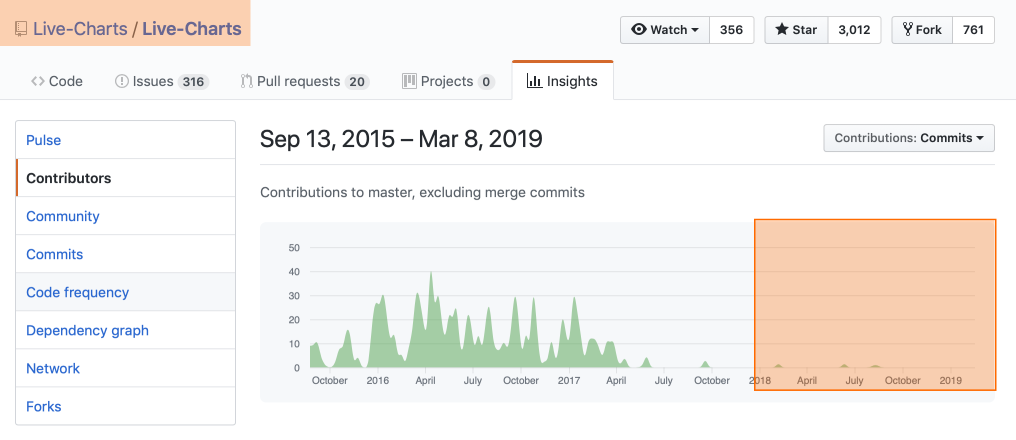
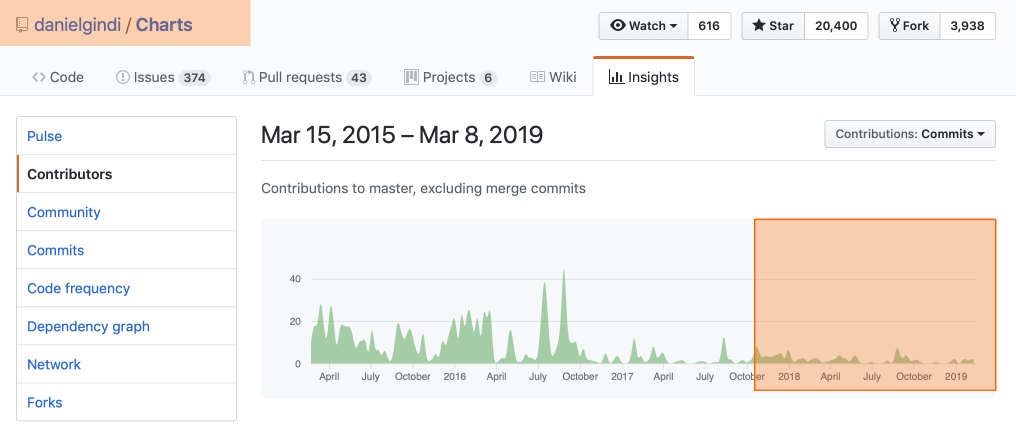
Above you can see the Github activity of the four main open source chart components.
Below you can see our github activity. In contrast to the open source projects listed above, our development activity has increased; actually in the past two years it has really heated up since every day at SciChart we get new feature requests and demand for more improvements, better performance, compatibility with a new framework etc…
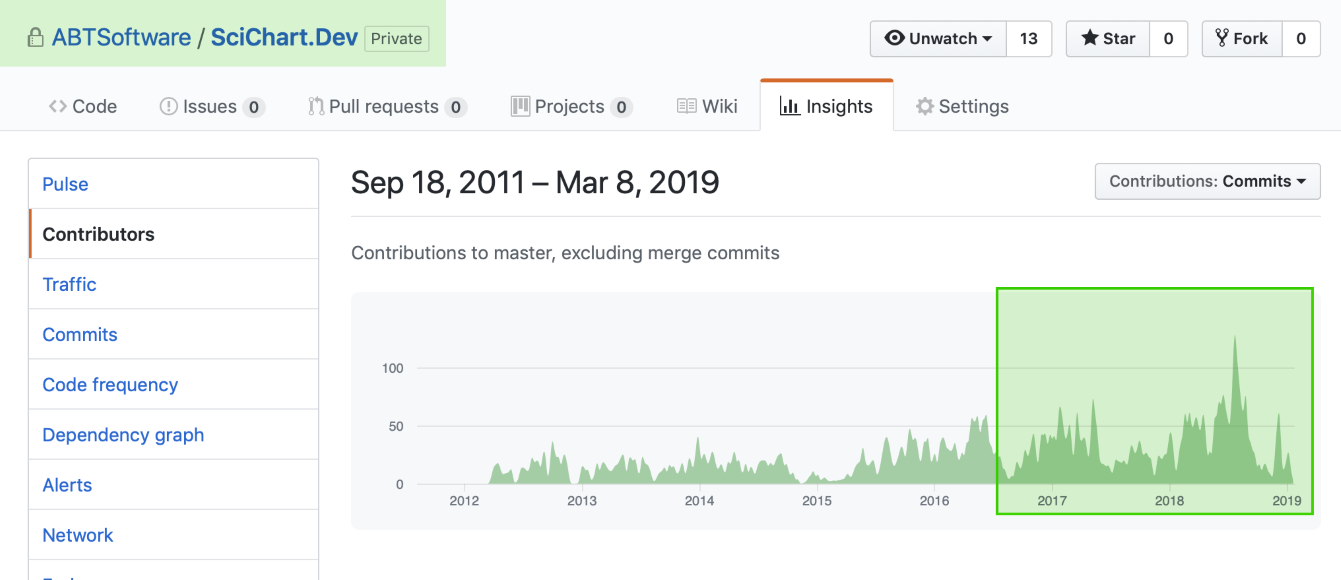
Figure 2: Development Activity on the SciChart Github repository
SciChart started as a project in 2012 and seven years later, we now have 14 developers now working full time on our WPF, iOS & Android charts. I cannot tell you how surprised I am (probably more surprised than you!) that charts (just X,Y values … on a screen … ) would take decades of effort…
So what does this mean for you?
If a new .NET Framework is released (Windows), new version of XCode, iOS, or Swift, a new Android SDK or Xamarin SDK is released then both commercial and open source charts have to be updated to be compatible. Sometimes a new device comes along and an application doesn’t work. Sometimes a critical bug occurs since an operating system or framework update and the chart component has to be fixed.
There is a risk you take when using any free open source or commercial chart control that the developer ceases to update their software, however, with SciChart that risk is minimized since our developer activity and popularity has been increasing over time.
When bugs are reported in our WPF Charts, iOS & Android Charts or Xamarin Charts we will aim to fix the serious ones as fast as possible, because they directly affect our customers, and therefore us!
That’s why we are charge a fee for what we do – we love free software and we think the open source chart developers do a great job, but in order to provide excellent software to you that is always up to date, fixed fast when there’s a problem and incorporating the latest features that you ask for then we must charge. We aren’t perfect, but this is our job and our livelihood and we have a strong incentive to work hard for you so that your projects are a success, plus, a good reputation to maintain!
Reason #4: Depth of Features
At SciChart, we only focus on charts. As a result, we strive to create a depth of features beyond when open source chart components are able to achieve and even beyond what many commercial vendors do too!
Take a look at the features matrix below to see what features SciChart can bring which open source components do not.
.fa-times-circle { color: #FF3333; font-size: 1.2em; } .fa-check-circle { color: green; font-size:1.2em; } .fa-exclamation-triangle { color: orange; font-size: 1.2em; }
| Feature | SciChart | MPAndroidChart | iOS-Charts | OxyPlot | LiveCharts |
| 2D Plots | |||||
| 3D Plots | * | ||||
| Active, searchable forums | |||||
| Animation of Data | |||||
| Annotations on Chart | |||||
| Custom Series | |||||
| Custom Zoom or Pan behaviours | |||||
| Export / Print | |||||
| Fully Documented | |||||
| Hardware Acceleration | |||||
| High Performance & Realtime | |||||
| Link Multiple Charts | |||||
| Legend Customization | |||||
| Logarithmic Axis | |||||
| Multiple X-Axis | |||||
| Multiple Y-Axis | |||||
| Per-point colouring | |||||
| Programmatically Change Viewport | |||||
| Technical Support | |||||
| Theme or template customization | |||||
| Tooltips | |||||
| Touch Interaction | |||||
| Zoom and Pan |
Table 2: Feature comparison of SciChart vs. popular Open Source Chart components such as OxyPlot (WPF), LiveCharts (WPF), MPAndroidChart (Android) and Charts (iOS). *3D Support coming soon to Mobile
Key:
- Means the feature is supported by the open source chart
- Means the feature is not supported by the open source chart
- Means there is limited support (requires workaround, or limited compared to SciChart)
The open source charts are in many cases, good enough for simple applications. If you want to just add a few low point-count 2D charts to your application, they can do the job. However, it’s the depth of features where SciChart really shines.
Reason #5: Flexibility
Most open source or commercial chart controls for WPF, iOS, Android provide the following standard features:
- Many chart types (e.g. Line Charts, Scatter charts, Column Charts, Pie Charts)
- Axis types (e.g. Date Axis, Time Axis, Numeric Axis)
- Basic customisation features (e.g. TextFormatting, Themeing)
- Inspection support (e.g. Tooltips, Legends)
- Built-in zooming and panning
It would be easy to compare two chart libraries and see that they all support the above features and conclude ‘They’re the same’. Far from it.
With SciChart, you will find our API allows for complex customization is possible on nearly everything, and if we can’t support something, we will give a workaround, or, accept a feature-request for future development.
Here’s a selection of some of the deep features that SciChart supports which allow greater flexibility when creating charting applications for business.
- Series Selection
- Data-point Selection
- Axis label programmatic string-formatting
- Overriding of Axis gridline, label frequency
- Custom UIElement or UIView annotations and markers
- Per point colouring
- Custom interaction behaviours such as custom zooming, panning
- Custom Series
- Vertical charts
- Vertically Stacked Axis
- Central Axis
- Programmatically change zoom or pan
- Undo Redo of zoom
- Add Trendlines, best-fit curves, moving averages and splines
- Scrollbars on X,Y axis with preview of the chart behind
Its really hard to get these hidden features which provide excellent flexibility of our chart controls into a short list! These are just some of the flexibility options that SciChart has that open source chart controls and even commercial chart vendors do not have. Deeper features and more flexibility means you can get more complex requirements done quickly, which adds up to big cost savings over time, and ROI for your team.
Watch the video below to learn about 15 hidden features in our WPF Chart component to find out more:
Reason #6: Chart Performance
There are plenty of reasons why to choose and consider SciChart even if your application only needs to show modest dataset sizes. However, some of our users have very demanding performance requirements, and SciChart is capable of drawing many millions of points, update charts in realtime and with a low memory and CPU footprint on all the platforms that we support (iOS, Android, Windows/WPF).
We have created the fastest iOS charts & Android charts in the world (by a long way!), and one of the fastest, high-performance charts for WPF and Windows applications. Our charts are based on a hardware-accelerated rendering engine using DirectX (Windows), OpenGL ES (Android) and Metal (iOS) so that you get the fastest charting possible in your applications.
What does this mean to you? It means that SciChart makes impossible projects, possible.
We compared the performance of SciChart vs. some well known open source chart components, and discovered that our iOS & Android charts performed an order of magnitude faster than open source libraries (See iOS Chart Benchmarks and Android Chart Benchmarks). This means more data can be shown in your apps and previously impossible app ideas can now be realised. Our WPF Charts are also similarly fast compared to open source WPF charts. We are also working continually to make better gains in this area of performance and ensure that our charts are smooth and realtime in your applications.
When to choose SciChart vs. Open Source?
So given all of the above, when should you choose SciChart vs. an Open Source Chart component? There are some good arguments above, but you will find some more in the article seven reasons not to use Open Source. Some which are cited include:
- When proprietary software is easier to use
- When proprietary software offers technical support
- When proprietary software works better with your hardware
- When you need a vendor to stick around
In the article Open Source: What they’re not telling you there is further discussion to decide when to choose open source vs. a proprietary vendor.
In conclusion: when the requirement complexity is large, or the application is business critical, when features or performance matters and you need a component which is actively developed, you should definitely consider choosing SciChart for the charts in your enterprise applications!
SciChart vs. Open Source ROI Calculations
We’ve created some simple ROI calculations below to help you get an idea of the return on investment when purchasing SciChart. Some assumptions are made and no calculator is perfect!
If you consider the number of developers on your team, and the developer rate, you can get an idea of cost for your team’s time.
Next, estimate the time saved per developer per month. For example, conservatively estimating 1-hour a week saved from productivity, you might arrive at a figure of 4-hours per month. The actual figure could be higher in applications which are charting-heavy.
Finally, estimate the number of support incidents per year. Support incidents which are serious are rare, perhaps you will only get one or two a year, but each one might block your team for a long time if not resolved. So for example, estimate 2 days per year, but 16 hours of time lost per incident.
The calculator will output the return on investment for your purchase.
These are the results:
| Number of developers on team | 5 |
| Developer rate / hour | $60.00 |
| Time saved (general productivity) per dev per month | 4 hours |
| Time saved (general productivity) entire team per year | 240 hours |
| Cost saved getting started / finding information / Year | $14,400.00 |
| Number of critical support incidents / year | 2 |
| Time saved for each critical support incident | 16 hours |
| Cost saved for critical support incidents | $1,920.00 |
| Number of minor support incidents / year | 10 |
| Time saved for each minor support incident | 4 hours |
| Cost saved for minor support incidents | $2,400.00 |
| Single SciChart License Cost | $1099 |
| Multi-Purchase Discount | 30.00% |
| Cost of 5x SciChart Licenses for your team | -$3,846.50 |
| Total productivity costs saved | $18,720.00 |
| ROI ($) | $14,873.50 |
| ROI (%) | 387% |
Table 3: Estimated cost savings for a 5-developer team using SciChart
Of course, cost savings depend on many factors and the above doesn’t include the time you will spend learning the SciChart API, however we believe it will be quicker to learn SciChart than an alternative charting API.
Download the ROI Calculator here as an Excel Spreadsheet if you want to play around with the numbers. We have included both single-developer licensing costs vs. ROI as well as site-license costs vs. ROI.
SciChart licensing costs decrease over time
Please note, SciChart is licensed as a perpetual license with royalty free redistribution rights (see Licensing FAQ) and a support and updates subscription. The subscription is not mandatory after 1-year – you can still use SciChart after the support subscription ends, but you won’t be able to access technical support or updates / bug fixes to the chart (see Renewals FAQ).
Our costs decrease over time as a 2nd year renewal of a support subscription costs just 50% of the 1st year. Your ROI for year two may be even greater.
Finally, you can, if you want, purchase the source-code to SciChart. If you want to modify it, then you have one of the main benefits of open source: ability to inspect, modify and develop the source-code of the chart control.
Best regards,
Andrew
[SciChart Team]
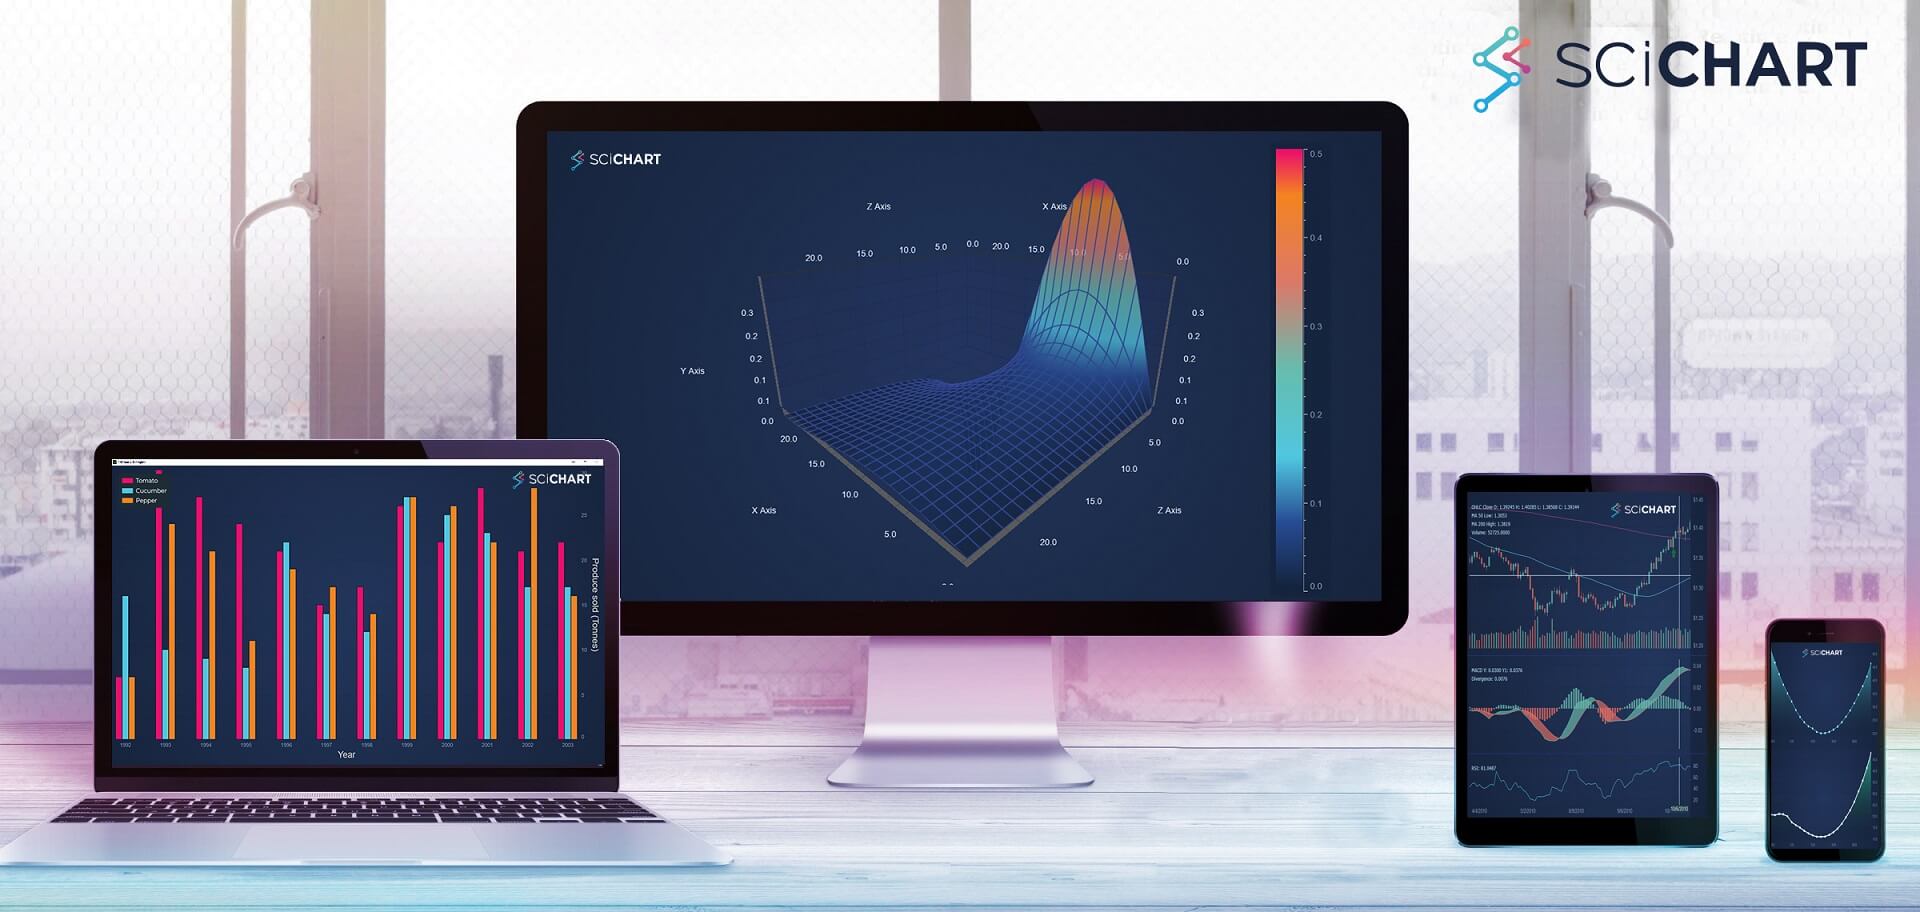
About SciChart: High Performance Realtime Charts.
SciChart provides high performance realtime chart components on the WPF (Windows), iOS, Android and Xamarin platforms. It is our goal to create the best cross-platform WPF, iOS & Android 2D & 3D charts in the world, focusing on performance, developer productivity, ease of use, depth of features and enterprise-grade tech support.
If you have a question about what SciChart can offer you, or if you would like to get a quote, please contact us. Our friendly, helpful support team will be glad to help!
Windows 7,8,10
WPF CHARTS

The World’s Best 2D & 3D WPF Chart with DirectX Hardware Acceleration and legendary tech support!
IOS (IPAD/IPHONE)
iOS
CHARTS

The World’s Fastest iOS Chart! designed for engineering, scientific, medical and trading apps.
ANDROID (TABLET/PHONE)
ANDROID CHARTS
The World’s Fastest Android Chart! designed for embedded systems, scientific, medical & trading apps.
