Pre loader
Try wave

Impress Your Clients With the Best JavaScript Chart Library

Unlock new data insights in ways you never thought possible with our award-winning JavaScript Chart Library.

Cross-platform access, unlimited flexibility and incredible big data performance help accelerate application development and unlock new possibilities.

From F1 teams to J.P. Morgan, leading enterprises and organizations use our software for their JavaScript data visualizations.

When it comes to JavaScript charts, SciChart.js has no comparative. With our charts, you can redefine what’s possible and impress your most ambitious clients.

Getting started is easy. With our FREE community edition, you can access 100s of demos and detailed documentation with live code samples.

View DemosWhy Choose SciChart


What Sets SciChart.js Above The Rest

Introducing the fastest, most flexible, dynamic charts for JS, perfect for projects that need extreme performance and slick interactive data visualizations. These charts are designed with scientific, medical, and financial apps in mind, so they have all the functionality that you need.

SciChart.js is built on top of our award-winning graphics engine and cross-compiled to WebAssembly and WebGL, with full TypeScript support.

  • Works with all your favorite JavaScript frameworks, such as React, Vue, and Angular.
  • True cross-platform experience (JavaScript, iOS/Android and WPF).
  • Over 80 performance demos, showcases and examples.
  • Load one million points without slowdown.
  • Unrivalled levels of flexibility and customizations.
  • Thousands of documentation and tutorials.
  • Developers receive the support they need to get the job done in a fraction of the time.

View our range of interactive JavaScript chart demos online.

Featured Imgae

Extensive JS Chart Features
For Enterprise Apps

SciChart.js features go deeper than any other JavaScript Chart Library with an open API that allows customizing everything. Read more about JavaScript graphs below:

2D JavaScript Chart Library

3D JavaScript Chart Library

Performance & Dynamic Updates

Annotations & Markers

Series & Datapoint Selection

Zooming Panning & interactions

Animations

Styling & Theming

Accessibility

Retina Support & DPI

Filters & Data Transformations

JSON API

Axis Layout

Axis Types & Axis Label Customisation

Chart Grouping & Layout

Misc APIs & Extensions

Documentation & Help

2D Chart Types

SciChart.js supports over 20 JavaScript graph types (Renderable Series) out of the box.You can mix, match and combine hundreds of series of different types on the same chart, e.g. put columns behind a line, or add a mountain chart with OHLC and more.

SciChart.js series support individual styling, animation, selection, and tooltips. The series API allows custom rendering for infinite configurability in JavaScript chart applications and JavaScript chart library.

Our JavaScript 2D Chart Types include:

3D Chart Types

Level-up your 3D data visualization with JavaScript and SciChart.js. Our software offers 3D point clouds, 3D scatters and 3D surface mesh chart types out of the box. But this is only a fraction of what is possible with our 3D graphics engine.

SciChart’s JavaScript 3D Charts Library offers a comprehensive set of features, including the 3D world dimension, camera, axes, and interactions.

This allows the creation of demanding 3D visualizations, like LiDAR 3D Point Cloud of Geospatial Data.


Our JavaScript 3D Chart Types include:

Performance & Dynamic Updates

SciChart’s JavaScript Chart Library is built for products where visualization is mission-critical.

SciChart’s performance is enabled by our proprietary, award-winning WebGL & WebAssembly rendering engine.

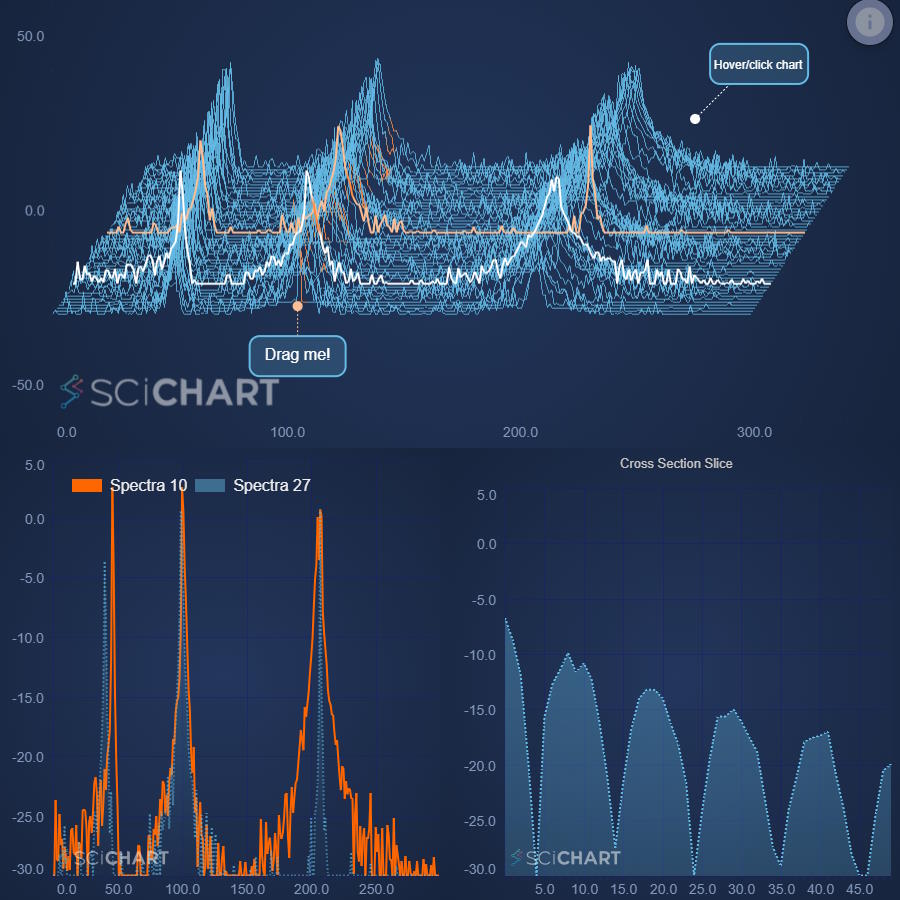
Our JavaScript chart library allows you to see more data at once, and to have dynamic updating charts with rich interactions. You can create JavaScript or TypeScript apps that plot many millions of data points, or thousands of chart series and still allow users to zoom, pan, and update interactively. This allows you to make informative decisions based on accurate data displays.

SciChart.js is a JavaScript graph library that enables big data visualizations that were not possible before.


Key Performance Features

  • Optimised data structures for big-data
  • Dynamic data updates
  • WebGL Graphics support
  • 100s of Charts at once
  • 1000s of series at once
  • 10s of Millions of datapoints
  • Tag xy points with custom objects, so you can show metadata on the point
  • Reactive JavaScript charts, which redraws a chart on property change, so the chart automatically updates


Add objects and shapes onto the chart

SciChart.js is a JavaScript graph library that supports a rich Annotations API allowing you to place Text, Labels, Boxes, Lines, Arrows, custom shapes and custom markers over the chart.

Place annotations at specific X, Y locations. These will zoom and pan with the chart. Or, place annotations at relative / absolute coordinates to highlight a region of the chart, shade the background, place watermarks and more.

Annotations are editable and interactable allowing for draggable thresholds, areas of interest or timestamps.

SciChart.js v2.3. introduces native text that gives text annotations another performance boost to our JavaScript charts.

Key annotations types

  • Lines on chart
  • Boxes on chart
  • Text on chart
  • SVG on chart
  • Custom shapes on chart
  • Markers on Axis
  • Highlight regions on the chart
  • Position Annotations via Xy data
  • Position Annotations via pixel coord
  • Native text for text annotations (coming soon in v2.3)


Series & Datapoint Selection

SciChart’s JavaScript Chart Library features series and datapoint selection on click and hover events.

You can get notified when users click on a data point or series by events and callbacks. You can use it to style a selected element differently, like make it change color, or drill down a chart, making your app interactive.

Selection is enabled by Hit-Test API, which returns detailed information on the selected item including metadata.

Hit-Test is flexible and can be done on a radius around the point, vertical slice, or an area. It is already used to show tooltips and rollovers.

Selection

  • Select series
  • Select datapoint
  • Hover series
  • Hover datapoint
  • Click (Hit-Test) API
  • Hover (Hit-Test) API


Zooming, Panning & Interactions

With our JavaScript Chart Library, you can add zooming, panning, axis zoom, and pan, rollovers and crosshairs, tooltips and legend, and more to build truly interactive charts.

Interactions are customizable with ChartModifiers API and Hit-Test.

You can override mouse clicks or gestures to use the keyboard, apply zooming in one direction only (x or y), and enable/disable series from the legend. You can add a scrollable chart overview control to see a bird’s eye view and move fast to another part of the chart.

You also have control over what data to show in the tooltip, and more.

With our JavaScript graph library you have control over what data to show in the tooltip and more.

  • Zoom and pan with the mouse wheel
  • Drag to Zoom (rubberband zoom)
  • Drag to Pan
  • Pinch to zoom
  • Pan by the Axis
  • Axis scale
  • Interactions via keyboard
  • Scrollbar / Overview control
  • Tooltip
  • Crosshair
  • Legend


Animations

SciChart.js features a generic animation system which allows you to animate anything in the JavaScript graphs.

There are multiple types of animations out of the box to make your browser applications engaging.

You can animate chart on appearance, animate from one dataset to another, animate style, e.g. line/fill colour, thickness, and animate moving annotations.

You can also queue animations to create beautiful visuals for your data in our JavaScript charting library.


With our JavaScript charts you can animate all the things!

  • Animate data transitions
  • Animate style transitions
  • Animate hover state
  • Animate selected state
  • Animate chart series on load
  • Animate visible range changes
  • Generic animation


Styling & Theming

SciChart.js features several themes out of the box, including Light Theme and Dark Themes.

SciChart supports building Custom Themes either inheriting our own or completely bespoke. You can style every element of a chart. Our JavaScript charts support transparent background, image background, and blurred or glass effect background.

SciChart.js provides a PaletteProvider API, that allows per-point coloring of a series based on data value or a rule. You can make a line to be red where its values are over 10. Or you can color volume bars in a stock chart red or green based on up or down with dynamic updates.

Style SciChart JavaScript graphs to fit your application design guides, make your apps accessible and delight your users!


Style SciChart’s JavaScript chart library to fit your application design guides, make your apps accessible and delight your users!

  • Style series in code
  • Style labels in code
  • Style chart parts in code
  • Create a re-usable theme
  • Dashed line styling
  • Image behind chart
  • DOM behind chart (DOM – HTML – transparent background chart)
  • Theme loader/startup animation
  • PaletteProvider API for a per-point coloring


Accessibility

We’ve built Accessibility hooks into SciChart.js making it suitable for enterprise-grade applications and allowing the creation of JavaScript charts according to WCAG guidelines.

We allow you to create charts that are perceivable, operable, and understandable.


Accessibility features include Voiceover (text to speech for chart parts), Theming, Scaling of fonts with Browser zoom and DPI for resizable text, color and contrast customizations, and keyboard interaction on the chart.

  • Voiceover hooks
  • Resizable text
  • Keyboard accessibility hooks
  • Color, texture and Contrast options


Retina Support & DPI

Scichart.js natively supports rendering on high-resolution Retina screens, as well as Browser zoom functionality.

This allows you to have high-quality sharp graphics when zoomed in closely. The chart’s quality will update dynamically.


Every element is now rendered at the native resolution and scaled down for display, offering the benefits of:

  • Lines, strokes, and shapes look sharper and clearer on higher DPI displays or when the browser is zoomed.
  • Text is rendered at a higher resolution.
  • Text scales with browser zoom (used for Accessibility)
  • Stroke thickness (line pen) increases with Browser
  • Zoom
  • Macbook Retina support
  • Windows high DPI support
  • Browser zoom support


Filters & Data Transformations

Our Filters or Data transformations API allows you to operate or manipulate data before displaying it, so when you update the data to your original dataset it will be transformed automatically in real-time on a chart.

Use the Filters API to add moving averages and linear trendlines to the charts. You can also add smoothing filters or polynomial functions. You can scale or offset a series, or calculate a ratio between two series.


You can create your own custom filters to transform your data on the fly.

  • Scale & Offset a series/charts (linear transformation)
  • Linear trendlines
  • Moving averages
  • Ratio (series A / B)
  • Spline Interpolation
  • Custom functions – can be anything from filters to aggregations


JSON API

If you have used SciChart for other platforms before, you will be familiar with our object-based API. New to SciChart JavaScript – we have also included a JSON Builder API, which will be much more familiar to developers used to JavaScript chart libraries.

The Builder API allows you to create chart definitions with JSON or JavaScript objects. It is an easy way to define your charts on the server, or in a re-usable React component and share them throughout your app.

Everything is JSON serializable, so you can create entire chart definitions server-side. You can save and load/reuse a chart from its definition. This allows creating dynamic apps.


You can mix and match with the other API.

  • Create charts via code or JSON
  • Serialize charts to JSON
  • Define chart definitions in JSON


Axis Layout

Our JavaScript Charting Software supports unlimited X and Y Axes on a chart.

You can place multiple X axes right and left, Y axes top and bottom, and both in the center. SciChart.js allows you to add vertically and horizontally stacked X and Y axes. A feature often used in medicine to display vital signs stacked one on top of the other.

You can scale series and axis independently. Everything to help you present your data in the most descriptive way.

SciChart.js supports vertical or rotated charts. Set a Y-Axis alignment to the left, and X-Axis alignment to the top, and this will rotate a chart 90 degrees. A feature is popular for Oil and Gas applications.

All the zooming and panning will be vertical. You can scroll the chart vertically, and use tooltips, legends, and other interactions.


Axis Layout Options:

  • Multiple X and Y axes
  • X-Axis on top/bottom of the chart
  • Y-Axis on the left/right of the chart
  • Rotate chart (vertical chart)
  • Stack axis on the chart
  • Axis inside chart
  • Axis outside chart
  • Axis central to chart


Axis & Label Customisations

Our JavaScript Charting Library features multiple axis types out of the box, including a Numeric Axis, Logarithmic Axis, and a Category Axis, which is often used for Stock Charts. The category axis plots each Y value evenly spaced on the x-axis, e.g. you can place types of fruits on the axis.

SciChart.js allows customizing all parts of the axes: axis title, axis borders, position, and background.

You have control over axis label formatting, which can be set to dates, numbers, strings (text), or images. You can rotate axis labels and have multiple lines in them.

Scichart.js allows you full control of where the labels and chart gridlines (bands) are placed. It can disregard the data on the axis and be placed anywhere using the tick provider.

SciChart.js v2.3. introduces native text in axis labels which is another boost for the performance.


Axis Types:

  • Numeric linear axis
  • Logarithmic Axis
  • Date Axis
  • Category Axis

Customisations:

  • Axis titles
  • Axis Label formatting (number, date, text, image)
  • Axis gridline (bands) spacing
  • Axis gridline (bands) visibility
  • Axis tick visibility
  • Axis borders & Backgrounds
  • Rotated axis labels
  • Native text for axis labels (from v.2.3.)


Chart Grouping & Layout

With SciChart.js, you can link multiple charts. You can add sub-charts, and have a chart within a chart. You can even place a chart inside the axis or a tooltip.

Synchronize interactions across charts and sub-charts, like Zooming and Panning. Have a single tooltip shared across charts. Create multi-pane stock charts with technical indicators.

Our JavaScript charts supports vertical or rotated charts, with vertical interactions like zooming and panning, cursors, and rollovers.


The code for these charts is easy to write as it can run every time the visible range changes and update everything accordingly.

  • Link Multiple Charts
  • Rotate Charts Vertically
  • Synchronized interactions
  • Subcharts and chart groups (from v.2.3)


Misc APIs and Extensions

SciChart.js has a loaf of API hooks allowing you to extend, customize or otherwise bend the chart control to your will:

ChartModifier API:

Allows creating different custom behaviours, like custom zooming panning, and custom tooltip actions.

Axis Text Formatting / LabelProvider API:

Allows changing the text formatting, also changing the axis labels into custom labels e.g. strings, prefix, suffix, scientific notation, label rotation, image labels, and more.

PaletteProvider API:

Allows per point coloring of a series based on data value or a rule.

You can make a line to be red where its values are over 10. Or you can colour volume bars in a stock chart red or green based on up or down with dynamic updates.

Builder API:

Define a chart definition as a JavaScript object or JSON and share it across screens. Create client/server apps by defining the chart server-side and displaying on the client


Build with:

  • custom zoom/pan modifiers
  • custom label formatters
  • custom gridline intervals
  • custom filters/transforms
  • custom per-point coloring rules


Documentation & Help

SciChart.js is designed for ease of use. We’ve included sets of video tutorials, over 40 code examples with the source code, and hundreds of documentation pages to ensure that you can get to work with minimum time.

Our developers, the same who wrote the library, are running the forum that is free to trial customers, and provide help via tickets to our paid customers.


Resources: 

  • Getting started guides
  • 40 examples with the source code
  • 100s of documentation pages
  • Typedoc for the entire library
  • Boilerplate demos for popular frameworks (React, Vue, Angular)
  • Video Tutorials for npm developers
  • Tutorials for vanilla JS devs
  • Community forums
  • Support desk for premium customers
View All JS Chart Features at a Glance

Select below to see our 100s of features

3D JavaScript Chart Library
Performance & Dynamic Updates

Key Performance Features

  • Optimised data structures for big-data
  • Dynamic data updates
  • WebGL Graphics support
  • 100s of Charts at once
  • 1000s of series at once
  • 10s of Millions of datapoints
  • Tag xy points with custom objects, so you can show metadata on the point
  • Reactive JavaScript charts, which redraws a chart on property change, so the chart automatically updates


Annotations & Markers

Key annotations types

  • Lines on chart
  • Boxes on chart
  • Text on chart
  • SVG on chart
  • Custom shapes on chart
  • Markers on Axis
  • Highlight regions on the chart
  • Position Annotations via Xy data
  • Position Annotations via pixel coord
  • Native text for text annotations (coming soon in v2.3)


Series & Datapoint Selection

Selection

  • Select series
  • Select datapoint
  • Hover series
  • Hover datapoint
  • Click (Hit-Test) API
  • Hover (Hit-Test) API


Zooming Panning & interactions

With our JavaScript graph library you have control over what data to show in the tooltip and more.

  • Zoom and pan with the mouse wheel
  • Drag to Zoom (rubberband zoom)
  • Drag to Pan
  • Pinch to zoom
  • Pan by the Axis
  • Axis scale
  • Interactions via keyboard
  • Scrollbar / Overview control
  • Tooltip
  • Crosshair
  • Legend


Animations

With our JavaScript charts you can animate all the things!

  • Animate data transitions
  • Animate style transitions
  • Animate hover state
  • Animate selected state
  • Animate chart series on load
  • Animate visible range changes
  • Generic animation


Styling & Theming

Style SciChart’s JavaScript chart library to fit your application design guides, make your apps accessible and delight your users!

  • Style series in code
  • Style labels in code
  • Style chart parts in code
  • Create a re-usable theme
  • Dashed line styling
  • Image behind chart
  • DOM behind chart (DOM – HTML – transparent background chart)
  • Theme loader/startup animation
  • PaletteProvider API for a per-point coloring


Accessibility

Accessibility features include Voiceover (text to speech for chart parts), Theming, Scaling of fonts with Browser zoom and DPI for resizable text, color and contrast customizations, and keyboard interaction on the chart.

  • Voiceover hooks
  • Resizable text
  • Keyboard accessibility hooks
  • Color, texture and Contrast options


Retina Support & DPI

Every element is now rendered at the native resolution and scaled down for display, offering the benefits of:

  • Lines, strokes, and shapes look sharper and clearer on higher DPI displays or when the browser is zoomed.
  • Text is rendered at a higher resolution.
  • Text scales with browser zoom (used for Accessibility)
  • Stroke thickness (line pen) increases with Browser
  • Zoom
  • Macbook Retina support
  • Windows high DPI support
  • Browser zoom support


Filters & Data Transformations

You can create your own custom filters to transform your data on the fly.

  • Scale & Offset a series/charts (linear transformation)
  • Linear trendlines
  • Moving averages
  • Ratio (series A / B)
  • Spline Interpolation
  • Custom functions – can be anything from filters to aggregations


JSON API

You can mix and match with the other API.

  • Create charts via code or JSON
  • Serialize charts to JSON
  • Define chart definitions in JSON


Axis Layout

Axis Layout Options:

  • Multiple X and Y axes
  • X-Axis on top/bottom of the chart
  • Y-Axis on the left/right of the chart
  • Rotate chart (vertical chart)
  • Stack axis on the chart
  • Axis inside chart
  • Axis outside chart
  • Axis central to chart


Axis Types & Axis Label Customisation

Axis Types:

  • Numeric linear axis
  • Logarithmic Axis
  • Date Axis
  • Category Axis

Customisations:

  • Axis titles
  • Axis Label formatting (number, date, text, image)
  • Axis gridline (bands) spacing
  • Axis gridline (bands) visibility
  • Axis tick visibility
  • Axis borders & Backgrounds
  • Rotated axis labels
  • Native text for axis labels (from v.2.3.)


Chart Grouping & Layout

The code for these charts is easy to write as it can run every time the visible range changes and update everything accordingly.

  • Link Multiple Charts
  • Rotate Charts Vertically
  • Synchronized interactions
  • Subcharts and chart groups (from v.2.3)


Misc APIs & Extensions

Build with:

  • custom zoom/pan modifiers
  • custom label formatters
  • custom gridline intervals
  • custom filters/transforms
  • custom per-point coloring rules


Documentation & Help

Resources: 

  • Getting started guides
  • 40 examples with the source code
  • 100s of documentation pages
  • Typedoc for the entire library
  • Boilerplate demos for popular frameworks (React, Vue, Angular)
  • Video Tutorials for npm developers
  • Tutorials for vanilla JS devs
  • Community forums
  • Support desk for premium customers

SciChart.js
Editions

Community
  • Free for unlimited non-commercial use
  • Limited time commercial trial
  • Ongoing tech support not included
  • Watermark visible on all features
2D/3D Pro
  • 2D/3D charts
  • Licensed for web applications, electron and SSAS applications
  • Licensed for commercial use
  • Includes top-rated technical support
Cross Platform
  • Cross platform editions available
  • Native Windows, IOS, Android and JS
  • OEM deployments available (Kiosks, scientific, instruments etc)

Ready to get started?

Choose your licence and you’re good to go. If you’re a commecial enterprise and need
help choosing the right product, you can always speak to our team for advice.

Get started

Testimonials & Reviews

star starstarstarstarstar 4.84 Average - 419 Reviews

Award Winning Software, Continually rated Best, with hundreds of 5-Star Reviews

Find out why our customers rate us as one of the best JavaScript Chart Libraries.

quote
Steven I
star
star
star
star
star
Without doubt, the best charting library I have ever used. The examples suite is comprehensive to easily get you started coding on a new project. The sales & technical support staff are always responsible and eager to help. Chart customisation is extensive and rendering speed is quick.
quote
Chris Kirkman
star
star
star
star
star
This is an incredible product. First it's the best chart I've had customers compliment how great the charting parts of our application look/behave. I couldn't recommend this product anymore than I already do. SciChart really hit the mark. I wish all software products could be this easy to use and be so productive (not to mention blazing fast).
quote
Mete Alinc
star
star
star
star
star
This is a wonderful tool for developers who need highly customizable and fast charting in 2D or 3D. I did a comprehensive market research in terms of what kind of charting I have to use for a commercial app. I've come to the conclusion that SciChart is simply the best charting framework out there meeting our needs. Keep up the good and quality work!
quote
Jack L
star
star
star
star
star
SciChart has always provided timely and expert support for an already superb product. The WPF charting solution is at the heart of our user interface. We are an extremely satisfied, long term customer.

Got any questions?

Want to find out more about using our charts for commercial use? Wether you’re contacting as an enterprise
or a small start-up, our technical sales team are on hand to support you with all your pre-sales enquiries.

Get In Touch

Try SciChart Today

Start a trial and discover why we are the choice
of demanding developers worldwide

Get Started Free TodayView Demo