Build World-Class Apps with SciChart’s Financial Charting Library
From Sparklines to Full Trading Platforms, SciChart is Your All-in-One Financial Charting Library
SciChart.js handles the full spectrum of financial charting: simple, lightweight components for retail banking interfaces all the way to complex, real-time trading platforms. Our platform helps you to reduce runaway engineering costs, performance complaints at scale, and avoid compliance surprises.
- Support multi-pane layouts and technical indicators
- Cross-platform across JavaScript, iOS/Android, and WPF
- Trade-through-chart interactions
- Drawing tools as standard
- Reduce time-to-market
- White-label your apps
Trusted By Industry Leaders
Trusted by J.P. Morgan, Barclays, NatWest, Bithumb and Deribit, SciChart is built to meet the performance, accessibility and compliance standards the world’s most demanding financial institutions require.


No More Building Your Trading & Finance Apps from Scratch
Previously, you may have relied on building your own trading apps from scratch, or on tools that have watermarks unless you pay eye-watering prices to have them removed. Perhaps you had to hire specialist developers or invest in significant amounts of custom work?
High engineering cost for trading features doesn’t have to be the norm. Neither do you need to compromise on features.
With SciChart, you can apply all the indicators, drawing tools, multi-chart layouts and trading interactions that your users would expect.
The catch? There is no catch. We are cheaper than TradingView and give you all the configurations and watermark-free charts you need to satisfy your users and get your application to market faster.
When TradingView Isn’t Enough
TradingView has plenty of features for financial apps, but it has its limitations. It’s a JavaScript only plugin, meaning you can’t create native mobile apps. White-labeling your charts is also more difficult (and less affordable) than other financial charting software.
An award-winning binary options trading app, used by almost a million active traders daily, is powered by SciChart. Being able to completely customize the chart, white-label it into the app and provide their simple but bespoke trade-through-chart mechanism resulted in this firm winning awards and achieving a 5-star rating on the Google Play Store.
Achieve Flawless UX & Performance (Even with Large Datasets)
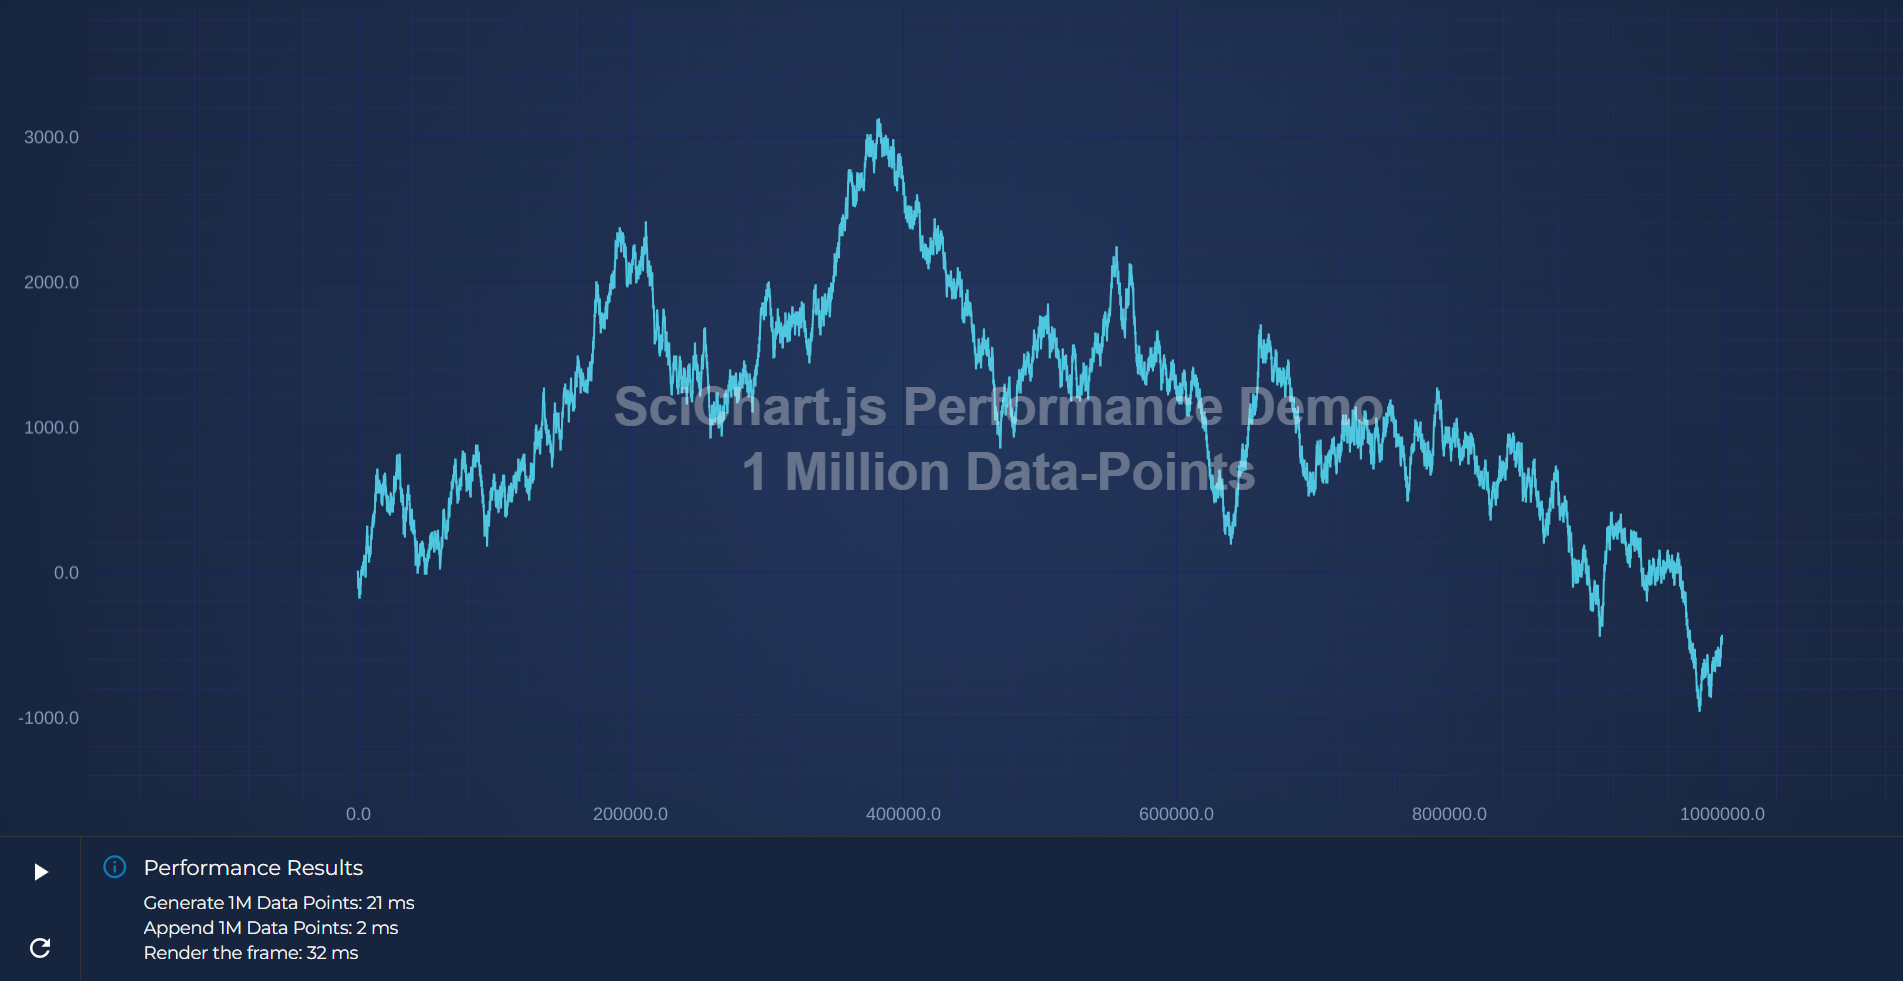
With the world’s most advanced tech-stack for financial chart libraries, SciChart’s innovative Visual Xccelerator™ graphics engine leverages full GPU hardware acceleration (WebGL, Metal, OpenGL, DirectX) allowing you to plot millions of data points.
Have previous solutions been too slow, or has performance been a complaint from your user base? If so, you need a faster chart library.
With SciChart, you won’t experience slowdown or lag with large datasets. This applies not only to candlestick and trading charts but also to financial analytics or risk management applications where years of market data may need to be visualized and interpreted by users.

Charts for Retail & Investment Banking Apps
Across the investment banking sector, SciChart is used by NatWest Capital Markets, Barclays Capital, JPM, Citigroup, Bank of America and more.
SciChart transforms dense, complex financial data into interactive and easily digestible visual insights for millions of everyday users.
Leveraging our hardware-accelerated graphics engine, mobile banking apps can render the largest of datasets, such as years of granular transaction histories, personal spending habits, and localized currency exchange fluctuations.
This is all completely lag-free across multiple generations of smartphones.
By handling demanding visual updates without draining device performance, SciChart allows retail banks to provide a seamless experience that helps consumers interpret their financial health at a glance.

Accessibility Requirements Built Specifically for J.P. Morgan
J.P. Morgan uses SciChart across their entire retail banking sector, including applications for high net-worth customers.
They selected SciChart for mobile (iOS/Android), which is the only commercially available cross-platform chart library.
SciChart’s support for accessibility was among the reasons for their choice, as well as its performance, reliability and rendering capabilities.
Choose One of the Best Chart Libraries for Cryptocurrency Trading Platforms
SciChart manages the extreme, high-frequency data streams characteristic of 24/7 crypto markets without stuttering or crashing.
As crypto order books, volume indicators, and price feeds refresh simultaneously, standard charting libraries often throttle device performance.
SciChart resolves this by shifting the heavy math to the hardware. This enables mobile and web crypto apps to fluidly display multi-pane layouts packed with live technical indicators or interactive depth charts.
By maintaining a responsive UI, even during market volatility, SciChart ensures active traders can execute split-second decisions with precise, up-to-the-millisecond visual data.
This is why major global platforms, including Bithumb and Deribit, use SciChart’s native, GPU-accelerated engine to seamlessly render millions of data points.

South Korea’s Largest Crypto Exchanges Powered by SciChart
Bithumb is one of South Korea’s largest cryptocurrency exchanges, with 2.25 million mobile traders (25% of South Korea’s entire crypto trading market).
With active traders needing access to reliable, real-time market data, Bithumb required a charting engine that could remain stable and responsive during active periods – even on mobile.
With SciChart, Bithumb sustains reliable big-data performance for their financial and trading charts. They also have deep customization to fine-tune chart layouts, indicator logic, and interaction behavior for active traders.

Tried & Tested by the Leading Stock Exchanges
We’re the charting software of choice for leading derivative and stock exchanges.
- Deribit, a crypto derivative exchange, leverages SciChart for options profit calculation.
- Refinitiv, formerly Thomson Reuters, uses SciChart in the Eikon application – a competitor of Bloomberg.
All of these have in common a need for high-performance, flexible and configurable chart components.

A Platform that has Your Compliance & Cybersecurity Covered
Secure and compliant by design, SciChart is built for trading platforms, banks, and financial firms where performance, data protection, and regulatory confidence matter from the first conversation.
Procurement and legal sign-off often depends on cybersecurity and compliance being addressed early, especially for sensitive and confidential big data projects.
SciChart supports compliance considerations for global regulations, including GDPR, MiFID II, and SOX.
Finance & Trading Case Studies
See how leading institutions, such as Commerzbank, have delivered premium UI/UX features using SciChart’s financial charting library. SciChart’s trading and financial charting library is used by investment banks, hedge funds, trading apps and CFD/crypto brokers to create high-performance interactive charts.
“Honestly one of those libraries that just gets out of your way. Performance with large datasets is genuinely impressive — smooth and responsive without any tricks or workarounds. The API clicked quickly and the docs are actually good, which is rarer than it should be. Every chart type I've needed has been there, and the visual quality is great. Hard to imagine reaching for anything else at this point.” Christian L
See the Difference with SciChart
Try SciChart’s financial charting library to see the difference it could make when building your finance and trading apps.
Examples, Demos & Features
We have all the production-ready financial demos and tools you need. Chart types out of the box include candlestick, OHLC, and mountain (area). Our prebuilt financial annotations and editable interactions remove the need for custom engineering.

From Static Drawings to Editable Annotations
With our dedicated financial drawing tools extension and composite annotations you can create:
- Channel annotations (parallel, disjoint, flat-bottom)
- Trendlines / extended lines
- Fibonacci retracement
- Pitchfork and pitchfan
- Measurement tools
- Stop-loss / take-profit zones
These features transform your current static drawings into interactive, multi-point, editable annotations.
Framework-Level Extensibility for Trading Interactions
Our annotation and modifier system supports:
- Multi-point editing logic
- Runtime editing panels / modifiers
- Integration with renderable series and annotations
These features are delivered as an extension layer on top of core SciChart.js.
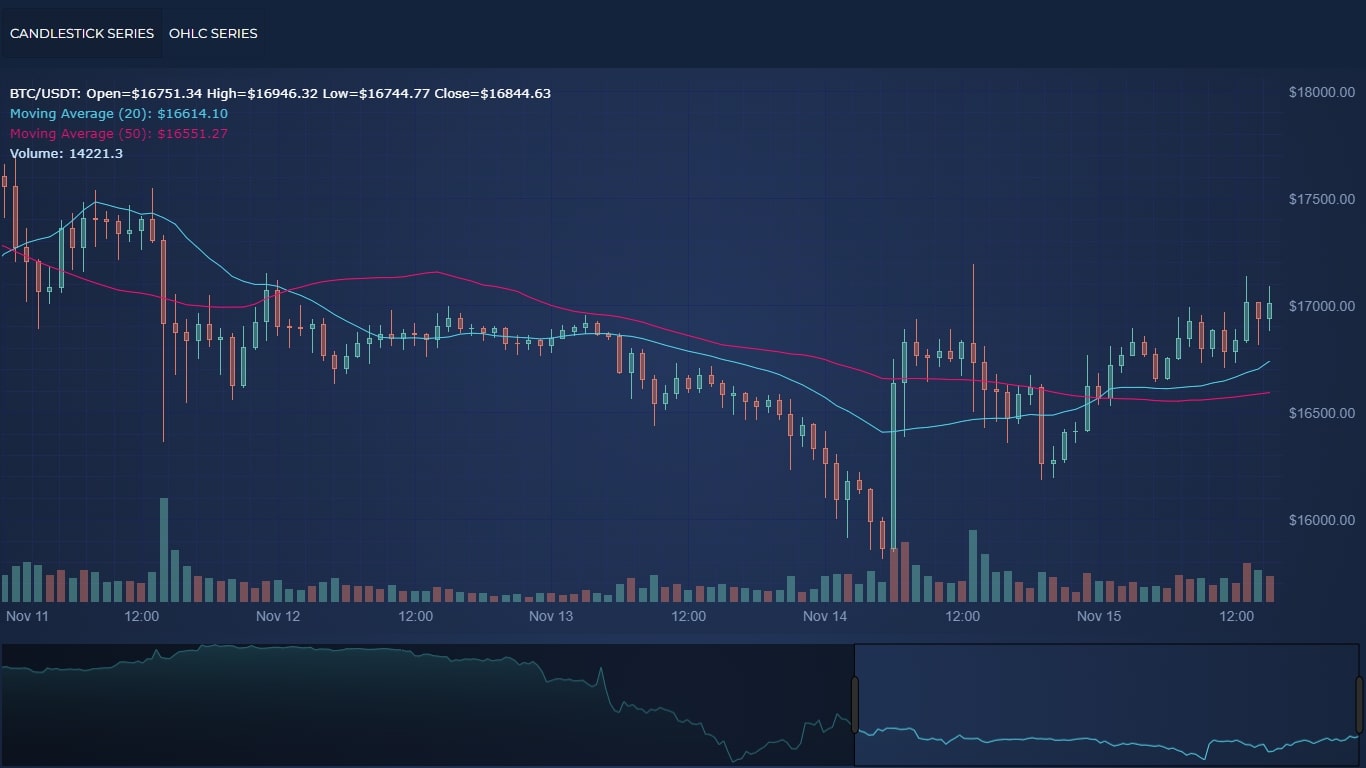
Candlestick Chart Demo
Try SciChart’s JavaScript candlestick chart demo to visualize the entire history of Bitcoin in 1-minute.
- Display a comprehensive view of market trends
- Receive full control over the chart’s configuration
- Add moving averages and volume bars
- View interactive modifiers, including zooming, panning and dynamic color fills
- Toggle between a candlestick and OHLC view

OHLC Chart Demo
Try SciChart’s OHLC chart demo – ideal for stock trading applications and financial data analysis.
- Handles non-contiguous stock market dates
- Displays financial values with precise formatting
- Adds animations to the chart for visual appeal
- Seamlessly zooms and pans
- Keeps large datasets responsive
Why Do Finance & Trading Organizations Choose SciChart?
Take a look at the chart performance you can achieve with SciChart and how our extensive charting features contribute to fully customizable charts.

Chart Performance
- Zero memory growth
- GPU-accelerated
- WebAssembly-powered
- Sub-millisecond interactivity even on larger datasets
- 2.3MB bundle size
- Float64 array and FIFO mode for enhanced data efficiency
- Cross-platform performance across JavaScript, WPF/.NET, and iOS/Android
- Continuous streaming
- Deterministic rendering
- Visualize 100 M+ points per dataset
- Continuous 24/7 operation
- Sustain 200k points per second
- Refresh 64+ charts in under one second
- Embeddable within MES, YMS, and ATE systems
- Direct integration into React, Angular, and Vue
Extensive Charting Features
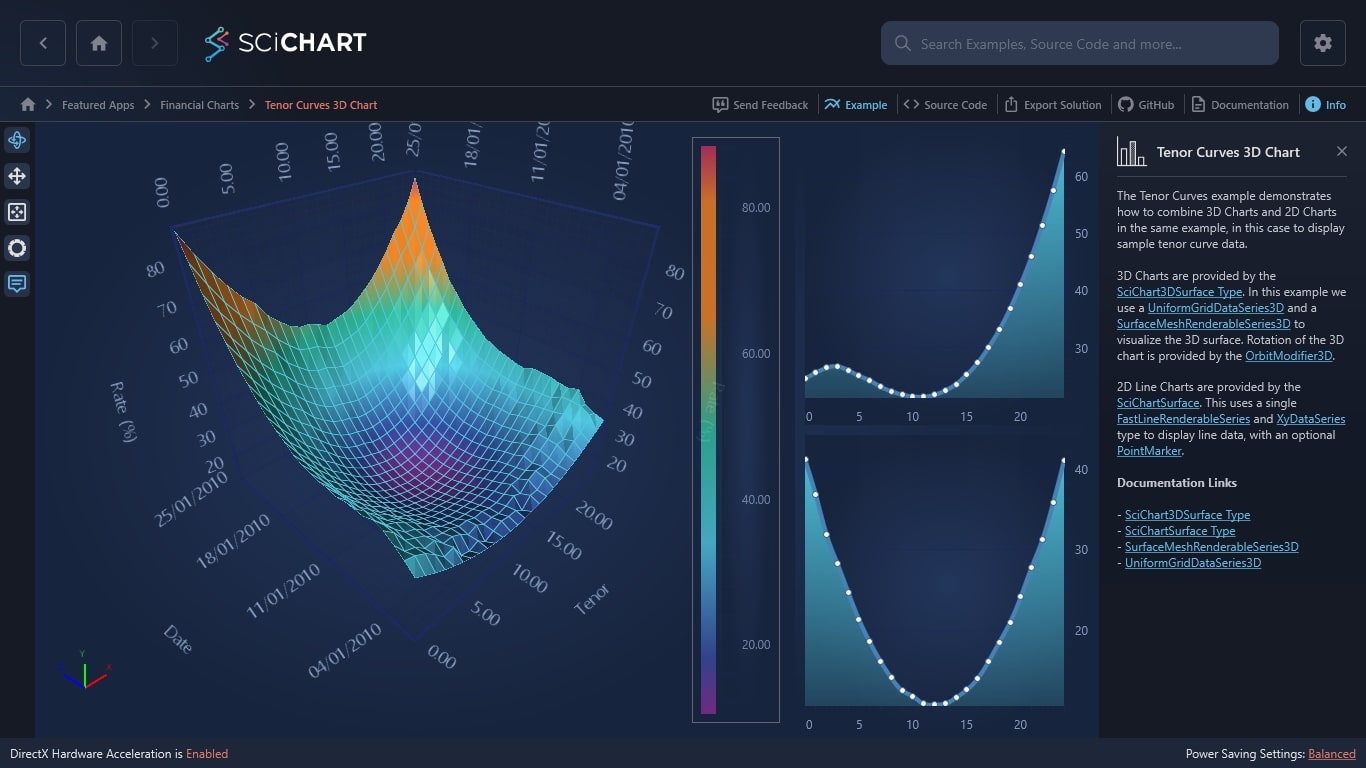
- 2D & 3D plotting
- Animation of data
- Annotations on chart
- Zoom & pan
- Tooltips
- Touch interaction
- Link multiple charts
- Legend customization
- Logarithmic axis
- Multiple Y-Axis
- Per-point coloring
- Programmatically change viewport
- Theme or template customization
5-Star Support for Finance & Trading App Developers
See the level of support developers get when building real-time chart solutions. The support, features and performance we offer helps our customers build top-rated apps for trading and investment management.
 Responsive 5-Star Technical Support
With our 5-star technical support subscription, we aim to answer all support tickets within one business day* and often even faster.
 Get Answers Fast with our AI Assistant
Ask our AI Assistant anything about SciChart and it will answer your questions fast!
 Knowledgeable Support Forums
With nearly 4000 answered support requests on our public support forum, you’ll never be left without an answer.
 Extensive Documentation
1000s of pages of support documentation across all platforms for expert guidance on getting the most from SciChart.
 Tutorials & Videos
Our regularly updated YouTube channel will help you understand what’s possible and answers the most commonly asked questions.
 Hundreds of Example Charts
Over 350 chart examples will get you what you need to get out of the blocks more quickly.
Testimonials & Reviews
Award Winning Software – Continually Rated Best with Hundreds of 5-Star Reviews
With a rating of 4.8, SciChart is one of the highest rated chart libraries in the world*, used by over 10,000 expert developers worldwide.
Read All Reviews