Pre loader
Try wave

Best WPF Chart Library for Real-Time Data Visualization

Why Choose SciChart?

Are you considering SciChart vs. one of our competitors or an open-source WPF chart component? If so, you’ll want to know what SciChart can offer that competitors don’t. Find out why we’re considered by thousands of users to be the best WPF chart library on the market today.

Start Trial TodaySee Features

WPF Chart Audio Frequency Spectrum Analyzer

SciChart vs Mainstream Chart Libraries

Perhaps you’ve tried the mainstream chart libraries and they were fine up to a point. But then, performance becomes sluggish about a thousand data points or it takes ages to get the technical support you need. With SciChart’s GPU-accelerated rendering engine and responsive technical support, you can infinitely scale your big-data visualizations and apps. See how we compare to the mainstream competitors.

Your Experience with Mainstream Chart Libraries

  • CPU spikes and slow performance
  • Charts freeze with 10k points
  • Lack of technical support with open-source libraries
  • Lack of features for complex dashboard applications
  • Limited flexibility and customizability

Your Experience with SciChart

  • GPU-accelerated performance
  • 10M+ points without freezes
  • Enterprise-grade support when you need it
  • Unparalleled flexibility and Customization
  • Every feature you could ever want for complex charting apps


Render Billions of Points in Big-Data Apps

With Visual Xccelerator™ engine acceleration, smart and lossless data-point resampling and an optimized render pipeline, SciChart provides extremely fast WPF charts capable of drawing many millions of data points in real-time for candlestick charts, mountain (area) charts and more.

In performance benchmarks, we provide excellent performance numbers, but also in real-world applications you will get a responsive, fluid UI when you use SciChart’s WPF chart components.

Surpass Your Competitors

SciChart v9 SDK is able to draw billions of points in big data apps. The level of performance surpasses even our strongest competitors, making SciChart the world’s fastest big-data WPF chart component for complex, real-world applications.

quote
star
star
star
star
star
Great performance and low CPU load, even on high data transfer (~200.000 samples/second). Also very good and intuitive documentation!

Stefan K.

Intuitive, XAML / MVVM Friendly API

Being fast is great, but performance isn’t everything. What also matters is if your WPF chart control is intuitive, feature-rich and easy to use.

As a developer, you will find SciChart’s WPF Chart API intuitive and easy to use because it’s written as a WPF developer would expect.

Since 2012, we’ve been building one of the best graph libraries for WPF applications. Built by WPF developers, for WPF developers, we’ve focused on MVVM, XAML Declarative Markup, templating, attached properties and styles.

Read the tutorial below to see how easy it is to add a line series to SciChart with MVVM and XAML.

Read Tutorial

Reduce Time-to-Market With Excellent Developer Support  

Not only is our API intuitive and consistent, but since our WPF Chart Library is used by thousands of developers worldwide, there are now thousands of searchable forum questions, documentation pages and hundreds of online code examples on our website.

Your developers will be able to create the best WPF chart visualizations with SciChart’s chart library, while also building them quickly. Higher productivity will result in faster time to market, and less overall cost.

Get Started

Build Complex, Big-Data Charts

SciChart is at the forefront of hundreds of applications which require complex, big-data charts and visualizations to view data in a variety of ways.

Far more than a simple line chart, column chart, or scatter chart, SciChart allows you to:

Our depth of features is far beyond competitors and allows you to create complex, rich WPF chart applications.

Create Beautiful User Interfaces with Avalonia XPF

Avalonia XPF lets you create beautiful user interfaces with cross-platform support, including Windows and Linux. Your developers can build the charts, dashboards, and interfaces with popular coding languages, including C#.

Characterized by high levels of customization and seamless performance and consistency across platforms, it’s an intuitive choice for ambitious organizations looking to build on their data visualizations and stories.

With the addition of Avalonia XPF, you have all the essential features for cross-platform 2D and 3D charting in one place, supporting the accurate real-time performance you can always expect with SciChart.

Try Avalonia XPF

Get More From Your Chart Library

Our customers consistently rate us the best for documentation, tech support and examples, as well as features and performance.

We have invested thousands of hours developing a rich examples suite of the best WPF chart examples and hundreds of hand-written documentation pages, all searchable online.

What’s more, your developers will be able to access our top-rated technical support. Our forums search as you type, and if you have purchased priority support, you will often get a response on the same-day.

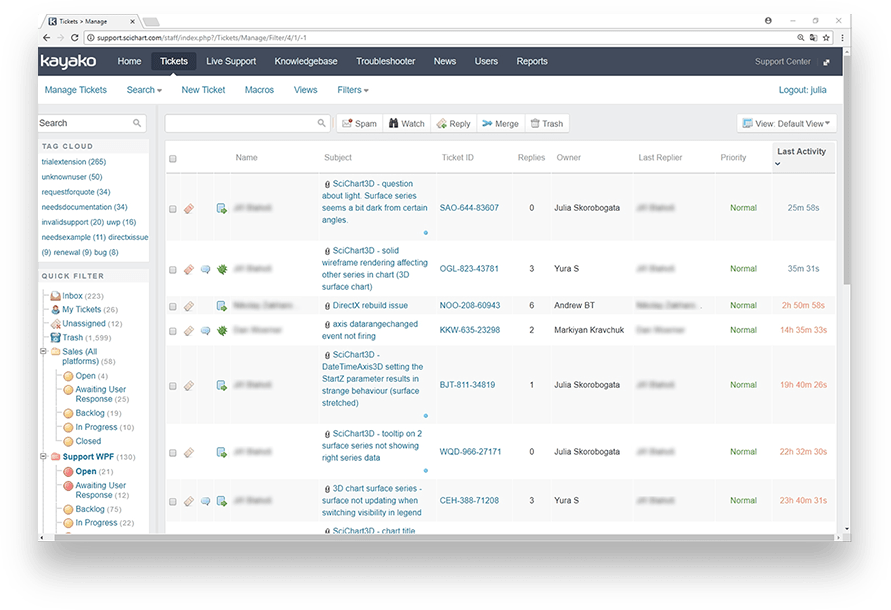
Get Technical Issues Resolved Quickly

For 10 years we have been actively developing our chart library to make charts faster, better and with richer features. Behind the scenes, we have a team who work hard to handle bugs and compatibility issues.

With SciChart, if you report a bug, you will get what you need to keep working quickly. This presents a huge value-add over our competitors and an even bigger value-add over open-source charts, which may have good features but won’t have the same level of development activity and support that SciChart has.

Because of our large user base, our software is tested regularly, and you can rest assured that issues, should they occur, will be fixed quickly.

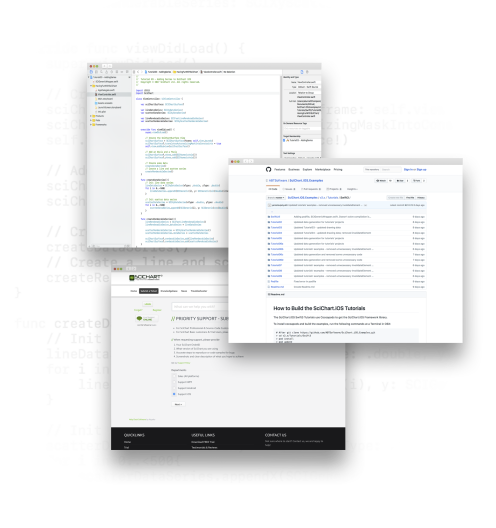
We’ve made major releases via our website, as well as hundreds of releases via our Nightly Build Feed, which publishes code to NuGet and GitHub.


Rated 5-Stars by Users

star starstarstarstarstar 4.9 Average - 425 Reviews
G2 starstarstarstar 4.7 Average - 9 Reviews
G2 starstarstarstar 4.4 Average - 4 Reviews

In a recent review campaign, we received hundreds of reviews from customers of SciChart, most of whom rated us 5-stars.

Customers say our charts are:

  • Blazing fast.
  • Extremely flexible.
  • Documentation, examples, and API make SciChart WPF easy to use.
  • Supported with assistance that helps them when they need it most
View More Testimonials
quote
Ziran W
star
star
star
star
star

High performance, multiple useful features, easy to use, and good documentation with detailed tutorials and examples. We applied SciChart in a DAQ&Testing system to display signals in real-time. This software definitely met our requirements.

quote
Michel B
star
star
star
star
star
SciChart is amazing for the enormous amount of data that it helps to plot. I use it perfectly with MVVM and WPF. The supplied demo application shows and documents all its functionality in a clear and precise way. The technical support, when needed is excellent.
quote
Geoffrey W
star
star
star
star
star

I’ve been a full source SciChart customer for years. I evaluated all the Open Source and commercial offerings (LightningChart) and found SciChart to be the best overall product in terms of documentation, performance and support.