DirectX Compatibility in WPF Charts with SciChart
SciChart now features an optional DirectX10 based renderer. This is currently included as an add-on to the SciChart High Performance […]
UPDATE: SciChart WPF v6 is now released. We have a tech demo that can now display 10,000,000,000 (Ten Billion) datapoints here.
When SciChart WPF was born, our first prototype of software in 2011 aimed to be able to draw 100,000 points in line charts in real-time. At the time, the nearest competitor in WPF Charts was able to draw no more than 10,000 points, and many competitor WPF charts could draw just a few thousand points before the computer became too slow to operate.
SciChart’s WPF chart was the first software component in the world to use Bitmaps (rasterized graphics) instead of WPF’s slower, vector graphics. Later we integrated DirectX to WPF. As a result, we have created a new market customers building high-performance, real-time WPF charting applications and our award-winning software now makes impossible projects possible.
Over the years, our performance has improved considerably, but today we give you a new breakthough! In the upcoming SciChart WPF v6, we have increased the performance of our charts up to 100x (10,000%) so that you can now render insanely high point-counts in your application.
We will be making an announcement soon about SciChart WPF v6 – a complete re-write of our charts, containing a completely new proprietary, cross-platform graphics engine enabling a massive performance boost to our WPF charts: up to 100x faster, or 10,000%.
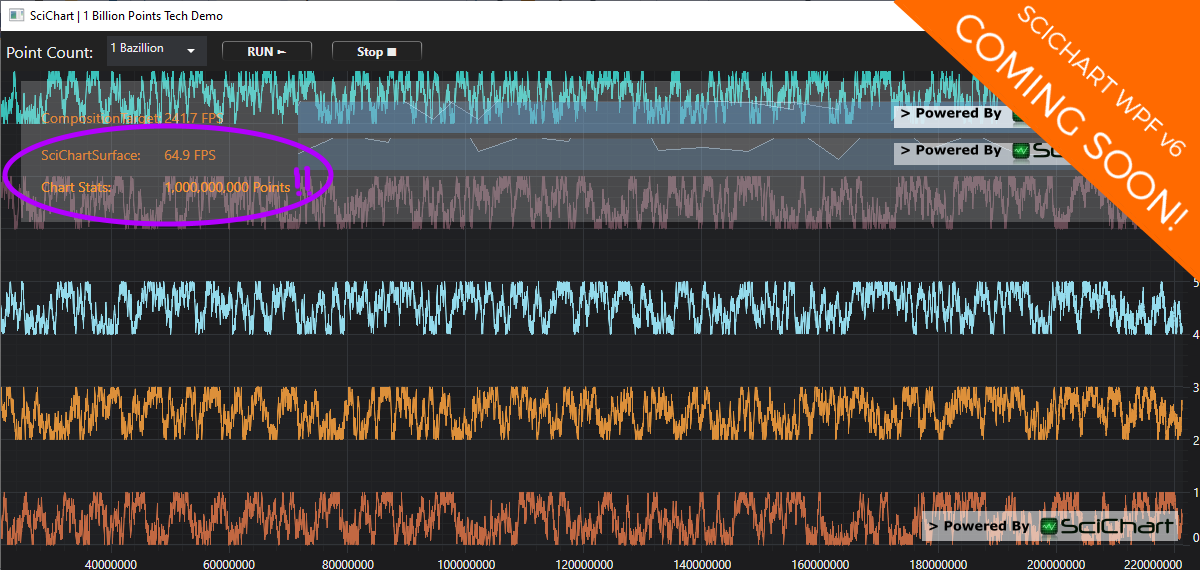
As a preview & tech demo of this incredible technology, we’ve included a tech demo below of drawing 1 billion (1,000,000,000) data-points in real-time at 60 FPS.
Draw hundreds of millions, or up to a billion points in your WPF Chart Applications with SciChart.
Watch the video below to see a preview of SciChart WPF v6 drawing up to 1 Billion Data-points in real-time. This kind of chart can be used in real-time monitoring or visualising output of telemetry sensors which produce huge data-sets.
The memory usage is extremely efficient, with this application consuming just 8GB of memory to render a billion points. That’s how much memory is required to hold 1,000,000,000 elements of floating-point X,Y data. Our lightweight C++/DirectX charting engine needs just a few hundred megabytes. Your applications will be faster, smoother and more efficient thanks to SciChart’s engineering team.
To test out the billion points demo using SciChart WPF v6 Beta, you can download and run the application for yourself. Note that there are some nuget steps to setup in the Readme.md.
In the code you will notice some flags are enabled on the chart to achieve this incredible, record performance:
That’s it. The rest of the API is largely unchanged, so you’ll still have the benefit of our XAML-friendly, MVVM capable WPF API and the benefit of backward-compatibility while seeing the performance increase in your WPF Chart applications by up to 100x!
Our new engine is codenamed Visual Xccelerator™. We’re going to be talking about this a lot in the coming weeks and months, but in short, it’s a completely in-house, proprietary, cross-platform C++ game engine, fully GPU accelerated using pixel & vertex shaders, which we’ve built layers on top of to create 2D/3D charts.
With our new engine enabled, we swap out the rendering pipeline for our new, faster, leaner, cross-platform DirectX drawing engine. However, with VisualXcceleratorEngine.ImpossibleMode enabled, we use an experimental data-processing technique resulting in charts with BILLIONS of data-points at 60FPS+. An incredible feat of engineering.
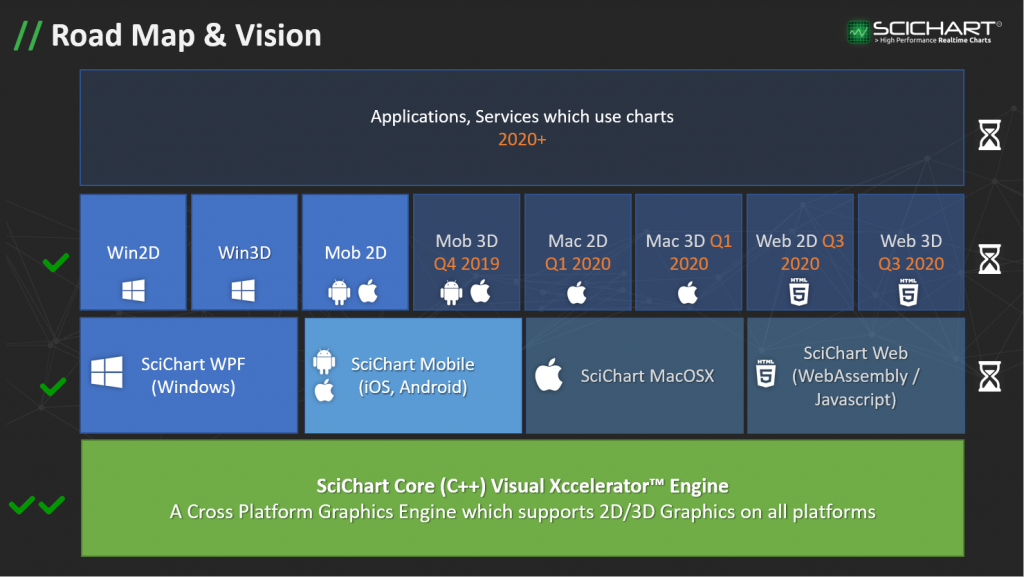
That means the kind of insane performance you see above, we will be able to roll out to other current platforms (iOS, Android) as well as future platforms (MacOS, Javascript/WebAssembly) as we build the API layers.
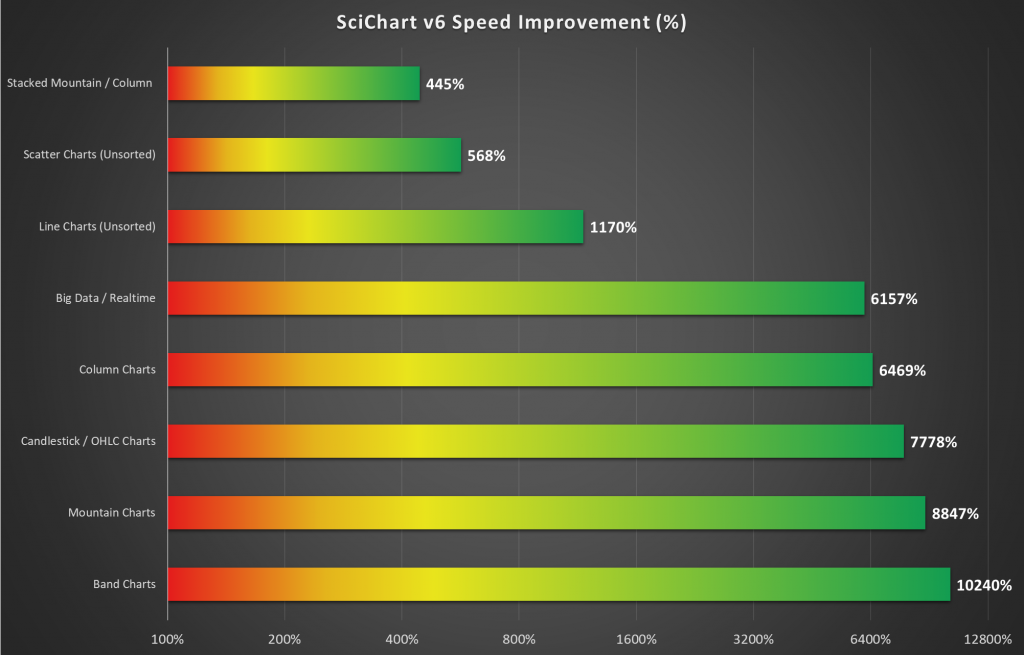
In fact, the coming performance increases don’t just apply to line charts. We’ll be talking about this in more detail soon, but this is what customers of SciChart WPF have to look forward to in terms of wide-reaching performance improvements.
So how did we achieve this quite frankly incredible charting performance in a WPF Chart control?
Well, first of, we use DirectX, however we have used DirectX for a long while. What we have done in SciChart WPF v6 is we’ve streamlined our usage of this in every way possible, being as memory efficient as possible, using the GPU rather than CPU to perform intensive computations, even choosing the right techniques to draw geometry that best leverage graphics card resources. In other words, a complete re-write of our DirectX rendering engine to achieve this kind of speed.
Secondly, we’ve moved the core algorithms of SciChart to C++ code. More than just drawing algorithms, we also have a tonne of data-processing algorithms which have been ported over to C++ and now seamlessly interop with C#. Now that the algorithms are in C++ we can do all kinds of techniques to boost speed.
As a SciChart WPF developer you won’t notice that under the hood our chart is using C++, as it will work seamlessly on workstation PCs, you can get our packages from NuGet, you don’t have to worry about C++ deployment at all – we’ve done all the hard work simplifying this difficult task so you don’t have to.
Lastly, we have tuned, tuned and re-tuned again and again all our critical code paths.
During this process we have become experts in ultra-high-performance graphics & data-processing and have a learned a lot about how modern CPUs and GPUs work. If you want to hire us to analyse, optimise your applications and algorithms, you can do so by contacting us, we’d be happy to talk!
The release for SciChart WPF v6 is imminent, and we will be announcing very shortly. Here’s some notes you need to be aware of prior to the release date.
Other than that, that’s it! Everything will be announced in due course and we will be rolling out this incredible new version of our high-performance, real-time charting software very shortly.
Founded in 2010, Scichart is headed up by Dr. Andrew Burnett-Thompson, who holds a Masters degree in Electronic Engineering, and a PhD in electronic engineering with signal processing. Andrew and his team are high-performance experts, with experience across programming languages, and platforms, including C#, C++, Java, Kotlin, Swift and niche skills such as algorithm development, C#/C++ or Java/C++ interop, SIMD development, parallel processing, managed or native code performance analysis and more. We can squeeze so much out of WPF that it can now draw 1-billion data-points, how much more value could we add to your performance critical applications?
If you need this kind of expertise in your project, consider contacting us to arrange a consultation.
Related Posts
![]()
Queens Award for Innovation
Proud winners of the Queens Award for Innovation, 2019. Awarded on account of our innovative graphics engine which underpins the SciChart library and enables our world-beating charting performance
![]()
National Business Awards
Highly Commended for Lloyds National Business Awards, 2019. Awarded on account of our innovative graphics engine and impressive customer base
![]()
National Technology Awards
Awarded “Healthcare Tech of the Year” at the 2025 National Technology Awards – a top UK recognition for breakthrough innovation in technology.

Reviews
SciChart has received hundreds of verified, 3rd party reviews