DirectX Compatibility in WPF Charts with SciChart
SciChart now features an optional DirectX10 based renderer. This is currently included as an add-on to the SciChart High Performance […]
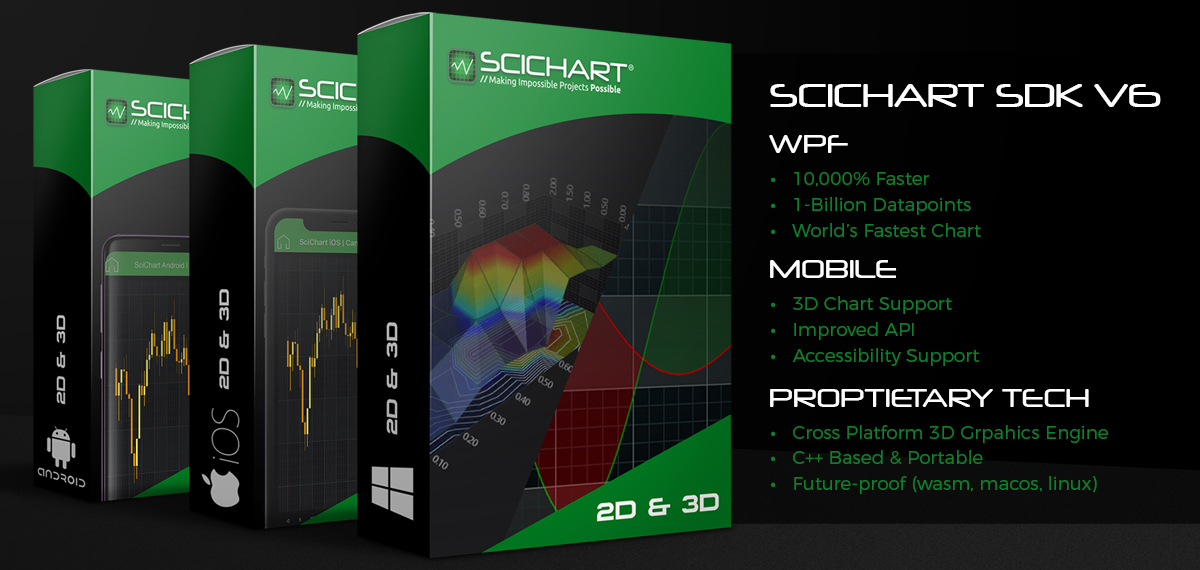
Following the successful release of SciChart WPF v6, and the warm reception by our users for the massively improved performance, We were curious to see just what SciChart WPF v6 – The World’s Fastest WPF Chart was able to do … So just for fun, we created a tech demo which showcases SciChart drawing 10,000,000,000 (Ten Billion!!) data-points in a real-time, streaming, WPF Chart application.
The demo is part of our examples suite, but is capped to 1-Billion data-points. We modified this demo to draw 4, 8 Billion and 10 Billion points just to see what SciChart could do!
So what are the limits here? The limits we are pushing are honestly system RAM, and we start to hit some interesting operating system limits. For example:
10 Billion points of floating point data requires 10Bn * 4-bytes * 2 (X,Y values) = 80GBytes of memory as well, and the best computer we could find in the SciChart office was a Macbook Pro with 64GB Ram. So, we had to rely on SciChart’s optimised swap-disk and memory compression algorithms, as well as our proprietary C++ / cross-platform 2D/3D graphics engine named Visual Xccelerator™ to render this quite frankly, massive, big-data set.
In the article, SciChart WPF v6 ‘Xccelerated Edition’ Up to 100x (10,000%) Faster WPF Charts! we outlined why as a result of user-feedback, we chose to improve the performance of our already fast WPF Chart controls.
Next, we talk about the in-depth testing that we performed to measure the speed of our WPF Charts. Finally we talk about the technical accomplishments showing the performance improvements across chart types.
Have a read of the article to learn how SciChart beats all known competitors in WPF Charting performance.
Without doubt, we are certain that SciChart WPF brings you the World’s Fastest WPF Chart control! Not only can you render huge data-sets but our charts are also lightweight and performant, giving you:
Not only that, but our WPF Charts are fast & flexible, support MVVM & XAML throughout, are award winning and are rated Best by hundreds of users. When you purchase SciChart WPF you are buying an incredibly complex piece of technical equipment with millions of lines of code, made simple & easy to use by our talented tech & engineering team.
If you are building an application which requires the best, and fastest WPF Charts, then download a trial of SciChart WPF Today.
Use our Getting-Started guide to start quickly and start building cutting-edge scientific, medical, financial applications such as ECG/EKG, Telemetry applications, Formula One, Seismic monitoring, High frequency trading or just outstanding business/enterprise applications with extreme real-time performance today!
Best regards,
Andrew
[SciChart Team]
Related Posts
![]()
Queens Award for Innovation
Proud winners of the Queens Award for Innovation, 2019. Awarded on account of our innovative graphics engine which underpins the SciChart library and enables our world-beating charting performance
![]()
National Business Awards
Highly Commended for Lloyds National Business Awards, 2019. Awarded on account of our innovative graphics engine and impressive customer base
![]()
National Technology Awards
Awarded “Healthcare Tech of the Year” at the 2025 National Technology Awards – a top UK recognition for breakthrough innovation in technology.

Reviews
SciChart has received hundreds of verified, 3rd party reviews