DirectX Compatibility in WPF Charts with SciChart
SciChart now features an optional DirectX10 based renderer. This is currently included as an add-on to the SciChart High Performance […]
This page is out of date. Please visit the latest documentation.
Here at SciChart HQ we receive quite a lot of user-requests for interactivity which is similar to, but not quite what SciChart provides out of the box. What we aim to do over time is provide a series of articles which demonstrate how you can extend SciChart to create your own ChartModifiers. We eventually intend to publish the source code for the standard modifiers which ship with SciChart however the API isn’t quite mature enough to do that just yet. For now you’ll have to do with these tutorials!
If you haven’t read it yet, we recommend skimming Extending SciChart with Text Annotations as this gives a great introduction to the ChartModifier API, such as how to transform mouse coordinates to data coordinates and vice versa, plus position UIElements on a canvas over the SciChartSurface. Also, we recommend Real-time User Feedback with the Rollover Modifier as it is this basic modifier which we are going to adapt to a new scenario.
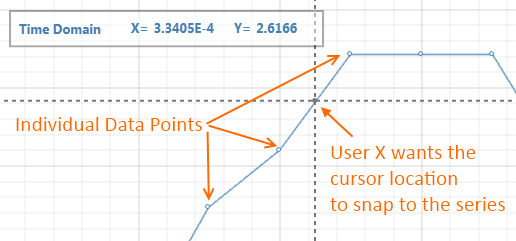
User X wants to analyse some data. In particular they’re looking at a large data-set of some 200,000 points of voltage/time values. They want to be able to zoom right into the chart and inspect the values with a cursor, however there’s a catch. The cursor should snap to the series. Oh, there’s another catch, the time-series includes sudden transient jumps so the existing RolloverModifier with its snap-to-nearest-datapoint feature doesn’t allow them to see the exact data-value under the mouse.
Basically, what the user really wants to do is this:
They want a cursor which snaps to the series using linear interpolation between the two nearest data-points under the mouse, with X,Y value feedback on the underlying series value.
No problem we say! Our extensible API allows you to do virtually anything with SciChart. So we went away and created a custom example for User X.
The complete class for InterpolationModifier follows. It’s a few hundred lines but do bear with us. We’ll break it down below.
[sourcecode language=”csharp”]
public class InterpolationRolloverModifier : ChartModifierBase
{
public static readonly DependencyProperty RolloverDataProperty = DependencyProperty.Register(“RolloverData”, typeof(ChartDataObject), typeof(InterpolationRolloverModifier), new PropertyMetadata(null));
public static readonly DependencyProperty DrawVerticalLineProperty = DependencyProperty.Register(“DrawVerticalLine”, typeof(bool), typeof(InterpolationRolloverModifier), new PropertyMetadata(true));
public static readonly DependencyProperty VerticalLineStyleProperty = DependencyProperty.Register(“VerticalLineStyle”, typeof(Style), typeof(InterpolationRolloverModifier), new PropertyMetadata(null));
public static readonly DependencyProperty DrawHorizontalLineProperty = DependencyProperty.Register(“DrawHorizontalLine”, typeof(bool), typeof(InterpolationRolloverModifier), new PropertyMetadata(true));
public static readonly DependencyProperty UseInterpolationProperty = DependencyProperty.Register(“UseInterpolation”, typeof(bool), typeof(InterpolationRolloverModifier), new PropertyMetadata(true));
private List<UIElement> _rolloverMarkers = new List<UIElement>();
private UIElement _verticalLine;
private Line _horizontalLine;
public InterpolationRolloverModifier()
{
RolloverData = new ChartDataObject { SeriesInfo = new ObservableCollection<SeriesInfo>() };
}
// Gets or sets whether a Vertical Line should be drawn at the rollover location
public bool DrawVerticalLine
{
get { return (bool)GetValue(DrawVerticalLineProperty); }
set { SetValue(DrawVerticalLineProperty, value); }
}
// Gets or sets whether a Horizontal Line should be drawn at the rollover location
public bool DrawHorizontalLine
{
get { return (bool)GetValue(DrawHorizontalLineProperty); }
set { SetValue(DrawHorizontalLineProperty, value); }
}
// Gets or sets whether the rollover action should use interpolation
public bool UseInterpolation
{
get { return (bool)GetValue(UseInterpolationProperty); }
set { SetValue(UseInterpolationProperty, value); }
}
// Gets or sets the Vertical Line Style. Only applied if DrawVerticalLine is true
public Style VerticalLineStyle
{
get { return (Style)GetValue(VerticalLineStyleProperty); }
set { SetValue(VerticalLineStyleProperty, value); }
}
// Gets or sets the ChartDataObject which may be bound to, to provide feedback to the user of rollover updates
public ChartDataObject RolloverData
{
get { return (ChartDataObject)GetValue(RolloverDataProperty); }
set { SetValue(RolloverDataProperty, value); }
}
// Called when the Mouse is moved on the parent <see cref=”SciChartSurface”/>
public override void OnModifierMouseMove(ModifierMouseArgs e)
{
base.OnModifierMouseMove(e);
var currentPoint = e.MousePoint;
PerformInterpolatedRollover(currentPoint);
}
// Called immediately before the Chart Modifier is detached from the Chart Surface
public override void OnDetached()
{
base.OnDetached();
RemoveMarkers();
}
// Called when the IsEnabled property changes on this ChartModifierBase instance
protected override void OnIsEnabledChanged()
{
base.OnDetached();
RemoveMarkers();
}
private void PerformInterpolatedRollover(Point mousePoint)
{
RemoveMarkers();
var parentSurface = ParentSurface;
var allSeries = parentSurface.RenderableSeries;
if (allSeries == null || allSeries.Count == 0)
return;
RolloverData.SeriesInfo.Clear();
var renderableSeries = allSeries.First();
// Step 1, get the mouse point and snap to nearest data point (normal rollover modifier does this)
var hitResult = renderableSeries.HitTest(mousePoint);
double xCoord1 = hitResult.HitTestPoint.X;
double yCoord1 = hitResult.HitTestPoint.Y;
double xData1 = (double)hitResult.XValue;
double yData1 = (double)hitResult.YValue;
// Setup default coords and data, we will modify these below if UseInterpolation==True
double xCoord = xCoord1;
double yCoord = yCoord1;
double xData = xData1;
double yData = yData1;
// Step 2, if we’re interpolating
if (UseInterpolation && Math.Abs(mousePoint.X – xCoord1) >= 2)
{
// Using the hit-test data value, find the index to the data-series
// We want to get the next, or previous value, to perform interpolation
int index = renderableSeries.DataSeries.XValues.IndexOf(hitResult.XValue);
if (mousePoint.X < xCoord1)
index–;
else
index++;
// Ensure Index isn’t out of the bounds of the DataSeries.XValues
if (index > 0 && index < renderableSeries.DataSeries.Count)
{
// Get the next (or previous) X and Y data values
double xData2 = (double)renderableSeries.DataSeries.XValues[index];
double yData2 = (double)renderableSeries.DataSeries.YValues[index];
// Convert the nearest neighbour data values to X,Y pixel coordinates
double xCoord2 = XAxis.GetCoordinate(xData2);
double yCoord2 = YAxis.GetCoordinate(yData2);
// Now perform interpolation.
SortedSwap(ref xCoord1, ref xCoord2, ref yCoord1, ref yCoord2);
SortedSwap(ref xData1, ref xData2, ref yData1, ref yData2);
// How far in X are we in the current mouse point? Use this fraction to perform linear interpolation
double xFraction = (mousePoint.X – xCoord1) / (xCoord2 – xCoord1);
// XCoord is always the mouse coord
xCoord = mousePoint.X;
// Intepolate X-data point
xData = Math.Abs(xData1 – xData2) * xFraction + xData1;
// Interpolate on Y using Pythagoras
double yDiff = Math.Abs(yCoord1 – yCoord2);
if (yCoord1 < yCoord2)
{
yCoord = yCoord1 + xFraction * yDiff;
yData = yData1 – Math.Abs(yData1 – yData2) * xFraction;
}
else
{
yCoord = yCoord1 – xFraction * yDiff;
yData = Math.Abs(yData1 – yData2) * xFraction + yData1;
}
}
}
// Step 3: Now draw the vertical line
if (DrawVerticalLine)
{
_verticalLine = new Line()
{
X1 = xCoord,
X2 = xCoord,
Y1 = 0,
Y2 = ModifierSurface.Height,
Style = VerticalLineStyle,
};
ModifierSurface.Children.Add(_verticalLine);
}
// Step 4: Now draw the horizontal line
if (DrawHorizontalLine)
{
_horizontalLine = new Line()
{
X1 = 0,
X2 = ModifierSurface.Width,
Y1 = yCoord,
Y2 = yCoord,
Style = VerticalLineStyle,
};
ModifierSurface.Children.Add(_horizontalLine);
}
// Step 5: Draw the rollover marker at the appropriate location
var rolloverMarker = renderableSeries.RolloverMarker;
if (rolloverMarker != null && parentSurface.IsPointWithinBounds(new Point(xCoord1,yCoord1)))
{
Canvas.SetLeft(rolloverMarker, xCoord – rolloverMarker.ActualWidth / 2.0);
Canvas.SetTop(rolloverMarker, yCoord – rolloverMarker.ActualHeight / 2.0);
ModifierSurface.Children.Add(rolloverMarker);
_rolloverMarkers.Add(rolloverMarker);
}
SeriesInfo seriesInfo = null;
// Finally expose SeriesInfo which contains the interpolated X,Y value which we bind to in the UI
seriesInfo = new XySeriesInfo(
renderableSeries.DataSeries.SeriesName,
xData,
yData,
renderableSeries.SeriesColor,
DataSeriesType.Xy);
RolloverData.SeriesInfo.Add(seriesInfo);
}
// Swaps X1,X2 and Y1,Y2 so that the first coordinate pair is always to the left of the second coordinate pair
private static void SortedSwap(ref double xCoord1, ref double xCoord2, ref double yCoord1, ref double yCoord2)
{
if (xCoord1 > xCoord2)
{
double temp = xCoord1;
xCoord1 = xCoord2;
xCoord2 = temp;
temp = yCoord1;
yCoord1 = yCoord2;
yCoord2 = temp;
}
}
private void RemoveMarkers()
{
if (ModifierSurface != null)
{
if (_verticalLine != null)
ModifierSurface.Children.Remove(_verticalLine);
if (_horizontalLine != null)
ModifierSurface.Children.Remove(_horizontalLine);
foreach (var marker in _rolloverMarkers)
{
if (ModifierSurface.Children.Contains(marker))
{
ModifierSurface.Children.Remove(marker);
}
}
}
_rolloverMarkers.Clear();
}
}
[/sourcecode]
Most of the work occurs in the method PerformInterpolatedRollover(Point mousePoint). This method gets all the RenderableSeries by calling ParentSurface.RenderableSeries. It then chooses a series to operate on (simply chooses the first in our example, however setting the series as a property on the InterpolationRolloverModifier would be good).
[sourcecode language=”csharp”]
var parentSurface = ParentSurface;
var allSeries = parentSurface.RenderableSeries;
if (allSeries == null || allSeries.Count == 0)
return;
RolloverData.SeriesInfo.Clear();
var renderableSeries = allSeries.First();
[/sourcecode]
Next, we perform the hit-test at the current mouse-point. this provides a HitTestInfo struct with X,Y data and coordinate values nearest to the current mouse point (snaps to mouse point).
[sourcecode language=”csharp”]
// Step 1, get the mouse point and snap to nearest data point
// (normal rollover modifier does this)
var hitResult = renderableSeries.HitTest(mousePoint);
double xCoord1 = hitResult.HitTestPoint.X;
double yCoord1 = hitResult.HitTestPoint.Y;
double xData1 = (double)hitResult.XValue;
double yData1 = (double)hitResult.YValue;
[/sourcecode]
Now we have our snapped to data-point X,Y values we need to perform linear interpolation. To do this we will perform the following steps:
[sourcecode language=”csharp”]
// Step 2, if we’re interpolating
if (UseInterpolation && Math.Abs(mousePoint.X – xCoord1) >= 2)
{
// 1. Using the hit-test data value, find the index to the data-series
int index = renderableSeries.DataSeries.XValues.IndexOf(hitResult.XValue);
// 2. We want to get the next, or previous value, to perform interpolation
if (mousePoint.X < xCoord1)
index–;
else
index++;
// Ensure Index isn’t out of the bounds of the DataSeries.XValues
if (index > 0 && index < renderableSeries.DataSeries.Count)
{
// 3. Get the next (or previous) X and Y data values
double xData2 = (double)renderableSeries.DataSeries.XValues[index];
double yData2 = (double)renderableSeries.DataSeries.YValues[index];
// Convert the nearest neighbour data values to X,Y pixel coordinates
double xCoord2 = XAxis.GetCoordinate(xData2);
double yCoord2 = YAxis.GetCoordinate(yData2);
// 4. Now perform interpolation.
SortedSwap(ref xCoord1, ref xCoord2, ref yCoord1, ref yCoord2);
SortedSwap(ref xData1, ref xData2, ref yData1, ref yData2);
// How far in X are we in the current mouse point? Use this fraction to perform linear interpolation
double xFraction = (mousePoint.X – xCoord1) / (xCoord2 – xCoord1);
// XCoord is always the mouse coord
xCoord = mousePoint.X;
// Intepolate X-data point
xData = Math.Abs(xData1 – xData2) * xFraction + xData1;
// Interpolate on Y using Pythagoras
double yDiff = Math.Abs(yCoord1 – yCoord2);
if (yCoord1 < yCoord2)
{
yCoord = yCoord1 + xFraction * yDiff;
yData = yData1 – Math.Abs(yData1 – yData2) * xFraction;
}
else
{
yCoord = yCoord1 – xFraction * yDiff;
yData = Math.Abs(yData1 – yData2) * xFraction + yData1;
}
}
}
[/sourcecode]
Note that the method SortedSwap(ref double) is basically ensuring that the XData1 is before XData2 and swaps these two plus their associated Y-values accordingly. There is a bit of if-else logic depending on if the Y-values are increasing or decreasing at the hit-test point, but apart from that the calculation is quite simple. The output is xData,yData (Data Values) and xCoord,yCoord (pixel values). These are used below to interact with the chart ModifierSurface, which is a Canvas control overlaid on top of the SciChartSurface.
The following section of code draws the horizontal, vertical line and applies the RolloverMarker to the canvas. The lines have styles applied in the Xaml where the InterpolationRolloverModifier is created. The RolloverMarker is a property on BaseRenderableSeries and is populated with a custom UIElement in Xaml.
[sourcecode language=”csharp”]
// Step 3: Now draw the vertical line
if (DrawVerticalLine)
{
_verticalLine = new Line()
{
X1 = xCoord,
X2 = xCoord,
Y1 = 0,
Y2 = ModifierSurface.Height,
Style = VerticalLineStyle,
};
ModifierSurface.Children.Add(_verticalLine);
}
// Step 4: Now draw the horizontal line
if (DrawHorizontalLine)
{
_horizontalLine = new Line()
{
X1 = 0,
X2 = ModifierSurface.Width,
Y1 = yCoord,
Y2 = yCoord,
Style = VerticalLineStyle,
};
ModifierSurface.Children.Add(_horizontalLine);
}
// Step 5: Draw the rollover marker at the appropriate location
var rolloverMarker = renderableSeries.RolloverMarker;
if (rolloverMarker != null && parentSurface.IsPointWithinBounds(new Point(xCoord1,yCoord1)))
{
Canvas.SetLeft(rolloverMarker, xCoord – rolloverMarker.ActualWidth / 2.0);
Canvas.SetTop(rolloverMarker, yCoord – rolloverMarker.ActualHeight / 2.0);
ModifierSurface.Children.Add(rolloverMarker);
_rolloverMarkers.Add(rolloverMarker);
}
[/sourcecode]
The final step is to output data so we can bind to it in the UI to display the interpolated X,Y datavalues. The RolloverModifier exposes a property RolloverData, which contains an ObservableCollection. These is used to perform data-binding to a legend panel in Xaml. We will do the same thing, just populate the RolloverData property with a single SeriesInfo with our X,Y values.
[sourcecode language=”csharp”]
// Finally expose SeriesInfo which contains the interpolated X,Y value which we bind to in the UI
seriesInfo = new XySeriesInfo(
renderableSeries.DataSeries.SeriesName,
xData,
yData,
renderableSeries.SeriesColor,
DataSeriesType.Xy);
RolloverData.SeriesInfo.Add(seriesInfo);
// Declaration of XySeriesInfo
public class XySeriesInfo : SeriesInfo
{
private readonly double _xValue;
public XySeriesInfo(string seriesName, double xValue, double yValue, Color seriesColor, DataSeriesType dataSeriesType)
: base(seriesName, yValue, seriesColor, dataSeriesType)
{
_xValue = xValue;
}
public double XValue { get { return _xValue; } }
}
[/sourcecode]
Our next step is to create the Xaml which will declare the SciChartSurface with a single FastLineRenderableSeries, our custom interactivity modifier and a legend panel to display the feedback from the modifier. The Xaml is as follows:
[sourcecode language=”xml”]
<Grid x:Name=”rootGrid” Grid.Row=”2″ >
<Border x:Name=”border” Background=”{StaticResource SciChartBackground}” Padding=”10″>
<SciChart:SciChartSurface x:Name=”sciChart” >
<SciChart:SciChartSurface.RenderableSeries>
<!– To improve performance, use ResamplingMode=MinMax. To improve visual accuracy, use None –>
<SciChart:FastLineRenderableSeries SeriesColor=”SteelBlue” ResamplingMode=”MinMax” StrokeThickness=”2″>
<SciChart:FastLineRenderableSeries.RolloverMarkerTemplate>
<ControlTemplate>
<Ellipse Fill=”#777″ Width=”7″ Height=”7″/>
</ControlTemplate>
</SciChart:FastLineRenderableSeries.RolloverMarkerTemplate>
<SciChart:FastLineRenderableSeries.PointMarkerTemplate>
<ControlTemplate>
<Ellipse Fill=”#FFF” Stroke=”SteelBlue” StrokeThickness=”1″ Width=”7″ Height=”7″/>
</ControlTemplate>
</SciChart:FastLineRenderableSeries.PointMarkerTemplate>
</SciChart:FastLineRenderableSeries>
</SciChart:SciChartSurface.RenderableSeries>
<SciChart:SciChartSurface.XAxis>
<SciChart:NumericAxis TextFormatting=”0.000E+0″/>
</SciChart:SciChartSurface.XAxis>
<SciChart:SciChartSurface.YAxis>
<SciChart:NumericAxis/>
</SciChart:SciChartSurface.YAxis>
<SciChart:SciChartSurface.ChartModifier>
<SciChart:ModifierGroup>
<!– Custom modifier based on the RolloverModifier –>
<CustomModifiers:InterpolationRolloverModifier x:Name=”customModifier” IsEnabled=”False” UseInterpolation=”False”>
<CustomModifiers:InterpolationRolloverModifier.VerticalLineStyle>
<Style TargetType=”Line”>
<Setter Property=”StrokeThickness” Value=”2″ />
<Setter Property=”StrokeDashArray” Value=”2,2″/>
<Setter Property=”Stroke”>
<Setter.Value>
<SolidColorBrush Color=”#777″/>
</Setter.Value>
</Setter>
</Style>
</CustomModifiers:InterpolationRolloverModifier.VerticalLineStyle>
</CustomModifiers:InterpolationRolloverModifier>
<SciChart:RubberBandXyZoomModifier x:Name=”zoomModifier” IsXAxisOnly=”True” IsEnabled=”True” RubberBandFill=”#33333333″ RubberBandStroke=”#77333333″/>
<SciChart:ZoomPanModifier x:Name=”panModifier” IsEnabled=”False”/>
<SciChart:XAxisDragModifier/>
<SciChart:YAxisDragModifier/>
</SciChart:ModifierGroup>
</SciChart:SciChartSurface.ChartModifier>
</SciChart:SciChartSurface>
</Border>
<!– Define the overlay panel to show chart values (bound to CustomModifier.SeriesInfo –>
<Border BorderBrush=”#55000000″ BorderThickness=”2″ Background=”#77FFFFFF” VerticalAlignment=”Top”
HorizontalAlignment=”Left” Margin=”23,23″ Padding=”5″>
<ItemsControl DataContext=”{Binding ElementName=customModifier}”
ItemsSource=”{Binding RolloverData.SeriesInfo}”>
<ItemsControl.ItemTemplate>
<DataTemplate>
<Grid>
<Grid.ColumnDefinitions>
<ColumnDefinition />
<ColumnDefinition />
<ColumnDefinition />
<ColumnDefinition />
<ColumnDefinition />
</Grid.ColumnDefinitions>
<TextBlock Grid.Column=”0″ Text=”{Binding SeriesName}” Margin=”3,3,20,3″ FontSize=”13″ FontWeight=”Bold” Foreground=”SteelBlue”/>
<TextBlock Grid.Column=”1″ Text=”X=” Margin=”10,2,2,2″ FontSize=”13″ FontWeight=”Bold” Foreground=”SteelBlue”/>
<TextBlock Grid.Column=”2″ Text=”{Binding XValue, StringFormat={0:0.0000E0}}” Margin=”3,2,20,2″ FontSize=”13″ FontWeight=”Bold” Foreground=”SteelBlue”/>
<TextBlock Grid.Column=”3″ Text=”Y=” Margin=”0,2,2,2″ FontSize=”13″ FontWeight=”Bold” Foreground=”SteelBlue”/>
<TextBlock Grid.Column=”4″ Text=”{Binding Value, StringFormat={0:0.0000}}” Margin=”3,2,20,2″ FontSize=”13″ FontWeight=”Bold” Foreground=”SteelBlue”/>
</Grid>
</DataTemplate>
</ItemsControl.ItemTemplate>
</ItemsControl>
</Border>
</Grid>
[/sourcecode]
Breaking this down the line series has a PointMarkerTemplate and RolloverMarkerTemplate applied. The latter is mandatory as it is used by our custom interpolation cursor. The PointMarketTemplate has been included just to assist with seeing where the data-points are.
The chart has several ChartModifiers applied via a ModifierGroup. These include our custom InterpolationRolloverModifier, plus a RubberBandXyZoomModifier, ZoomPanModifier and finally Axis drag modifiers. These can’t all be used at once so in code-behind we are going to switch them on/off according to toolbar buttons pressed. Something you should note is the InterpolationRolloverModifier has a style applied to the vertical and horizontal line. This is mandatory as there is no default style for the custom modifier (SciChart applies default styles to its built-in modifiers, but custom ones require styling).
Finally at the bottom of MainWindow.xaml notice the ItemsControl which is data-bound to the customModifier.RolloverData.SeriesInfo, transforming X,Y data values and series name into a custom active legend which updates as you move the mouse.
The code behind is actually quite simple. Here we setup the SciChart by creating a DataSeriesSet, adding a single DataSeries and filling with canned data from an embedded resource. We call sciChartSurface.ZoomExtents and wrap all operations in a using(sciChartSurface.SuspendUpdates()) block to ensure only one draw operation occurs at the end of the batch update.
[sourcecode language=”csharp”]
private void WindowLoaded(object sender, RoutedEventArgs e)
{
double[] yValues;
double[] xValues;
GenerateData(out xValues, out yValues);
// Suspend drawing
using (var updateSuspender = sciChart.SuspendUpdates())
{
// Create dataset
var dataSeriesSet = new DataSeriesSet<double, double>();
sciChart.DataSet = dataSeriesSet;
// Add series
var tdSeries = dataSeriesSet.AddSeries();
tdSeries.SeriesName = “Time Domain”;
// Append data
tdSeries.Append(xValues, yValues);
// On every zoom extents, the Y Range will expand by 10% below and 10% above the data range
sciChart.YAxis.GrowBy = new DoubleRange(0.1, 0.1);
// Zoom extents
sciChart.ZoomExtents();
}
// redraws on exit of this block (disposal of ISuspendable type)
}
[/sourcecode]
The rest of MainWindow.xaml.cs is just plumbing to turn features on/off via the toolbar buttons in the example.


The above code snippets hopefully demonstrate how you can add custom interactivity modifiers to your SciChart projects. To simplify this process we’ve created a Demo Applicationwhich you can download and compile. This requires SciChart binaries (v1.2.1.783) which you can get by signing up to our Newsletter.
The demo application includes a toolbar at the top of the chart to set zoom, pan mode, inspect data-points and also allows you to take a screenshot. Screenshot functionality is provided by the enclosed ScreenshotUtil, which uses the WPF RenderTargetBitmap class to perform this action.
Related Posts
![]()
Queens Award for Innovation
Proud winners of the Queens Award for Innovation, 2019. Awarded on account of our innovative graphics engine which underpins the SciChart library and enables our world-beating charting performance
![]()
National Business Awards
Highly Commended for Lloyds National Business Awards, 2019. Awarded on account of our innovative graphics engine and impressive customer base
![]()
National Technology Awards
Awarded “Healthcare Tech of the Year” at the 2025 National Technology Awards – a top UK recognition for breakthrough innovation in technology.

Reviews
SciChart has received hundreds of verified, 3rd party reviews