Getting Started with SCICHART JavaScript Charts
Quickest of the Quick Start Guides Ok so you want to start a SciChart.js JavaScript Chart Trial? Great! Now What? […]
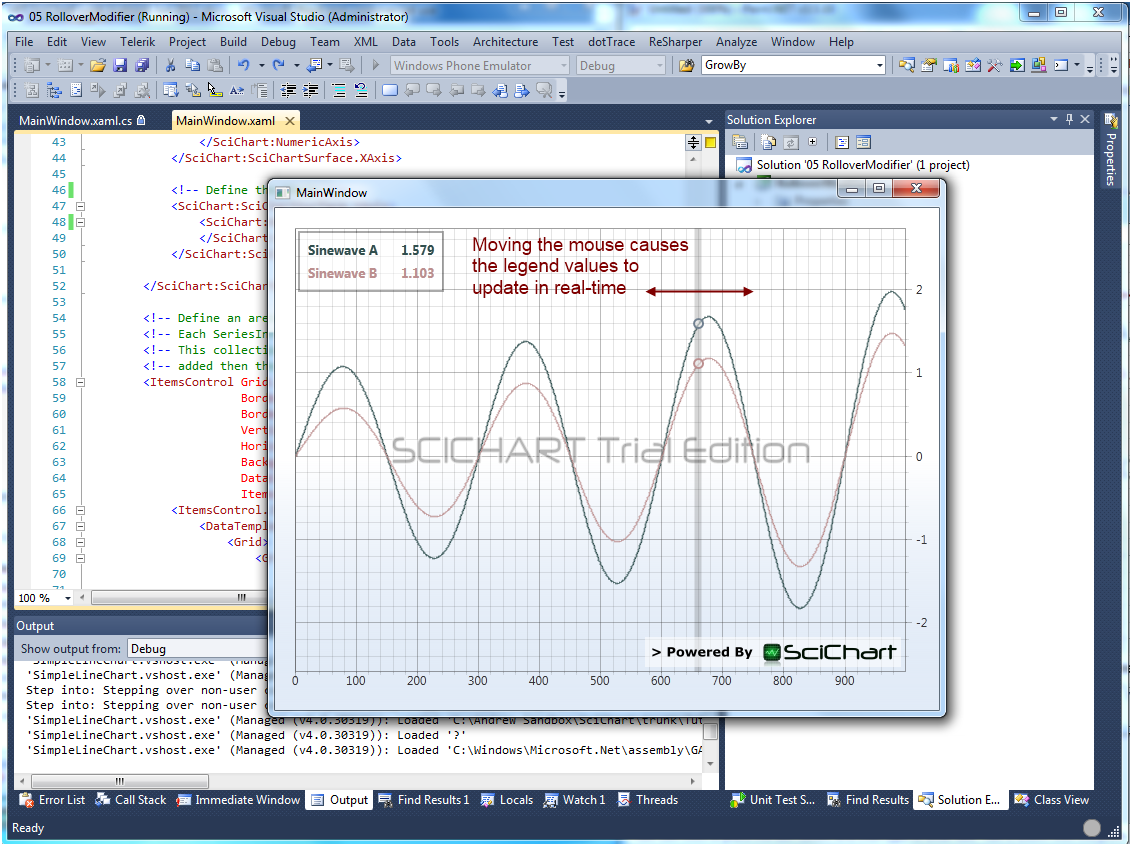
In order to create an interactive WPF Chart it is useful to see what the values of points are as you hover the mouse. One specific chart modifier can be used to provide User Feedback. This is the RolloverModifier. Add it to a Chart surface with two series using the following code:
private void MainWindow_Loaded(object sender, RoutedEventArgs e)
{
    // On zooming to extents, grow the Y Axis by 20% above and below the data min,max
    sciChartSurface.YAxis.GrowBy = new DoubleRange(0.2, 0.2);

    var dataset = new DataSeriesSet();
    var seriesA = dataset.AddSeries();
    var seriesB = dataset.AddSeries();

    // The series name will be databound to via the RolloverModifier in the xaml file
    seriesA.SeriesName ="Sinewave A";
    seriesB.SeriesName = "Sinewave B";

    for(int i = 0; i < 1000; i++)
    {
        var phi = 2*Math.PI*i/300.0;
        seriesA.Append(i, (1.0 + i/1000.0) * Math.Sin(phi));
        seriesB.Append(i, (0.5 + i / 1000.0) * Math.Sin(phi));
    }

    sciChartSurface.DataSet = dataset;
}<SciChart:SciChartSurface x:Name="sciChartSurface"
Margin="20,20,10,10"
GridLinesPanelStyle="{StaticResource GridPanelStyle}">
<!-- Defines the renderable series, which map 1:1 to data-series.
Renderable-Series may be styled -->
<SciChart:SciChartSurface.RenderableSeries>
<SciChart:FastLineRenderableSeries SeriesColor="DarkSlateGray"
RolloverMarkerTemplate="{StaticResource FirstSeriesRolloverTemplate}"/>
<SciChart:FastLineRenderableSeries SeriesColor="RosyBrown"
RolloverMarkerTemplate="{StaticResource SecondSeriesRolloverTemplate}"/>
</SciChart:SciChartSurface.RenderableSeries>
<SciChart:SciChartSurface.ChartModifier>
<SciChart:RolloverModifier RolloverRadius="5" />
</SciChart:SciChartSurface.ChartModifier>
<SciChart:SciChartSurface.XAxis>
<SciChart:NumericAxis />
</SciChart:SciChartSurface.XAxis>
<SciChart:SciChartSurface.YAxis>
<SciChart:NumericAxis />
</SciChart:SciChartSurface.YAxis>
</SciChart:SciChartSurface>The RolloverMarker must be styled with a control template and applied to the RenderableSeries. The Controltemplate is used to create the UI for a FrameworkElement which is overlaid on the series as the mouse moves. In the Xaml snippets below we create two circles to overlay on the series:
<!-- Define a control template for the first series rollover marker -->
<!-- Interally, this will be used to template a blank control which will be overlaid on -->
<!-- the ChartModifierSurface (canvas) which exists over the SciChartSurface -->
<ControlTemplate x:Key="FirstSeriesRolloverTemplate">
    <Ellipse Fill="#77FFFFFF" Stroke="#FF708090" Width="11" Height="11" StrokeThickness="2"/>
</ControlTemplate>

<!-- Define a control template for the second series rollover marker -->
<ControlTemplate x:Key="SecondSeriesRolloverTemplate">
    <Ellipse Fill="#77FFFFFF" Stroke="#FFBC8F8F" Width="11" Height="11" StrokeThickness="2"/>
</ControlTemplate>
This results in the following behaviour:
 Each mouse move event is translated into a hit-test on the series. The hit-test data is stored on the modifier itself in the RolloverData property as an ObservableCollection<SeriesInfo>, which you can bind to.
The relationship between RolloverModifier and its ChartDataObject is as follows:

/// <summary>
/// The <see cref="T:Abt.Controls.SciChart.RolloverModifier"/> provides a mouse-over hit-test
/// to a chart, plus a collection of <see cref="T:Abt.Controls.SciChart.SeriesInfo"/> objects to
/// bind to which updates as the mouse moves.
/// Add to a <see cref="T:Abt.Controls.SciChart.SciChartSurface"/> and set IsEnabled to true
/// to enable this behaviour
/// </summary>
public class RolloverModifier
{
public ChartDataObject RolloverData { get; set; }
public double RolloverRadius { get; set; }
}
/// <summary>
/// Provides a ViewModel containing info about chart series,
/// which can be bound to to create Rollover or legends
/// </summary>
public class ChartDataObject
{
public ObservableCollection<SeriesInfo> SeriesInfo
{
get;
set;
}
}

/// <summary>
/// Provides a ViewModel containing info about a series, such as name, value, color
/// </summary>
public class SeriesInfo
{
/// <summary>
/// Gets or sets the color of the series.
/// </summary>
public Color SeriesColor { get; set; }

/// <summary>
/// Gets or sets the name of the series.
/// </summary>
public string SeriesName { get; set; }

/// <summary>
/// Gets or sets the value.
/// </summary>
public double Value { get; set; }
}To output the chart values to the screen as the user moves the mouse, we need to databind an ItemsControl to the RolloverModifier.RolloverData property.
<!-- Define an area in the top left of the chart which binds to the
<!-- RolloverModifier.RolloverData.SeriesInfo collection -->
<!-- Each SeriesInfo contains information such as SeriesName, Color and Value at the mouse point -->
<!-- This collection updates dynamically as the mouse is moved. We bind to it using an -->
<!-- ItemsControl so if more series are added then the feedback also updates -->
<ItemsControl Grid.IsSharedSizeScope="True" Margin="23,23" Padding="5"
                BorderBrush="#55000000"
                BorderThickness="2"
                VerticalAlignment="Top"
                HorizontalAlignment="Left"
                Background="#77FFFFFF"
                DataContext="{Binding ElementName=sciChartSurface, Path=ChartModifier}"
                ItemsSource="{Binding RolloverData.SeriesInfo}">
    <ItemsControl.ItemTemplate>
        <DataTemplate DataType="SciChart:SeriesInfo">
            <Grid>
                <Grid.ColumnDefinitions>
                    <ColumnDefinition SharedSizeGroup="ColumnA"/>
                    <ColumnDefinition SharedSizeGroup="ColumnB"/>
                </Grid.ColumnDefinitions>

                <!-- Bind to the SeriesName using the SeriesColor as text foreground -->
                <TextBlock Grid.Column="0" Text="{Binding SeriesName}" Margin="3,3,20,3"
                         FontSize="13" FontWeight="Bold"
                         Foreground="{Binding SeriesColor, Converter={StaticResource
                                        ColorToBrushConverter}}" />

                <!-- Bind to the Series Value, using the SeriesColor as text foreground -->
                <TextBlock Grid.Column="1" Text="{Binding Value, StringFormat={}{0:0.000}}"
                         Margin="3,3,3,3" FontSize="13" FontWeight="Bold"
                         Foreground="{Binding SeriesColor, Converter={StaticResource
                                        ColorToBrushConverter}}" />
            </Grid>
        </DataTemplate>
    </ItemsControl.ItemTemplate>
</ItemsControl>
Breaking this down, this Xaml is setting the DataContext of an ItemsControl to the current SciChartSurface.ChartModifier, i.e. the RolloverModifier instance.
The ItemsSource is bound to the RolloverModifier.RolloverData.SeriesInfo collection.
The ItemTemplate is a DataTemplate which contains two TextBlocks. These are bound to the SeriesName and Value property of the SeriesInfo instance respectively.
Finally the foreground of each TextBlock is bound to the SeriesColor, using a ValueConverter to convert a Color to SolidColorBrush.
Running the application, we now get the following output. Congratulations! You’ve just created a WPF Chart with live feedback on mouse move!
Download Rollover Modifier VS2010 Solution
Related Posts
![]()
Queens Award for Innovation
Proud winners of the Queens Award for Innovation, 2019. Awarded on account of our innovative graphics engine which underpins the SciChart library and enables our world-beating charting performance
![]()
National Business Awards
Highly Commended for Lloyds National Business Awards, 2019. Awarded on account of our innovative graphics engine and impressive customer base
![]()
National Technology Awards
Awarded “Healthcare Tech of the Year” at the 2025 National Technology Awards – a top UK recognition for breakthrough innovation in technology.

Reviews
SciChart has received hundreds of verified, 3rd party reviews