SIGINT Intelligence Data Visualization for Defense & Critical Infrastructure
SIGINT intelligence data visualization trusted by NATO and leading defense organizations around the world. SciChart powers mission-critical SIGINT, CEMA, and Electronic Warfare operations with unmatched speed, precision, and security.
- Proven across NATO and allied programs for tactical dashboards, situational awareness, and mission playback systems.
- Reliable cross-platform rendering engine across JavaScript, WPF, iOS, Android, and Linux.
- GPU-accelerated performance for real-time signal, radar, and telemetry analysis with sub-millisecond latency and zero frame loss.
- Fully compliant with defense and public-sector procurement requirements.
- Offline or air-gapped deployments enable secure visualization and analytics in isolated or classified networks.
- Proprietary rendering technology with no third-party dependencies ensures complete data sovereignty and control.
Trusted By Industry Leaders


Built for Mission-Critical SIGINT Intelligence
A GPU-accelerated visualization engine enabling real-time signal, radar, and telemetry analysis — even in offline or air-gapped environments.
Operational Deployments & Case Studies
Proven across multiple NATO and allied programs, SciChart powers real-time intelligence and signal visualization in mission-critical systems worldwide.

NAVAIR / US Navy
Accelerated Signal Processing & Tactical Readiness
Integrated into the GRAMS and MAC-E systems, SciChart enables precise underwater acoustic analysis and live tactical visualization for anti-submarine warfare and crew training. The charts process high-volume sonar and telemetry data in real-time, improving situational awareness and tactical responsiveness.
By supporting multi-sensor data fusion and rapid signal correlation, SciChart contributes to faster decision-making and enhanced readiness across the Navy’s acoustic intelligence operations.

Germany / SIGINT
Enhanced Situational Awareness & Airborne Data Fusion
Used by the German military for airborne intelligence systems, SciChart’s high-performance React dashboards deliver real-time frequency monitoring and signal detection for defense operations. The system visualizes wideband RF data streams and supports in-flight data fusion for threat recognition and mission replay.
By handling dense, continuous signal loads with zero-frame loss, SciChart ensures clarity and precision in dynamic operational environments, strengthening intelligence and reconnaissance capabilities.

Keysight / RF SIGINT
Unified Visual Platform for Real-Time Testing & Field
Integrated across WPF, Mobile and JavaScript platforms, SciChart provides real-time frequency analysis, signal-strength monitoring, and layered data visualization for Keysight’s RF SIGINT operations. These dashboards enhance situational awareness and streamline decision-making across modern army and air force use cases.
By visualizing complex electromagnetic environments with sub-millisecond latency, SciChart enables detection, demodulation and analysis of diverse signals in the field. The solution supports wide frequency coverage and dynamic data processing, delivering a scalable, reliable toolset for mission-critical electronic warfare and intelligence operations.
Unmatched Speed. Absolute Control.
Synchronizing hundreds of real-time data streams across WPF, JavaScript, iOS, Android, and Linux enables sensor fusion, mission playback, and situational awareness in secure, classified environments.
SIGINT Chart Examples
Explore real-world charting examples built with SciChart to see how defense and intelligence teams analyze complex signal data in real time. From frequency monitoring and direction finding to radar threat visualization, these examples showcase the rendering precision, responsiveness and scalability required in modern SIGINT environments.
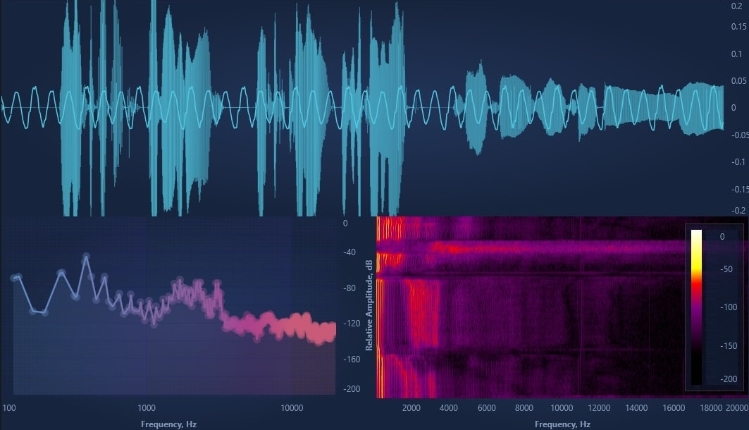
Real-Time Signal Analyzer
Build Adaptive Dashboards
SIGINT data dashboards display live frequency data using FFTs, heatmaps and synchronized channels — ideal for Electronic Surveillance and CEMA dashboards where real-time accuracy is critical.
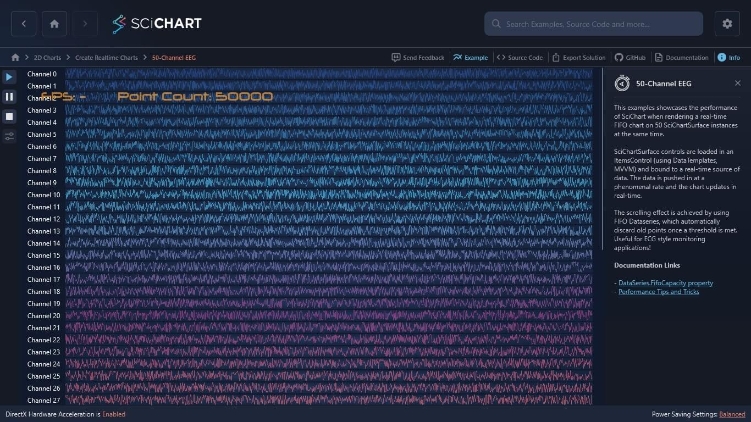
50 Channel Example
Build Complex Real-Time Multi-Channel Applications
Visualizes dozens of simultaneous input streams without frame loss; perfect for multi-channel intercept systems and telemetry aggregation tools.

Polar and Radial Signal Visualization
Build Radar Systems and Integrated Platforms
Provides the basis for Electronic Warfare and radar analysis, mapping signal direction, beam shape and interference patterns for situational awareness.
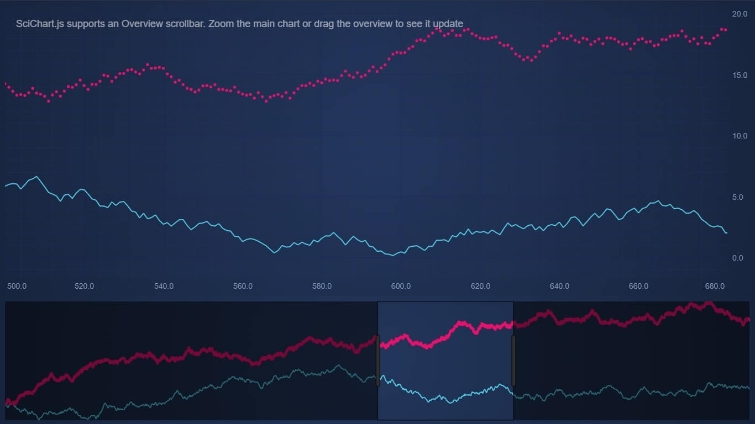
Zoom and Pan with Overview Chart
Build Complex Real-Time Multi-Channel Applications
Enables analysts to investigate narrowband anomalies while maintaining full-spectrum context — essential for long-duration signal recording and analysis.
What SciChart Offers Developers
SciChart combines powerful charting software with comprehensive support, designed to meet the needs of developers and enterprise teams — here’s what you can expect:

Performance & Support When You Need It
SciChart combines powerful charting software with comprehensive support, designed to meet the needs of developers:
- .NET, iOS, Android, JavaScript, third-party libraries.
- Hardware-accelerated rendering (GPU)
- High-performance, optimized for large datasets and real-time rendering
- Handles datasets of 100M+ points
- Real-time data support and live updates
- 64 bit processor
- Renders 100s of real-time dashboards up to 60 FPS
- Supports over 100 WebGL charts on the same page
- Dynamic LOD
- Fully documented
- Technical support
- Professional support, extensive documentation and examples
Extensive Charting Features
SciChart is packed with powerful features designed to handle complex data visualization with speed and precision:
- 2D plotting
- 3D plotting
- Active, searchable forums
- Animation of data
- Advanced annotations
- Custom series
- Custom zoom or pan behaviors
- Export / print
- Link multiple charts
- Legend customization
- Logarithmic Axis
- Multiple X-Axis
- Multiple Y-Axis
- Per-point coloring
- Programmatically change viewport
- Theme or template customization
- Tooltips
- Touch interaction
5-Star Support for Developers
When you push the boundaries of charting, you may need access to additional resources to help you cross that boundary.
That’s why we ensure you can always access the information and support you need — when you need it.
If you are working in mission-critical environments where time is critical, we can also discuss a Developer Support package tailored to your organization’s needs.
 Responsive 5-Star Technical Support
With our 5-star technical support subscription, we aim to answer all support tickets within one business day* and often even faster.
 Get Answers Fast with our AI Assistant
Ask our AI Assistant anything about SciChart and it will answer your questions fast!
 Knowlegable Support Forums
With nearly 4000 answered support requests on our public support forum, you’ll never be left without an answer.
 Extensive Documentation
1000s of pages of support documentation across all platforms for expert guidance on getting the most from SciChart.
 Tutorials & Videos
Our regularly updated YouTube channel will help you understand what’s possible and answers the most commonly asked questions.
 Hundreds of Example Charts
Over 350 chart examples will get you what you need to get out of the blocks more quickly.
Testimonials & Reviews
See What Developers Are Saying About SciChart. Rated 5 Stars by Developers Worldwide.
With a rating of 4.8, SciChart is one of the highest rated chart libraries in the world*, used by over 10,000 expert developers worldwide.
Read All Reviews![]()
Queens Award for Innovation
Proud winners of the Queens Award for Innovation, 2019. Awarded on account of our innovative graphics engine which underpins the SciChart library and enables our world-beating charting performance
![]()
National Business Awards
Highly Commended for Lloyds National Business Awards, 2019. Awarded on account of our innovative graphics engine and impressive customer base
![]()
National Technology Awards
Awarded “Healthcare Tech of the Year” at the 2025 National Technology Awards – a top UK recognition for breakthrough innovation in technology.

Reviews
SciChart has received hundreds of verified, 3rd party reviews