Automotive Data Visualization Trusted Across the Industry
Real-time data visualization for vehicle telemetry that’s used by all the leading F1 racing teams, the companies that design and manufacture race car components, and big-name automotive engineers.
At sampling rates of 1000Hz across large sensor arrays, many visualization tools struggle to keep up. SciChart gives you the high-performance reliability you need. Our GPU-accelerated rendering engine supports 60 FPS, even when synchronizing multiple series and views.
- Compare more data streams at once
- Uncover more insights in real time
- Super-fast, accurate data rendering
- Build fully customizable dashboards
Trusted By Industry Leaders













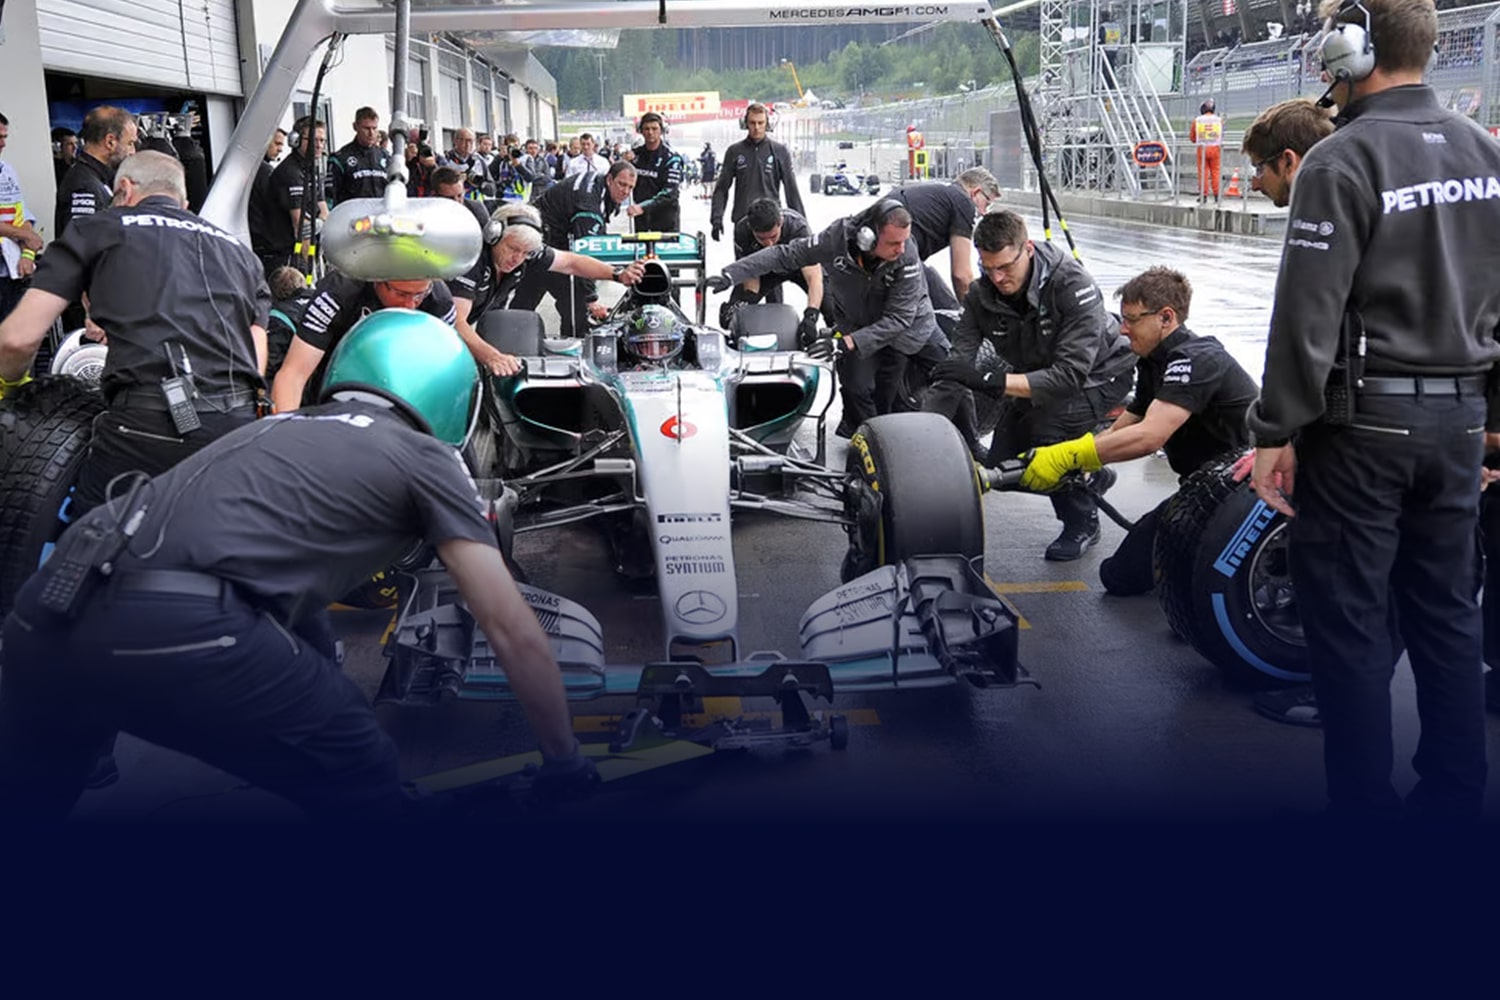
Motorsport Telemetry & Race Strategy Dashboards
All leading F1 teams use SciChart to help them win championships and upgrade old systems.
We’ve supported record-breaking wins and podium places with innovative race strategy software for F1 analysis and pit management.
When winning can be measured in milliseconds, the only way to improve is to extract as much information as possible. Hundreds of real-time sensors can supply millions of data points.
SciChart gives you the tools you need to respond in real time. No lagging, just super-fast refresh rates on telemetry.
Add custom functions and interactions and synchronize multiple data streams. Get the right insights to stand out with intuitive, event-driven color schemes, annotations and overlays.
All this supports better simulations, backtesting and real-time race analysis. Additionally, this is compatible with any time series database.
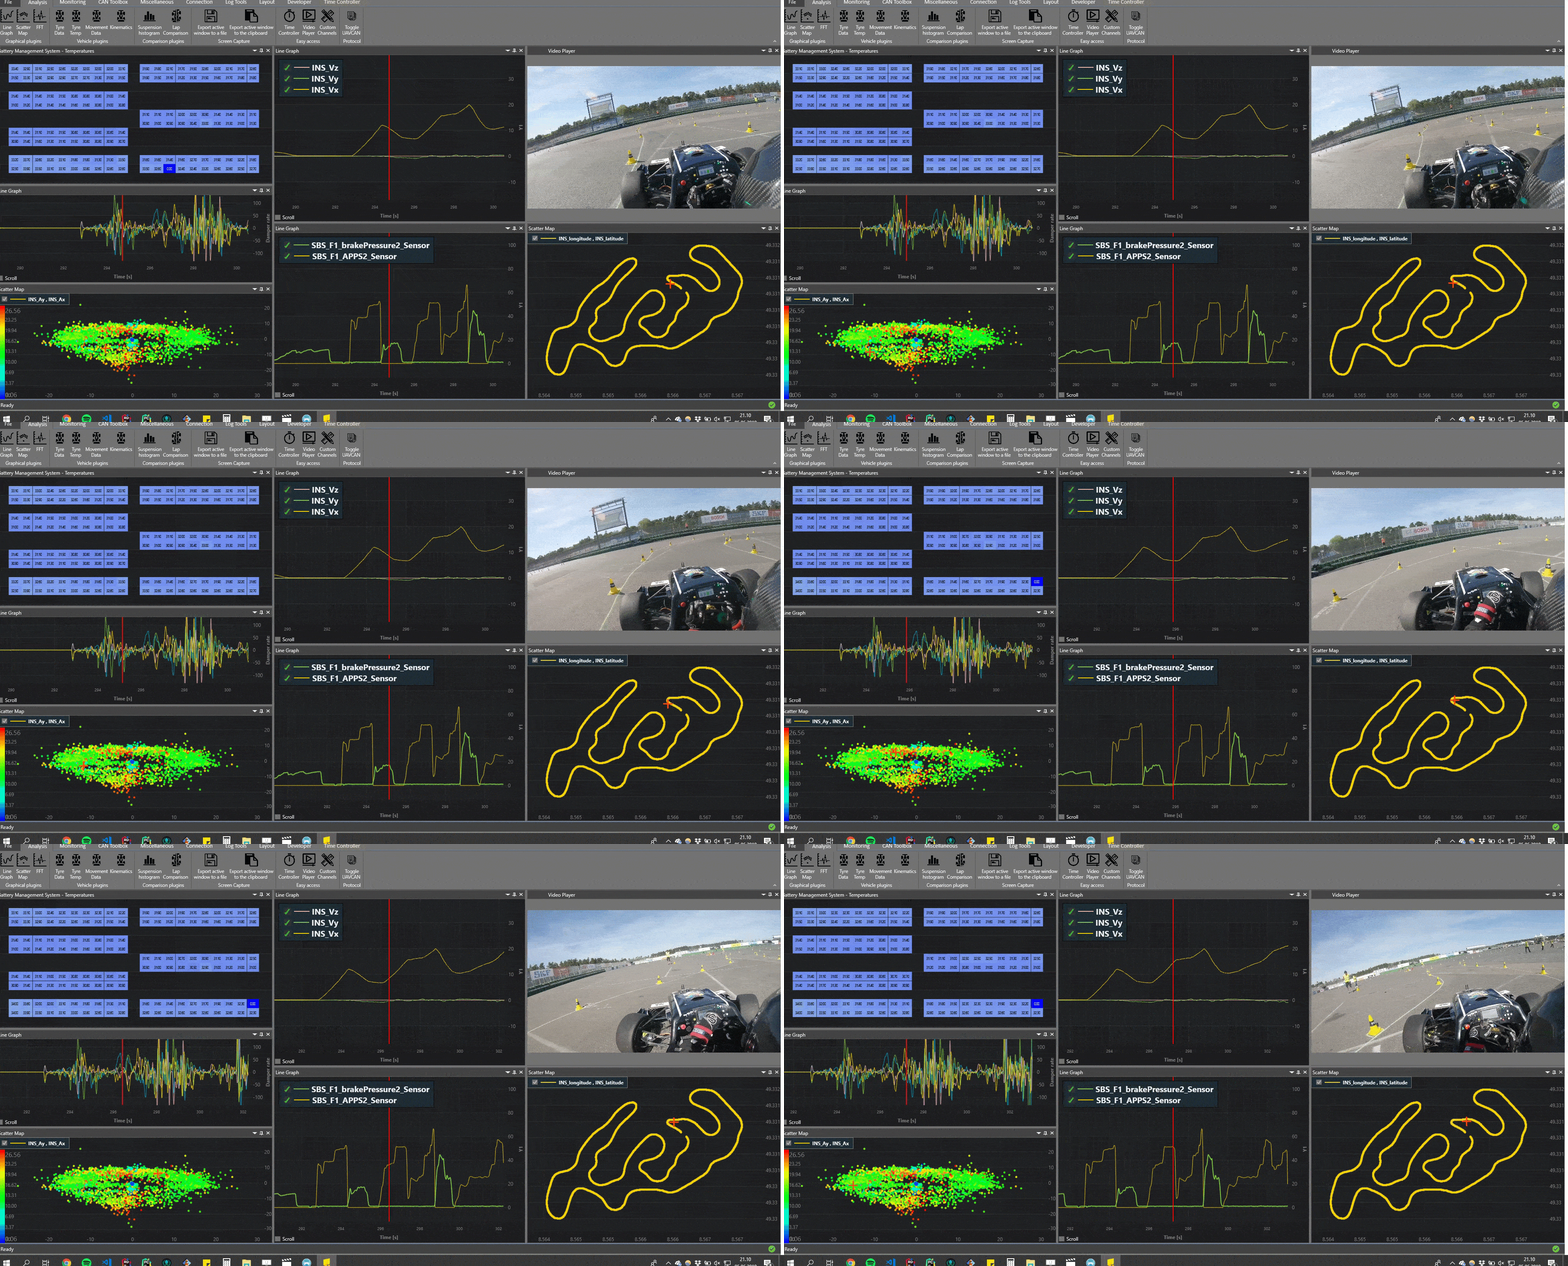
Supporting the Next Generation of Racing Engineers
The next generation of motorsport and automotive enthusiasts need engineers and developers trained in SciChart too, which is why we’re proud to sponsor over a dozen student race engineer teams, such as Revolve NTNU.
This ensures your newest hires already know our product.
SciChart helps to power the next generation of race strategy experts. We helped Revolve NTNU visualize data from more than 300 sensors on a race car simultaneously.
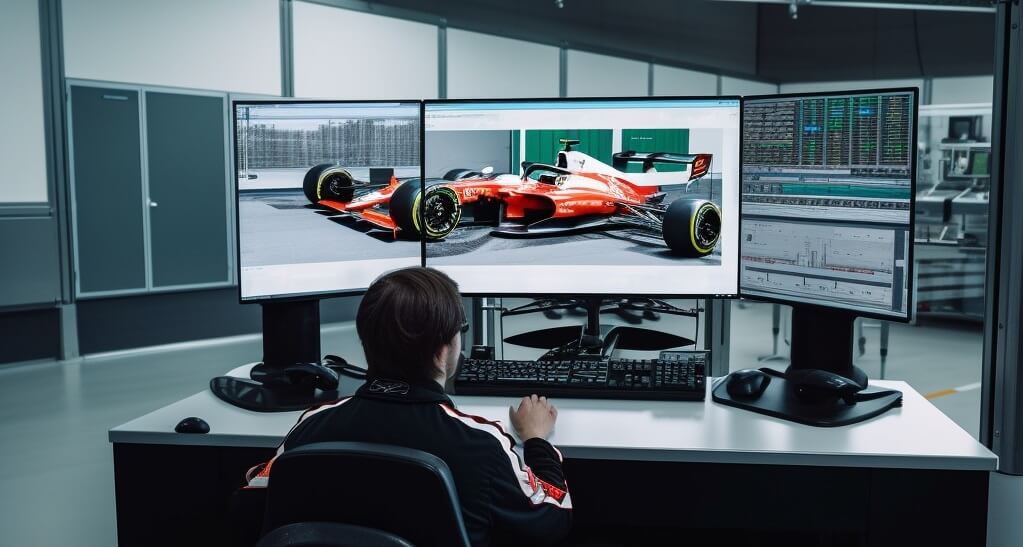
Automotive Data Visualization for Award-Winning Car Design
End-to-End, our customers are pioneering the next generation of motorsport and vehicle design. SciChart’s software supports engine design, wind tunnel analysis, brake systems, tyre manufacturing, tooling manufacturing, sound systems, and more.
Honda R&D uses SciChart in their award-winning engine design, which powers championship-winning cars.
It’s the very same patents and technologies that make their way down to the consumer sector, improving safety, efficiency and ultimately reducing costs.
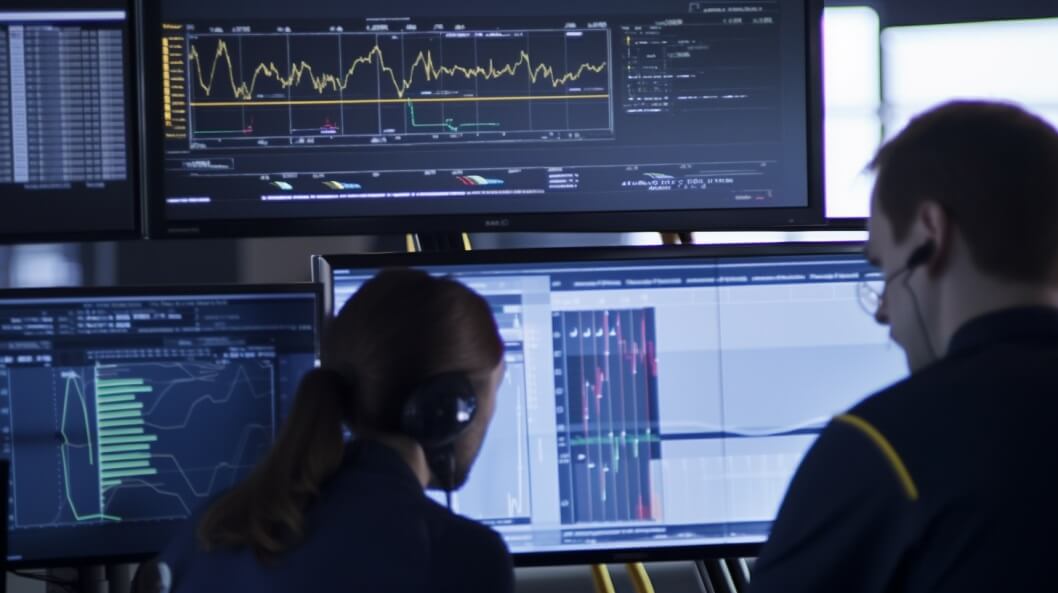
Vehicle Design, Engine R&D and Control System Data
SciChart is used to visualize high-frequency data generated across vehicle development workflows, supporting electric, hydrogen, and internal combustion systems in research, design, and testing environments. Use cases include:
- Engine design and performance analysis
- Aerodynamic data analysis
- Regenerative braking system analysis
- Materials testing and evaluation
- EV and battery system data analysis
- Tyre degradation monitoring
SciChart provides high-performance data visualization for large and real-time datasets. It can be integrated into custom engineering applications, enabling engineers and analysts to analyse data during research and testing workflows with consistent performance and visual clarity.
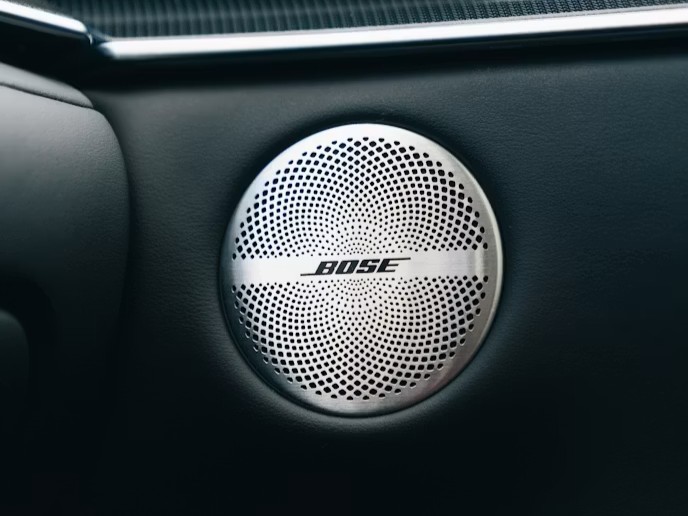
Automotive Audio & NVH Engineering
High-end automotive manufacturers and audio pioneers, including Bose and Harmon Kardon, rely on SciChart to design and optimize sophisticated sound systems.
By using real-time, ultra-low latency data visualization, engineers can accurately measure how sound waves interact with various interior trims and materials.
This precision allows engineers to isolate vibrations and perfect audio distribution.
Whether configuring bespoke setups for luxury vehicles or calibrating standard systems, SciChart delivers the visual clarity needed to support the next generation of automotive audio.
Motorsport & Automotive Case Studies
We’ve worked with the leading F1 teams, automotive engineers and student racing teams.

"Honestly one of those libraries that just gets out of your way. Performance with large datasets is genuinely impressive — smooth and responsive without any tricks or workarounds. The API clicked quickly and the docs are actually good, which is rarer than it should be. Every chart type I've needed has been there, and the visual quality is great. Hard to imagine reaching for anything else at this point.” Christian L

See the Difference with SciChart
Think SciChart could help move your pioneering car design, manufacturing or racing goals forward? Schedule a consultation to see what’s possible.
Vehicle Telemetry Examples, Demos & Features
When off the shelf solutions fail, we provide bespoke features and custom integrations.
Browse our extensive charting options and customizable features.
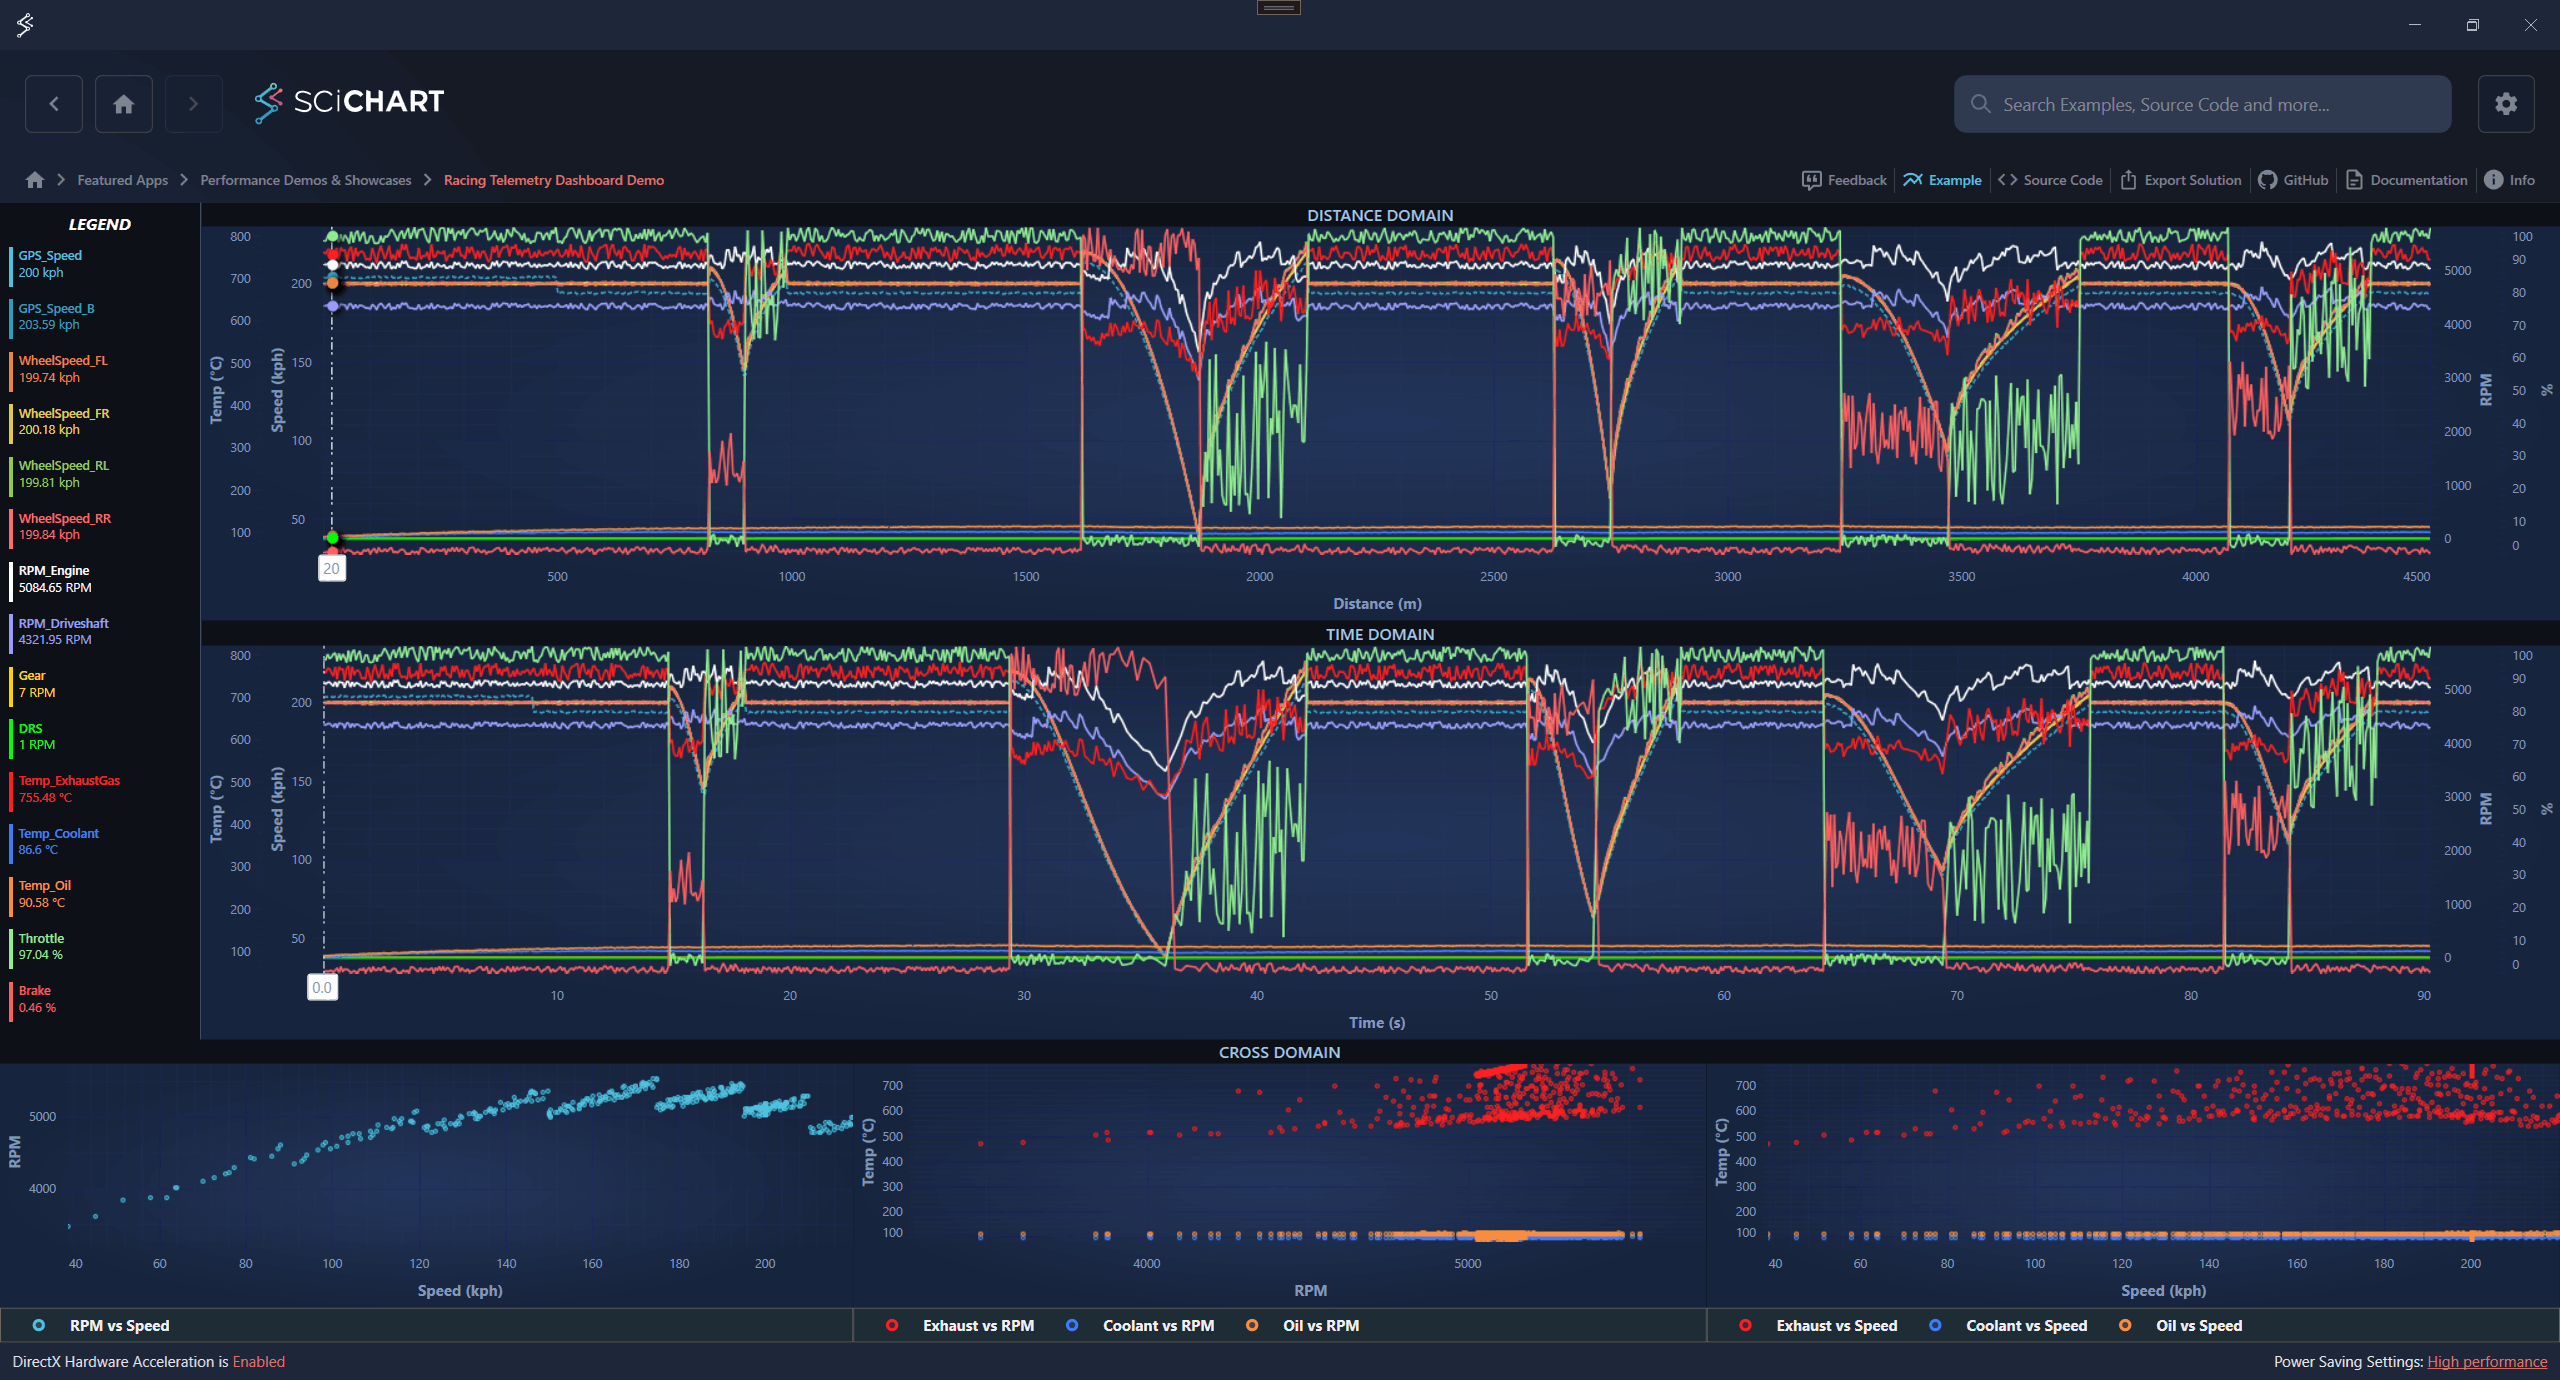
Real-time Lap Dashboards
Visualize how the car behaves over the course of a lap and compare with previous laps in real time.
By building a lap-by-lap comparison tool with SciChart, you can see the bigger picture of the vehicle’s energy management, driver performance, lap times and temperature development.
With SciChart, you can visualize all the crucial motorsport performance data, including Delta-t, track maps with gradients, metric development over race duration and car speed trace with distance as X-axis.
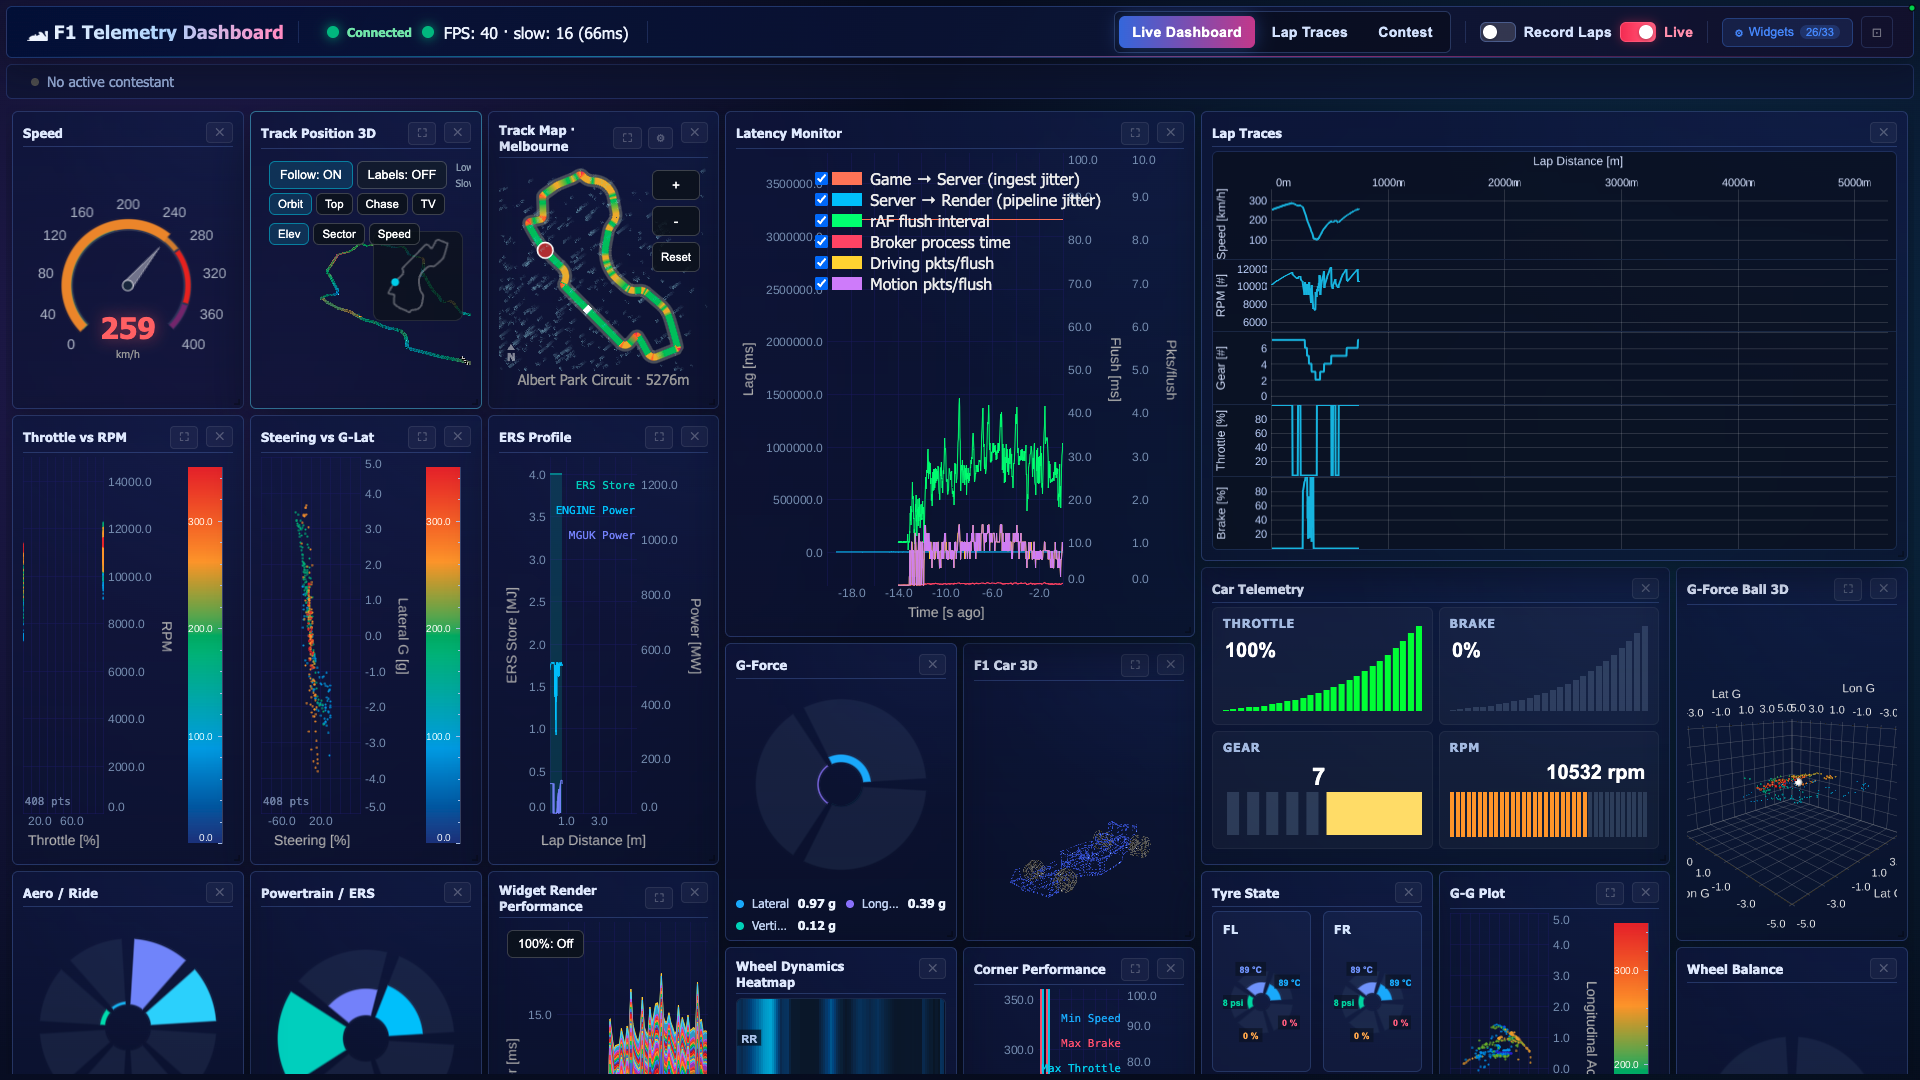
Enhanced Customizations
SciChart allows you to create dashboards of complex 2D and 3D data visualizations, including line, scatter and heatmap charts. You can effortlessly display thousands of lines on a single chart.
Our chart series supports interactions, including hover-over and selection callbacks. With our chart customizations, you’ll be able to display XY datasets, color points, create custom time markers and add labels and annotations.
Why Automotive Engineering Teams Choose SciChart
Take a look at the chart performance you can achieve with SciChart and how our extensive features contribute to fully customizable charts.

Chart Performance
- Extensive Charting Features
- GPU-accelerated
- WebAssembly-powered
- Sub-millisecond interactivity even on larger datasets
- 2.3MB bundle size
- Float64 array and FIFO mode for enhanced data efficiency
- Cross-platform performance across JavaScript, WPF/.NET, and iOS/Android
- Continuous streaming
- Deterministic rendering
- Visualize 100 M+ points per dataset
- Continuous 24/7 operation
- Sustain 200k points per second
- Refresh 64+ charts in under one second
- Embeddable within MES, YMS, and ATE systems
- Direct integration into React, Angular, and Vue
Extensive Charting Features
- 2D & 3D plotting
- Animation of data
- Annotations on chart
- Zoom & pan
- Tooltips
- Touch interaction
- Link multiple charts
- Legend customization
- Logarithmic axis
- Multiple Y-Axis
- Per-point coloring
- Programmatically change viewport
- Theme or template customization
5-Star Support for Automotive Engineers
See the level of support developers get when building real-time chart solutions.
 Responsive 5-Star Technical Support
With our 5-star technical support subscription, we aim to answer all support tickets within one business day* and often even faster.
 Get Answers Fast with our AI Assistant
Ask our AI Assistant anything about SciChart and it will answer your questions fast!
 Knowledgeable Support Forums
With nearly 4000 answered support requests on our public support forum, you’ll never be left without an answer.
 Extensive Documentation
1000s of pages of support documentation across all platforms for expert guidance on getting the most from SciChart.
 Tutorials & Videos
Our regularly updated YouTube channel will help you understand what’s possible and answers the most commonly asked questions.
 Hundreds of Example Charts
Over 350 chart examples will get you what you need to get out of the blocks more quickly.
Testimonials & Reviews
Award Winning Software – Continually Rated Best with Hundreds of 5-Star Reviews
 4.9 Average - 425 Reviews
  4.7 Average - 9 Reviews
 4.4 Average - 4 Reviews
With a rating of 4.8, SciChart is one of the highest rated chart libraries in the world*, used by over 10,000 expert developers worldwide.
Read All Reviews