Read on to see how to Revolve NTNU used SciCharts High Performance WPF Charting Library to handle their complex data from over 300 sensors in their Race Car.
Platform: WPF
Industry: Engineering, Formula Student
Revolve NTNU Norwegian University of Science & Technology is an independent student organization engaged in Formula Student, Europe’s most established educational motorsport competition. Creating new iterations of their Race Car each year, Revolve needed to be able to visualization their multi-stream, high-bandwidth data from their hundreds of sensors in Realtime to ensure top performance and allow for torque vectoring and testing of their car.
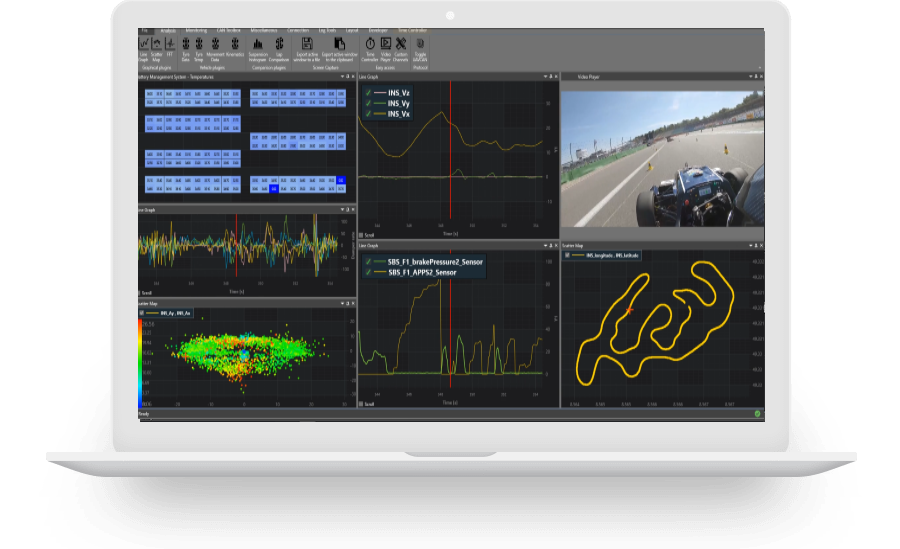
Challenge: Revolve needed a charting tool that could handle the visualization of data from over 300 sensors in linegraphs, scatter plots and heatmaps all in Realtime. Sensors mounted inside the Formula Student Race Car output data covering temperature, voltage and torque during a race and needed to be analysed on a smooth UI whilst allowing for annotations and overlays.
Solution: SciChart’s High Performance WPF charts were used to smoothly handle the data from all 300+ sensors in Realtime. Multi-series, High-Bandwidth data was interpreted and annotated with help of rich core WPF charting API allowing for performance analysis and testing. Combined with the comprehensive documentation and tech support, the students at Revolve found SciChart easy to use and integrate into their custom systems.
