HMI & SCADA Big Data Analysis Powered by SciChart
With SciChart’s GPU-accelerated chart library, you can achieve reliable, real-time HMI and SCADA big data visualizations at scale (even with zooming, panning, and interactions). Our technology helps organizations optimize operations, predict issues, and make informed decisions.
- 24/7 operational stability and proven performance for big data visualization.
- Manage over 100 million points from SCADA signals and sensors.
- Accuracy, zero memory growth, stable frame rates, continuous streaming and real-time data.
- Suitable for client controlled, offline and on-premises environments, including air gapped.
- Maintains performance on devices that cannot run on typical desktop GPU loads.
- Efficient performance that allows for upgrades on legacy or low cost hardware.
- Permissive licensing modules for all requirements.
- Deploy the Visual Xccelerator™ Engine across browser, desktop, and mobile.
Trusted By Industry Leaders


Efficient HMI & SCADA Data Analysis Starts with SciChart
Every facet of our chart library factors in how more data can be processed faster. Over a decade of pushing the boundaries has led to us offering the fastest SCADA data visualizations used by half of Fortune 500 companies in the Oil & Gas sector, as well as the energy and automation sectors.

Built for Today’s HMI/SCADA Challenges & Demands
HMI and SCADA systems are safety critical. That’s why stability, predictability and determinism matters. SciChart supports the evolving challenges and demands in industrial automation.
Targets for safety compliance means that there’s no room for system crashes, instability or fluctuations. Reducing compliance breaches or downtime starts with using a reliable real-time data visualization software.
SciChart supports 100 million points per second with 24/7 stability. Our 64-bit library also secures the precision needed to make informed decisions.
If your current system isn’t designed for scale, making the switch to SciChart ensures performance and efficiency in data processing while reducing costs and improving business outcomes.
Try SciChart today to see the difference in performance and precision for your SCADA big data analysis.
Optimized for Embedded HMI’s & Low-Power Industrial Hardware
When current SCADA systems fail, it’s often because they’re old, CPU bound and not capable of real-time analytics. They’re unable to ingest larger sensor streams and are visually static.
To maximize existing hardware, we provide lossless downsampling and FIFO streaming – compatible even with low power hardware, embedded systems and edge deployments. Thanks to our dynamic rendering algorithm selection, SciChart is the only high-performance charting component to include proprietary lossless adaptive resampling.
If you want to push past the essential data, and unlock the more exciting insights, SciChart offers the legacy system upgrade that you’ve been looking for.

Where SciChart Powers SCADA Big Data Analysis
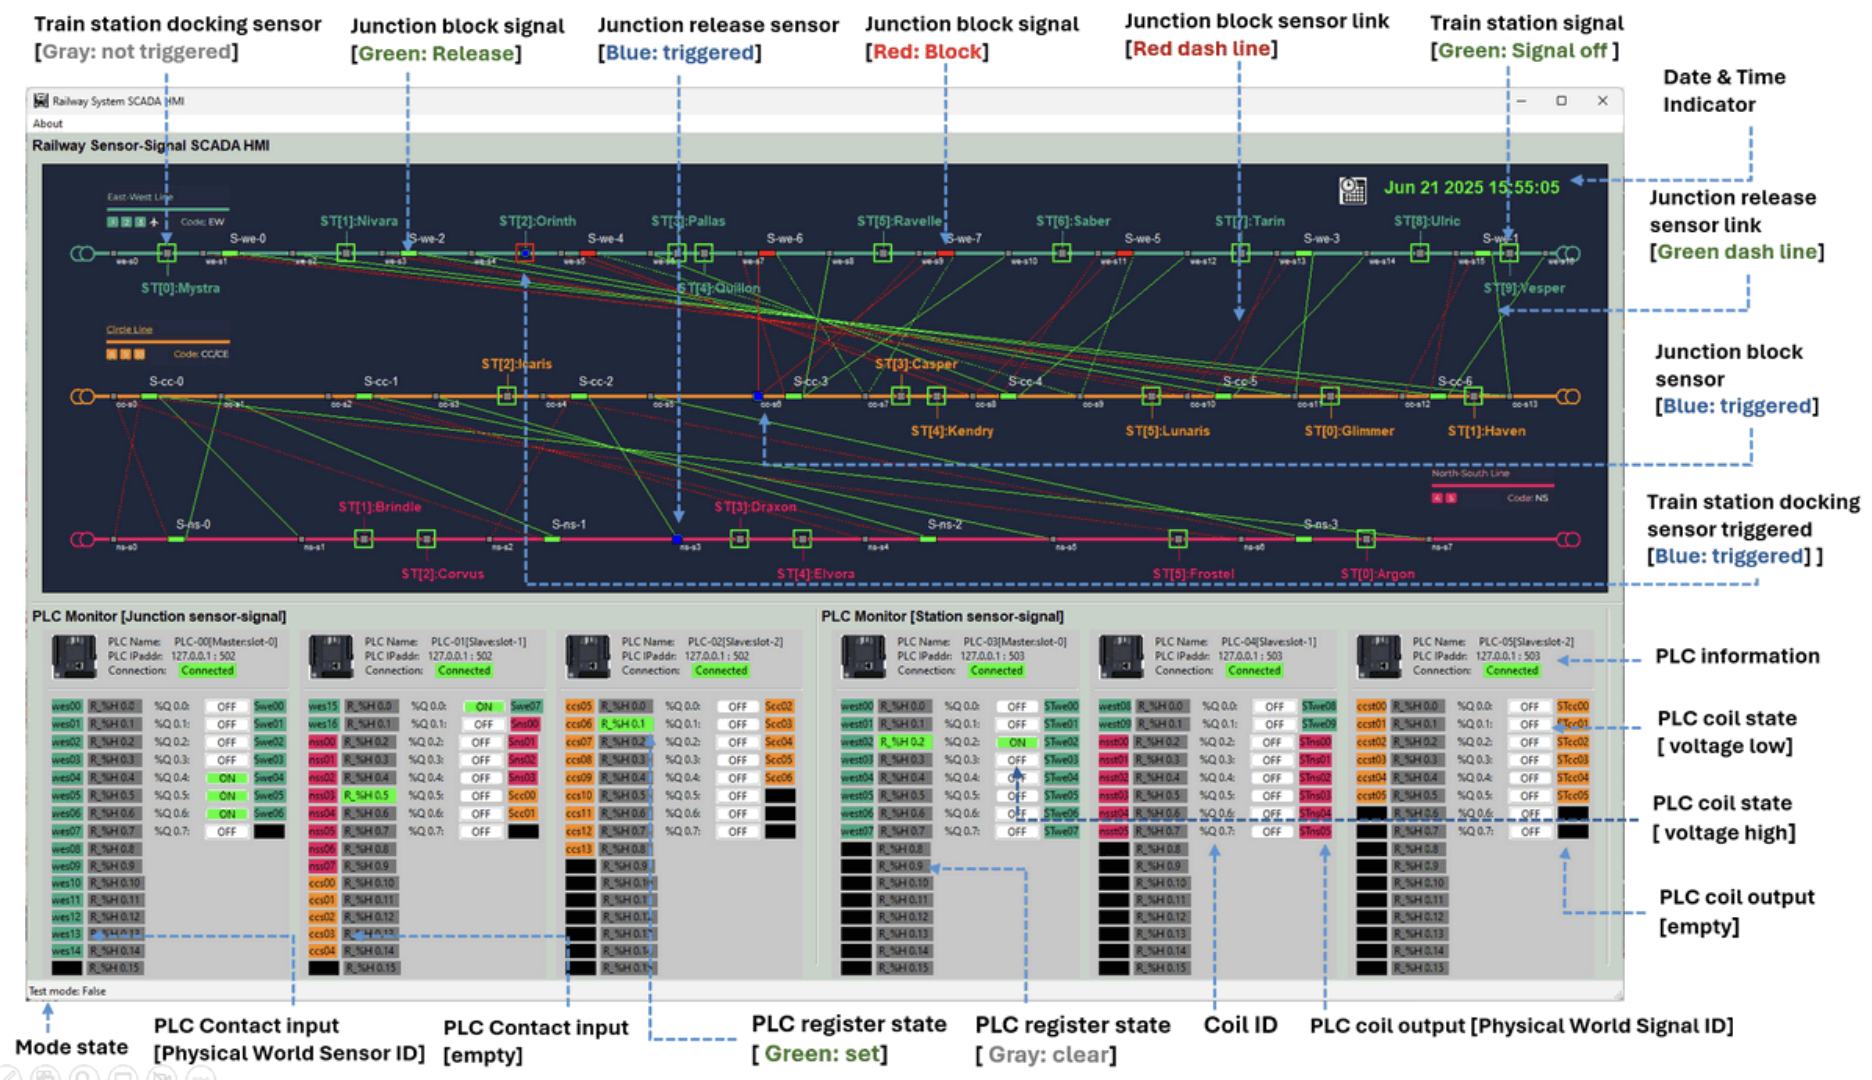
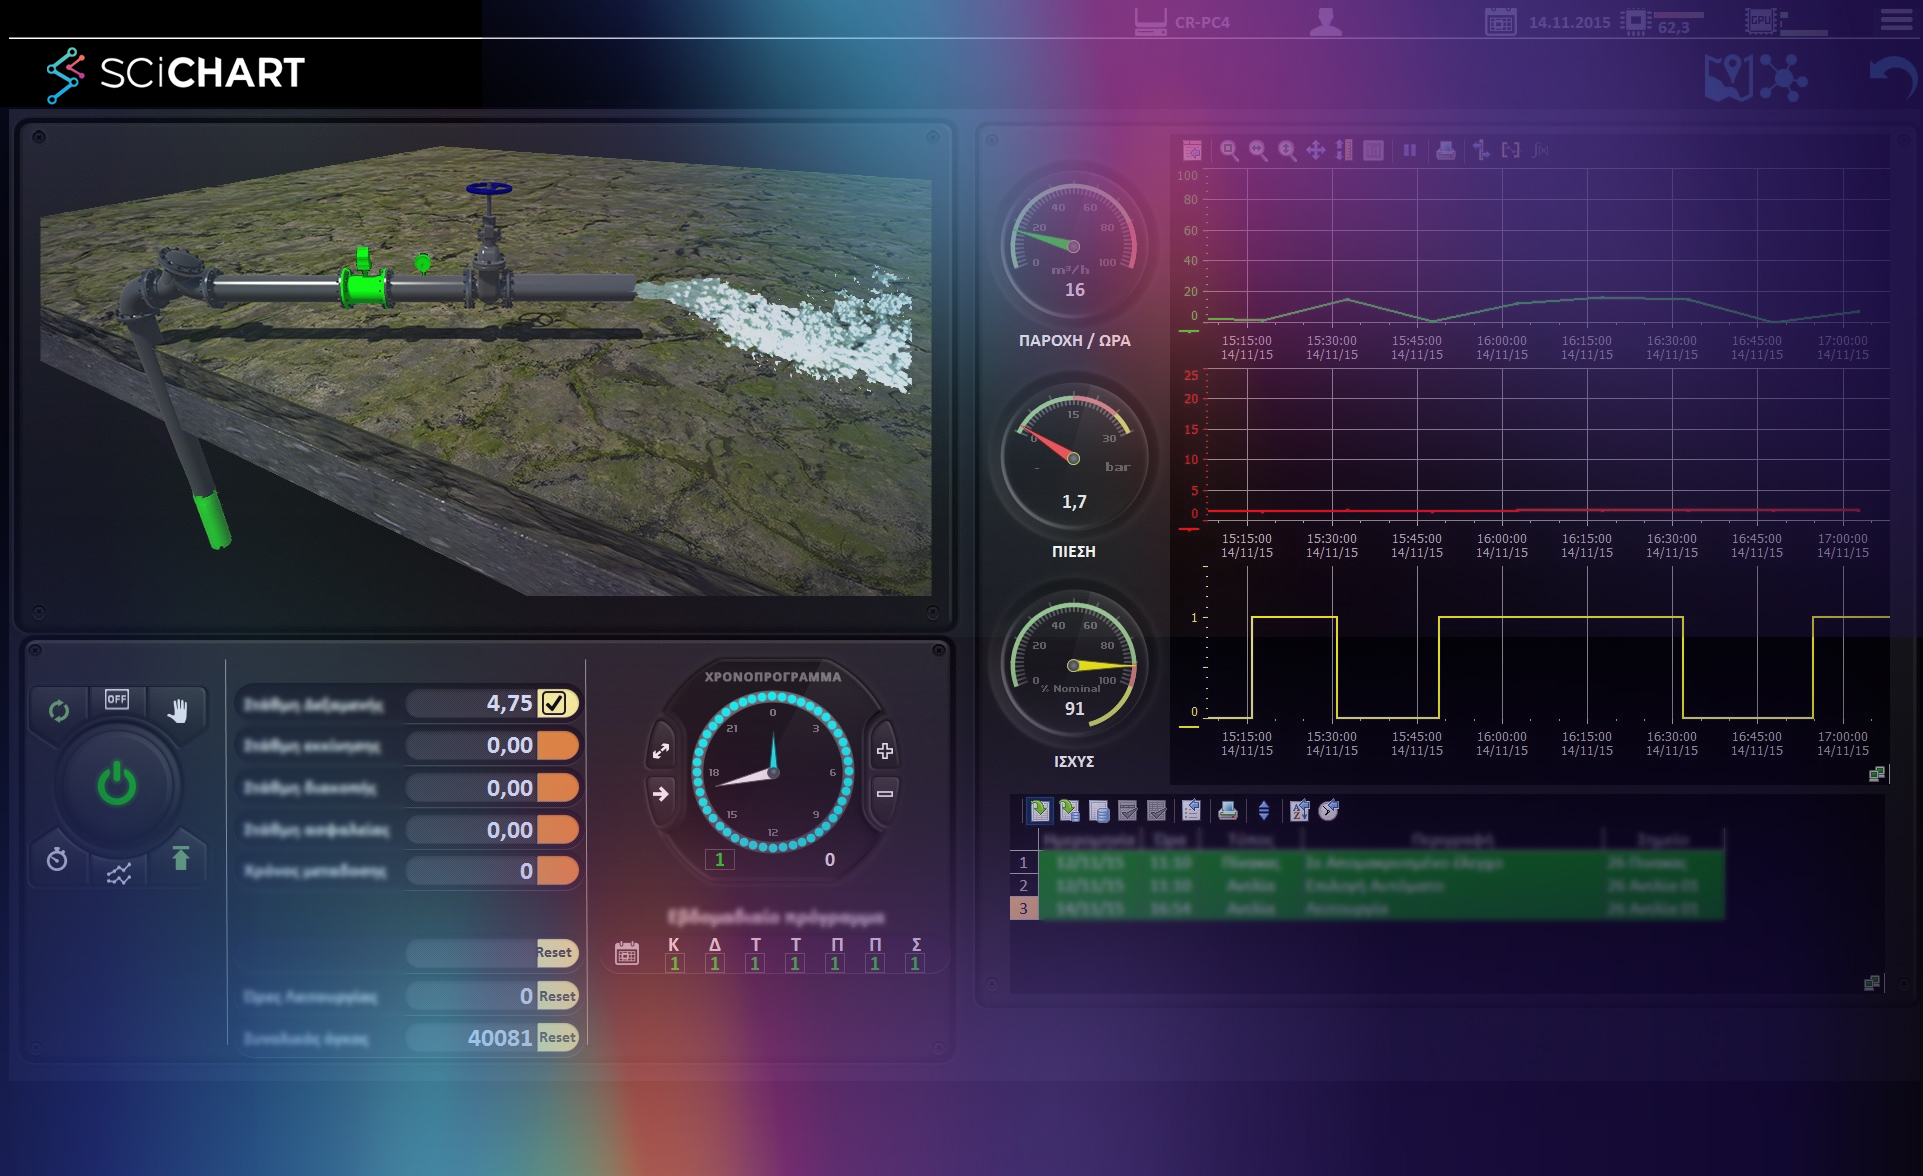
HMI and SCADA big data visualizations powered by SciChart render real-time data for some of the world’s largest energy producers. Applications include real-time vibration monitoring, power grid frequency stability charts, pump station monitoring and logic analyzer visualization through PLC waveforms.
- Power & Energy Plants: Remotely monitor, control, and manage energy distribution in real-time. SciChart supports 60 FPS for over 100 million data points for fossil fuel, nuclear and renewable energy plants. The result? Operational stability, improved performance and grid compliance.
- Oil & Gas: Transform raw well data into actionable insights. SciChart supports remote monitoring and control of drilling, pumping, and pipeline flow with exceptional real-time data accuracy and reliability. Achieving precision using float64, your analysis can improve operational safety and performance at your site.
Other sectors that benefit from SciChart’s GPU-accelerated engine for HMI data visualization, include manufacturing, chemical plants, water treatment, pharmaceuticals, mining, transport and aerospace test rigs.
Real-Life Applications & Benefits
With a high-performance chart library built for HMI and SCADA big data applications, you can address your challenges and achieve the following outcomes:
- Reduce hardware costs and downtime
- Keep existing hardware and upgrade software
- Enable more features by offsetting UI workloads to the GPU
- Modernize your charts through new AI overlays and features
- Achieve faster diagnostics and earlier anomaly detection
- Create safer operations
- Improve operator decision making
- Extend the lifespan of existing SCADA infrastructure
All this helps you to do more with less so you can fulfil regulatory compliance and efficient HMI and SCADA operations.
I researched chart controls and tested out the trial versions of SciChart, LightningChart, and Syncfusion and decided that SciChart was far superior to the other options. The more I use it, the more impressed I am by your product.
Ready to Enhance Your SCADA Data Analysis?
If you didn’t think you could reach past one million data points in real-time without lag, think again.
SciChart has been redefining what’s possible since 2012. With our GPU-accelerated rendering engine, you get more functionality that enables more simultaneous processes.
Ready to build more complex visualizations, enable annotations and zoom and pan through historical data sets without lag? With SciChart, you can.
If other chart libraries let you down in the past, give SciChart a try and see the difference for yourself. We excel where other chart libraries fail.
Get Your Free TrialSchedule Consultation
SCADA Big Data Visualization Examples
Showcase data from logic analyzers, waves, and signal visualization with a streamlined user experience. SciChart supports over 70 2D and 3D chart types, including Histograms, Mountain Charts with Draggable Thresholds, Charts with Vertically Stacked Axes, and Radar Charts for SCADA. SciChart also supports time-series, parametric charts, phasor charts and XY plots.
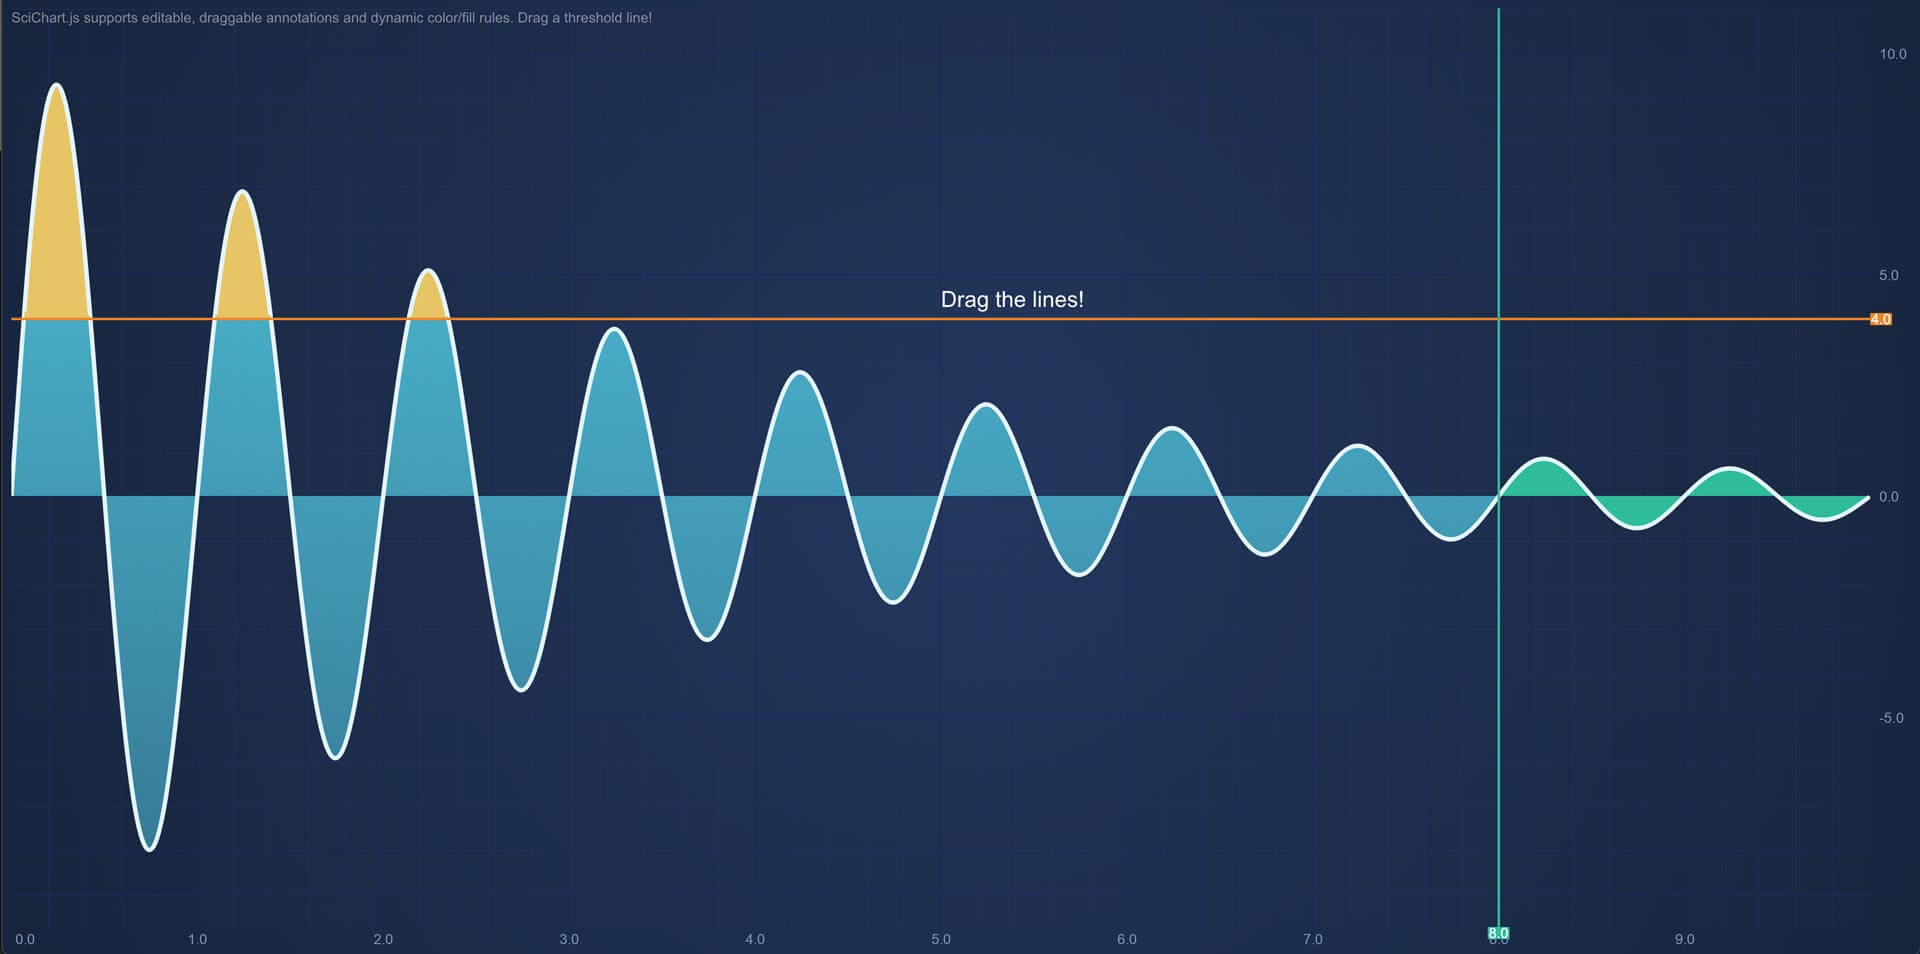
JavaScript Mountain Chart Draggable Thresholds
In SCADA and HMI design, operators need to define alarm setpoints without digging through complex menus. This JavaScript Mountain Chart with Draggable Thresholds functions as a dynamic visual interlock, allowing engineers to slide horizontal limits directly across the screen. When a process value, such as tank pressure or voltage exceeds the threshold, the area fill changes color instantly.
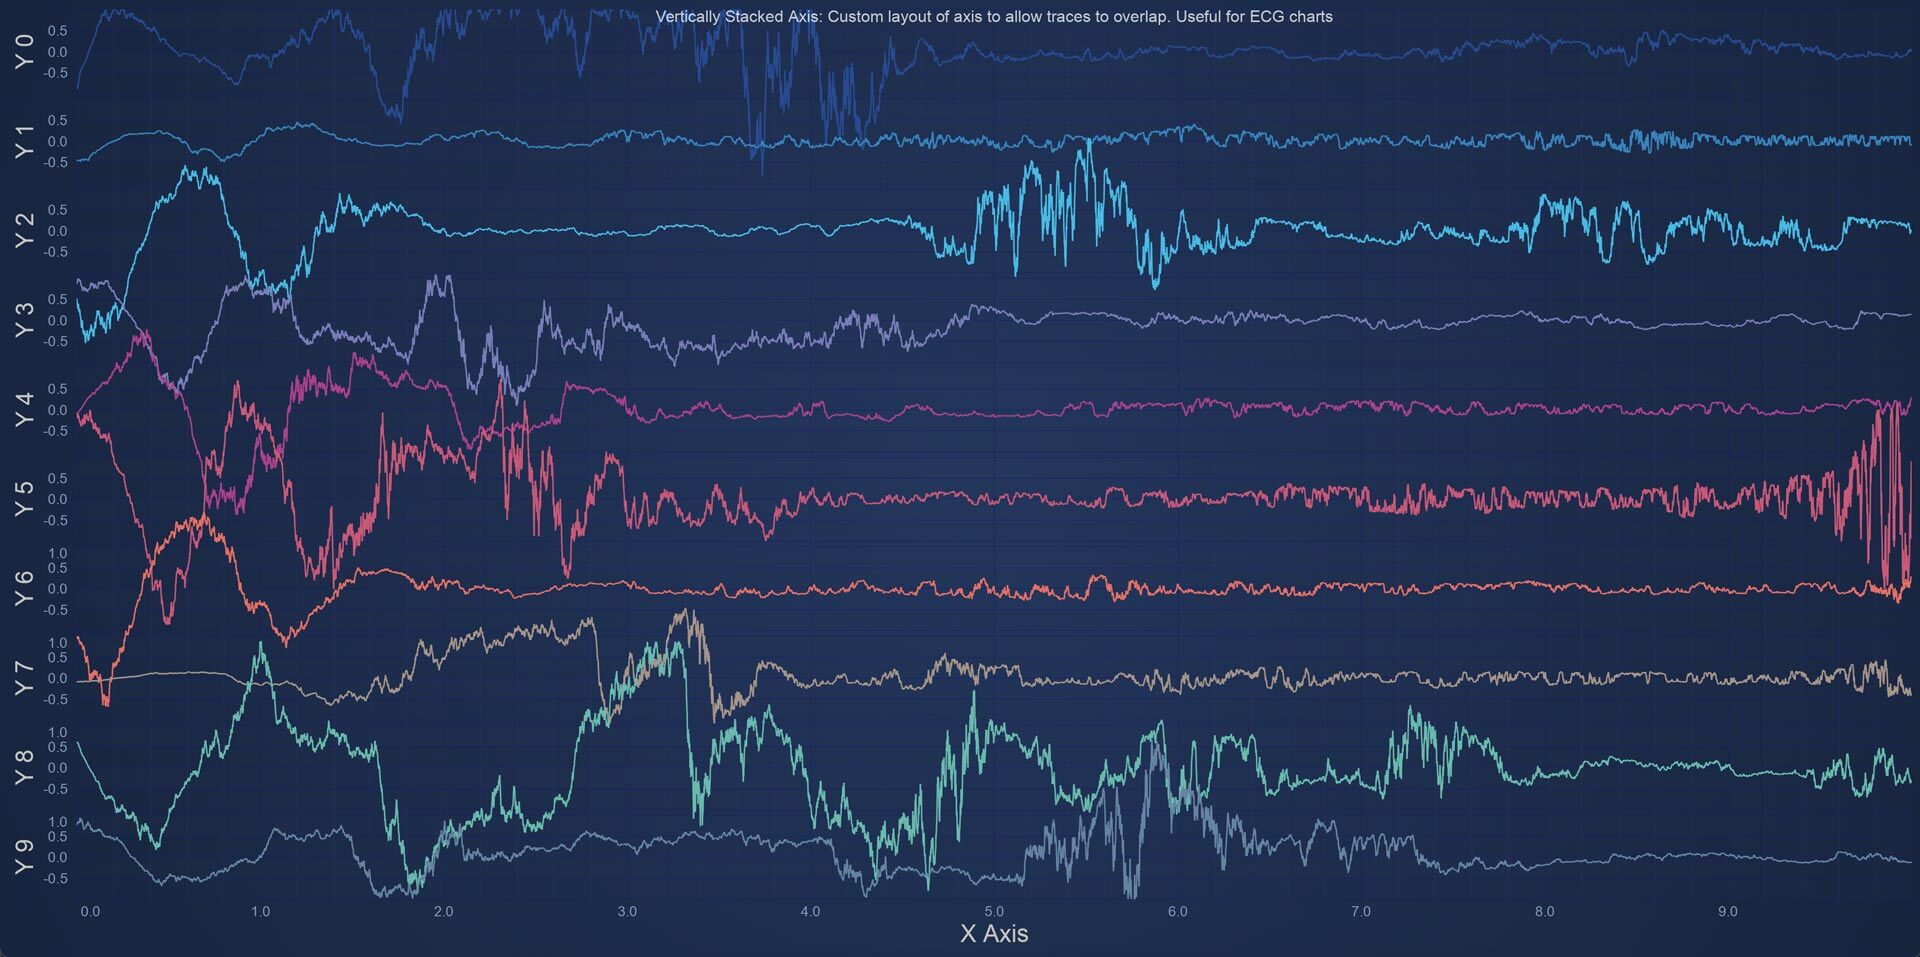
React Chart with Vertically Stacked Axes
When monitoring multiple variables, such as pressure, temperature, and flow this React Vertically Stacked Axes chart provides a clean visualization, isolating each data trace into its own vertical lane while maintaining a synchronized horizontal timeline.
This layout mirrors traditional strip chart recorders but adds the flexibility of a modern digital dashboard. You get the clarity of separate charts with the space-saving benefits of a single view.
What Features to Expect With SciChart?
SciChart’s Visual Xccelerator™ (Vx) engine addresses the common HMI and SCADA data visualization challenges through GPU acceleration, SIMD vectorisation, float64 precision, lossless adaptive resampling, a cross-platform C++ architecture, and dynamic rendering algorithm selection. Take a look at the chart performance metrics you can achieve with SciChart and how our extensive charting features contribute to fully customizable SCADA data visualizations.

Chart Performance
- Zero memory growth
- GPU-accelerated
- WebAssembly-powered
- Sub-millisecond interactivity
- Proprietary lossless adaptive resampling
- 2.3MB bundle size
- Float64 array and FIFO mode for enhanced data efficiency
- Cross-platform performance across JavaScript, WPF/.NET, and iOS/Android
- Continuous streaming
- Deterministic rendering
- Visualize 100 M+ points per dataset
- Continuous 24/7 operation
- Sustain 200k points per second
- Refresh 64+ SPC charts in under one second
- Embeddable within MES, YMS, and ATE systems
- Direct integration into React, Angular, and Vue
Extensive Charting Features
- 2D & 3D plotting
- Animation of data
- Annotations on chart
- Zoom & pan
- Tooltips
- Touch interaction
- Link multiple charts
- Legend customization
- Logarithmic axis
- Multiple X & Y-Axis
- Per-point coloring
- Programmatically change viewport
- Theme or template customization
5-Star Support for Developers
See the level of support engineers experience with big data SCADA visualizations and industrial deployments.
 Responsive 5-Star Technical Support
With our 5-star technical support subscription, we aim to answer all support tickets within one business day* and often even faster.
 Get Answers Fast with our AI Assistant
Ask our AI Assistant anything about SciChart and it will answer your questions fast!
 Knowlegable Support Forums
With nearly 4000 answered support requests on our public support forum, you’ll never be left without an answer.
 Extensive Documentation
1000s of pages of support documentation across all platforms for expert guidance on getting the most from SciChart.
 Tutorials & Videos
Our regularly updated YouTube channel will help you understand what’s possible and answers the most commonly asked questions.
 Hundreds of Example Charts
Over 350 chart examples will get you what you need to get out of the blocks more quickly.
Testimonials & Reviews
Award Winning Software – Continually Rated Best with Hundreds of 5-Star Reviews
With a rating of 4.8, SciChart is one of the highest rated chart libraries in the world*, used by over 10,000 expert developers worldwide.
Read All Reviews![]()
Queens Award for Innovation
Proud winners of the Queens Award for Innovation, 2019. Awarded on account of our innovative graphics engine which underpins the SciChart library and enables our world-beating charting performance
![]()
National Business Awards
Highly Commended for Lloyds National Business Awards, 2019. Awarded on account of our innovative graphics engine and impressive customer base
![]()
National Technology Awards
Awarded “Healthcare Tech of the Year” at the 2025 National Technology Awards – a top UK recognition for breakthrough innovation in technology.

Reviews
SciChart has received hundreds of verified, 3rd party reviews