Best Instrumentation Engineering Software for Accurate Data Visualization
By providing a solution for outdated or constrained legacy charting components, SciChart eliminates visualization bottlenecks, enabling the successful launch of new products and features that rely on higher sensor sampling rates. Reach over 100 million data points for high-performance visualization for large, high-frequency datasets for real-time monitoring and analysis. This protects product credibility and reduces operational risks associated with poor data visualization. Discover the best instrumentation software for accurate data visualization today.
- Support scientific and engineering‑grade visualization.
- Enable interactive inspection (zoom, cursors, overlays, multi‑axes).
- Scale with future instrument capabilities without rewrites.
- Handle real‑time, high‑density measurement data reliably.
- Embed directly inside commercial instrument software.
- Work across desktop (WPF) and web (JS) in industrial environments.
Trusted By Industry Leaders


SciChart Supports Your Industry Requirements
SciChart’s charting software is reliable for validating experiments, calibrations, and critical diagnostics, supporting better decision-making.

Process Automation & Industrial Instrumentation
Even one hour of downtime can cost thousands. Real-time, precise measurement of temperature and friction across your process automation plant prevents costly outages.
Monitor high-volume, multi-sensor data in real-time with GPU-accelerated speed.
- Use parameter-vs-time trends and instant alarms to catch maintenance needs early.
- Seamlessly zoom and pan through massive datasets for reliable, real-time diagnostics.
- Export precise, high-fidelity sensor data to ensure your operations stay safe, compliant, and efficient.
Where you need to visualize complex, high-volume data, SciChart is the best instrumentation engineering software for supporting machinery maintenance, efficiency, and safety compliance.

Analytical & Scientific Instrumentation
Your precision is your competitive edge. To lead in fields like aerospace, defense, and high-end optics, you need software that matches the rigor of your engineering. SciChart delivers the high-fidelity visualization you require.
- Native 64-bit precision transforms complex sensor data from lasers, chromatography, and telescopes into actionable insights.
- White-labeling capabilities allow you to maintain your brand’s identity while delivering a world-class user experience.
- Nanosecond-level processing turns large data sets into real-time, high-fidelity visualizations.
- Custom workflows designed specifically for the rigorous quality control standards of aerospace, defense, and laboratory science.
Achieve the micrometer-level accuracy your quality control demands with the best instrumentation software for scientific data analysis.

Test & Measurement Instrumentation
Electronic performance requires precision at the hardware and signal levels.
Our data visualization software helps you verify component authenticity and measure yield rates, to eliminate hardware failures.
For telecommunications and defense, our signal intelligence and RF mapping compatibility helps to identify dead spots.
- Maximize product reliability through rigorous semiconductor testing that guarantees component authenticity.
- Boost manufacturing profitability by optimizing yield rates and identifying performance fluctuations early.
- Eliminate connectivity gaps with precision RF analysis designed to expand signal coverage.
- Enhance strategic security using sophisticated SIGINT to interpret complex signal environments.
Our 64-bit, hardware-accelerated chart library supports semiconductor validation and advanced radiofrequency analysis to ensure your technology performs.

How Does SciChart Support Reliable Instrumentation Data Visualization?
SciChart lets you build sophisticated HMI big data visualizations and safety overlays that prevent costly downtime, convert more customers, and lets you keep legacy hardware for longer.
With SciChart, you can:
- Handle real-time data with high-fidelity 64-bit precision.
- Add overlays for safety and reporting.
- Create unique customizations within your software suite.
- Have more features running in the background.
- Avoid updating your hardware so frequently.
- Reduce technical risk.
- Accelerate product development.
See the Difference with SciChart
Deliver a professional software experience and reliable data visualization, even on outdated hardware. Try SciChart today and see the difference.
Instrumentation Engineering Examples & Demos
Discover examples and demos used for instrumentation engineering projects.
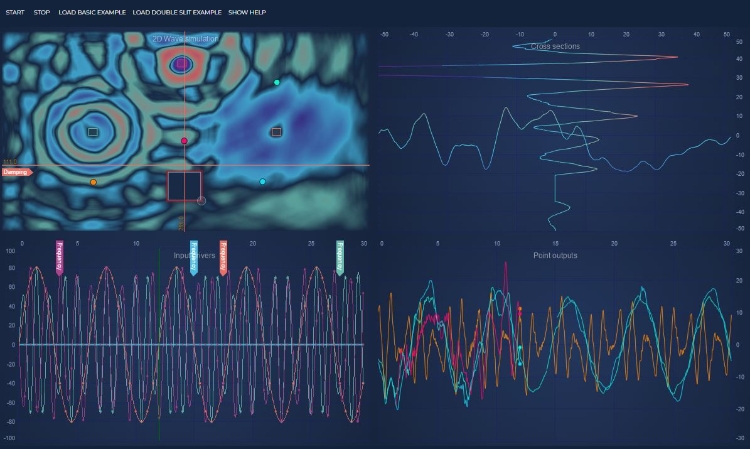
Process Automation & Industrial Instrumentation Time-Series Line Chart
Time-series line charts help with monitoring high-frequency sensor data. With SciChart, you can render these charts with over 100 million data points in real-time with minimal latency. This helps with the effective identification of transients or faults. By using FIFO series, the software efficiently manages memory by discarding older values while maintaining a continuous live stream of telemetry. This capability allows engineers to visualize multidimensional datasets, such as pressure, temperature, and flow.
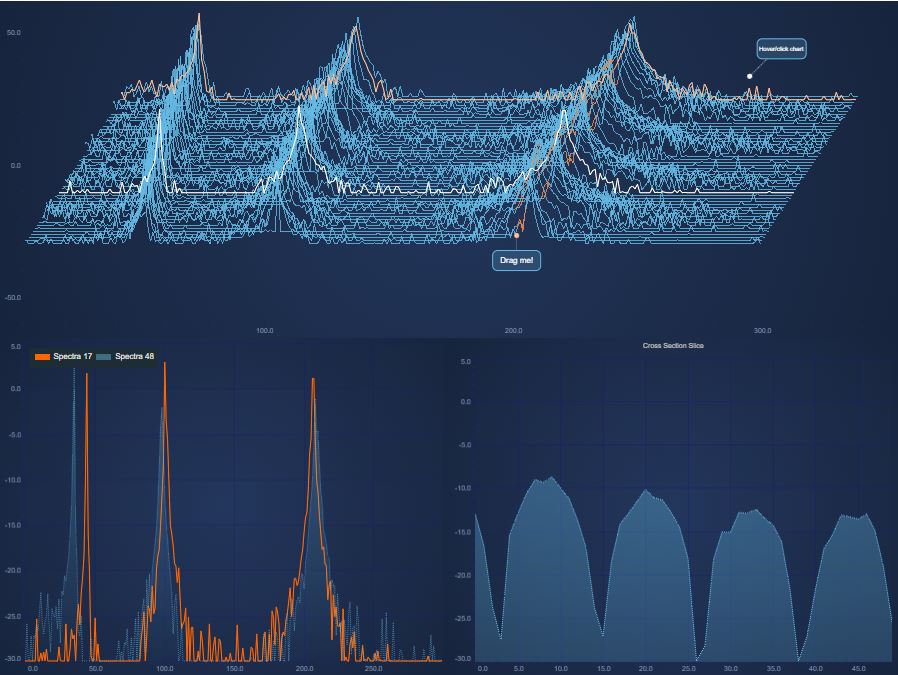
Test & Measurement Instrumentation High-Speed Waveform
This interactive waterfall display provides a high-fidelity visualization of signal evolution over time. By layering multiple spectral traces with coordinate offsets, the system creates a 3D perspective of the Power Spectral Density.
By interacting with the waterfall, users can instantly extract time-domain profiles for specific frequency bins or isolate instantaneous frequency slices. This supports root-cause analysis of timing jitter and spectral regrowth in complex RF environments.
What Features Does SciChart Offer Developers?
Take a look at the chart performance you can achieve with SciChart and how our extensive charting features contribute to fully customizable data visualizations.

Chart Performance
- Zero memory growth
- GPU-accelerated
- WebAssembly-powered
- Sub-millisecond interactivity even on larger datasets
- 2.3MB bundle size
- Float64 array and FIFO mode for enhanced data efficiency
- Cross-platform performance across JavaScript, WPF/.NET, and iOS/Android
- DateTime & Category axis support
- Stable long‑running performance for 24/7 instrumentation workloads
- Continuous streaming
- Deterministic rendering
- Visualize 100 M+ points per dataset
- Continuous 24/7 operation
- Sustain 200k points per second
- Refresh 64+ charts in under one second
- Embeddable within MES, YMS, and ATE systems
- Direct integration into React, Angular, and Vue
Extensive Charting Features
- Heatmaps & spectrograms
- Waterfall / stacked spectral charts
- 2D & 3D plotting
- Animation of data
- Annotations on chart
- Zoom & pan
- Tooltips
- Link multiple charts
- Touch interaction
- Legend customization
- Logarithmic axis
- Multiple X & Y-Axis
- Per-point coloring
- Programmatically change viewport
- Theme or template customization
5-Star Support for Developers
See the level of support engineers experience with big data visualizations and industrial deployments.
 Responsive 5-Star Technical Support
With our 5-star technical support subscription, we aim to answer all support tickets within one business day* and often even faster.
 Get Answers Fast with our AI Assistant
Ask our AI Assistant anything about SciChart and it will answer your questions fast!
 Knowlegable Support Forums
With nearly 4000 answered support requests on our public support forum, you’ll never be left without an answer.
 Extensive Documentation
1000s of pages of support documentation across all platforms for expert guidance on getting the most from SciChart.
 Tutorials & Videos
Our regularly updated YouTube channel will help you understand what’s possible and answers the most commonly asked questions.
 Hundreds of Example Charts
Over 350 chart examples will get you what you need to get out of the blocks more quickly.
Testimonials & Reviews
Award Winning Software – Continually Rated Best with Hundreds of 5-Star Reviews
With a rating of 4.8, SciChart is one of the highest rated chart libraries in the world*, used by over 10,000 expert developers worldwide.
Read All Reviews![]()
Queens Award for Innovation
Proud winners of the Queens Award for Innovation, 2019. Awarded on account of our innovative graphics engine which underpins the SciChart library and enables our world-beating charting performance
![]()
National Business Awards
Highly Commended for Lloyds National Business Awards, 2019. Awarded on account of our innovative graphics engine and impressive customer base
![]()
National Technology Awards
Awarded “Healthcare Tech of the Year” at the 2025 National Technology Awards – a top UK recognition for breakthrough innovation in technology.

Reviews
SciChart has received hundreds of verified, 3rd party reviews