WPF Chart - Examples
SciChart WPF ships with hundreds of WPF Chart Examples which you can browse, play with, view the source-code and even export each WPF Chart Example to a stand-alone Visual Studio solution. All of this is possible with the new and improved SciChart WPF Examples Suite, which ships as part of the SciChart WPF SDK.
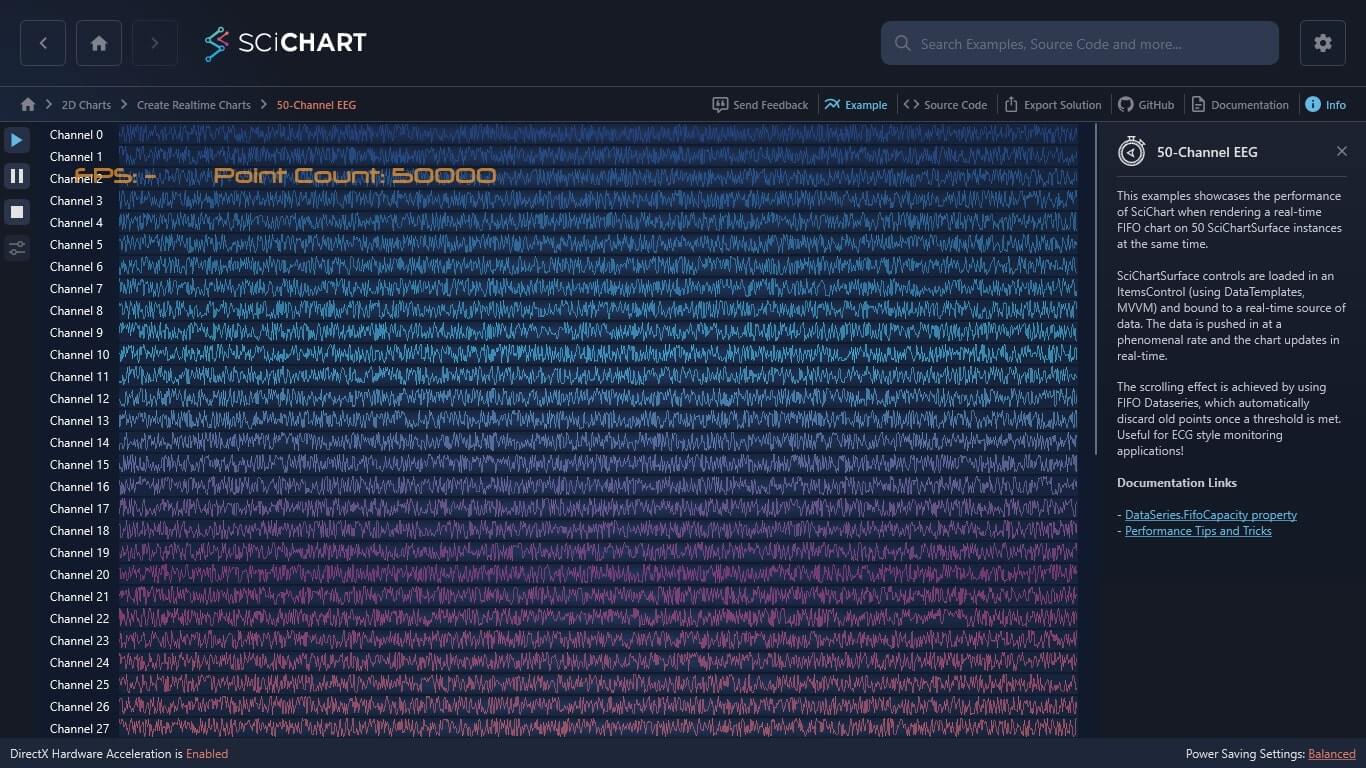
This examples showcases the performance of SciChart when rendering a real-time FIFO chart on 50 SciChartSurface instances at the same time.
SciChartSurface controls are loaded in an ItemsControl (using DataTemplates, MVVM) and bound to a real-time source of data. The data is pushed in at a phenomenal rate and the chart updates in real-time.
The scrolling effect is achieved by using FIFO Dataseries, which automatically discard old points once a threshold is met. Useful for ECG style monitoring applications!
Documentation Links
– DataSeries.FifoCapacity property
– Performance Tips and Tricks

The C#/WPF source code for the WPF Chart 50-Channel EEG example is included below (Scroll down!).
Did you know you can also view the source code from one of the following sources as well?
- Clone the SciChart.WPF.Examples from Github.
- Or, view source in the SciChart WPF Examples suite.
- Also the SciChart WPF Trial contains the full source for the examples (link below).
EEGExampleView.xaml
View source code<UserControl x:Class="SciChart.Examples.Examples.CreateRealtimeChart.EEGChannelsDemo.EEGExampleView"
xmlns="http://schemas.microsoft.com/winfx/2006/xaml/presentation"
xmlns:x="http://schemas.microsoft.com/winfx/2006/xaml"
xmlns:d="http://schemas.microsoft.com/expression/blend/2008"
xmlns:ext="http://schemas.abtsoftware.co.uk/scichart/exampleExternals"
xmlns:i="http://schemas.microsoft.com/xaml/behaviors"
xmlns:mc="http://schemas.openxmlformats.org/markup-compatibility/2006"
xmlns:s="http://schemas.abtsoftware.co.uk/scichart"
d:DesignHeight="400"
d:DesignWidth="600"
mc:Ignorable="d">
<i:Interaction.Triggers>
<i:EventTrigger EventName="Loaded">
<i:InvokeCommandAction Command="{Binding StartCommand}" />
</i:EventTrigger>
<i:EventTrigger EventName="Unloaded">
<i:InvokeCommandAction Command="{Binding StopCommand}" />
</i:EventTrigger>
</i:Interaction.Triggers>
<UserControl.Resources>
<ResourceDictionary>
<ResourceDictionary.MergedDictionaries>
<ResourceDictionary Source="/SciChart.Examples.ExternalDependencies;component/Resources/Styles/MergedResources.xaml" />
<ResourceDictionary Source="/SciChart.Examples.ExternalDependencies;component/Resources/Styles/ToolbarButtonsCommon.xaml" />
</ResourceDictionary.MergedDictionaries>
<!-- ItemTemplate for EEG Channels. Create a single SciChartSurface instance per EEGChannelViewModel -->
<DataTemplate x:Key="ChannelItemTemplate">
<Grid IsHitTestVisible="False">
<Grid.ColumnDefinitions>
<ColumnDefinition Width="Auto" SharedSizeGroup="Name" />
<ColumnDefinition Width="*" />
</Grid.ColumnDefinitions>
<TextBlock Margin="10,0"
Foreground="White"
Text="{Binding ChannelName}" />
<!-- Declare the SciChartSurface. SciChartSurfaceEx enables hardware acceleration by default -->
<s:SciChartSurface Grid.Column="1"
Height="20"
Padding="0"
HorizontalAlignment="Stretch">
<!-- Declare RenderableSeries, which are mapped to DataSet Series 1:1 and in order -->
<s:SciChartSurface.RenderableSeries>
<s:FastLineRenderableSeries AntiAliasing="False"
DataSeries="{Binding ChannelDataSeries}"
ResamplingMode="None"
Stroke="{Binding Stroke, Mode=OneWay}">
<s:FastLineRenderableSeries.RolloverMarkerTemplate>
<ControlTemplate>
<Ellipse Width="7"
Height="7"
Fill="White" />
</ControlTemplate>
</s:FastLineRenderableSeries.RolloverMarkerTemplate>
</s:FastLineRenderableSeries>
</s:SciChartSurface.RenderableSeries>
<!-- Axes are created implicitly when a dataset is created, but we override them here so we can style them -->
<s:SciChartSurface.XAxis>
<s:NumericAxis AutoRange="Always"
DrawMajorGridLines="False"
DrawMinorGridLines="False"
DrawMajorBands="False"
Visibility="Collapsed">
</s:NumericAxis>
</s:SciChartSurface.XAxis>
<s:SciChartSurface.YAxis>
<s:NumericAxis AutoRange="Always"
DrawMajorGridLines="False"
DrawMinorGridLines="False"
DrawMajorBands="False"
Visibility="Collapsed" />
</s:SciChartSurface.YAxis>
</s:SciChartSurface>
</Grid>
</DataTemplate>
<!-- Style per ListBoxItem to ensure the chart stretches to fit -->
<Style x:Key="ChannelListBoxItemStyle" TargetType="ListBoxItem">
<Setter Property="HorizontalContentAlignment" Value="Stretch" />
<Setter Property="Margin" Value="3,0,3,0"/>
<Setter Property="Padding" Value="0"/>
</Style>
<!-- Style for Stats -->
<Style x:Key="StatsStyle" TargetType="TextBlock">
<Setter Property="FontSize" Value="26" />
<Setter Property="Margin" Value="0" />
<Setter Property="FontWeight" Value="Normal" />
<Setter Property="Foreground" Value="#BBFC9C29" />
<Setter Property="FontFamily" Value="/Resources/Fonts/#Neuropol Regular" />
</Style>
<s:BooleanToVisibilityConverter x:Key="BooleanToVisibilityConverter" />
</ResourceDictionary>
</UserControl.Resources>
<Grid x:Name="LayoutRoot">
<Grid.ColumnDefinitions>
<ColumnDefinition Width="Auto" />
<ColumnDefinition Width="*" />
</Grid.ColumnDefinitions>
<Border Panel.ZIndex="9999"
Background="#FF232426"
BorderBrush="#323539"
BorderThickness="0,0,2,0">
<WrapPanel HorizontalAlignment="Right" Orientation="Vertical">
<!-- Define the Toolbar -->
<ToggleButton Command="{Binding StartCommand}"
Content="Play"
Style="{StaticResource PlayButtonStyle}"
ToolTip="Play"
s:ToggleButtonExtensions.GroupName="RealTimeEEG" />
<ToggleButton Command="{Binding StopCommand}"
x:Name="StopButton"
Content="Pause"
Style="{StaticResource PauseButtonStyle}"
ToolTip="Pause"
s:ToggleButtonExtensions.GroupName="RealTimeEEG" />
<ToggleButton Command="{Binding ResetCommand}"
x:Name="ResetButton"
Content="Stop"
Style="{StaticResource StopButtonStyle}"
ToolTip="Stop"
s:ToggleButtonExtensions.GroupName="RealTimeEEG" />
<ext:FlyoutMenuButton x:Name="IntervalFlyoutMenuButton"
HorizontalAlignment="Left"
Content="Interval"
Style="{StaticResource FlyoutMenuButtonStyle}"
ToolTipService.ToolTip="Interval (ms)">
<ext:FlyoutMenuButton.PopupContent>
<StackPanel MinWidth="150" Orientation="Vertical">
<TextBlock Margin="3"
HorizontalAlignment="Left"
Foreground="White"
Text="Interval (ms): " />
<Slider MinWidth="100"
DataContext="{Binding}"
IsEnabled="{Binding IsRunning,
Converter={StaticResource BooleanToVisibilityConverter},
ConverterParameter=INVERSE}"
Maximum="100"
Minimum="10"
Value="{Binding TimerInterval,
Mode=TwoWay}">
<ToolTipService.ToolTip>
<StackPanel Orientation="Horizontal">
<TextBlock Foreground="#222222" Text="{Binding TimerInterval}" />
<TextBlock Foreground="#222222" Text=" ms" />
</StackPanel>
</ToolTipService.ToolTip>
</Slider>
</StackPanel>
</ext:FlyoutMenuButton.PopupContent>
</ext:FlyoutMenuButton>
<ext:FlyoutMenuButton x:Name="PointsFlyoutMenuButton"
HorizontalAlignment="Left"
Content="Points"
Style="{StaticResource FlyoutMenuButtonStyle}"
ToolTipService.ToolTip="Points per Tick">
<ext:FlyoutMenuButton.PopupContent>
<StackPanel MinWidth="150" Orientation="Vertical">
<TextBlock Margin="3"
VerticalAlignment="Center"
Foreground="White"
Text="Points per Tick: " />
<Slider MinWidth="100"
DataContext="{Binding}"
IsEnabled="{Binding IsRunning,
Converter={StaticResource BooleanToVisibilityConverter},
ConverterParameter=INVERSE}"
Maximum="100"
Minimum="10"
Value="{Binding BufferSize,
Mode=TwoWay}">
<ToolTipService.ToolTip>
<StackPanel Orientation="Horizontal">
<TextBlock Foreground="#222222" Text="{Binding BufferSize}" />
<TextBlock Foreground="#222222" Text=" Points/Tick" />
</StackPanel>
</ToolTipService.ToolTip>
</Slider>
</StackPanel>
</ext:FlyoutMenuButton.PopupContent>
</ext:FlyoutMenuButton>
</WrapPanel>
</Border>
<!-- Define the listbox which will host the N channels of the EEG -->
<ListBox Grid.Column="1"
Background="#1c1c1e"
BorderThickness="0"
ItemContainerStyle="{StaticResource ChannelListBoxItemStyle}"
ItemTemplate="{StaticResource ChannelItemTemplate}"
ItemsSource="{Binding ChannelViewModels}"
Grid.IsSharedSizeScope="True"
ScrollViewer.HorizontalScrollBarVisibility="Disabled" />
<!-- Define the Stats Panel -->
<Grid Grid.Column="1"
Margin="40,40,0,0"
HorizontalAlignment="Left"
VerticalAlignment="Top">
<Grid.ColumnDefinitions>
<ColumnDefinition Width="Auto" />
<ColumnDefinition Width="60" />
<ColumnDefinition Width="Auto" />
<ColumnDefinition Width="Auto" />
</Grid.ColumnDefinitions>
<TextBlock Grid.Column="0"
HorizontalAlignment="Left"
VerticalAlignment="Top"
Style="{StaticResource StatsStyle}"
Text="FPS: " />
<TextBlock Name="fpsCounter"
Grid.Column="1"
HorizontalAlignment="Left"
VerticalAlignment="Top"
Style="{StaticResource StatsStyle}" />
<TextBlock Grid.Column="2"
Margin="10,0,0,0"
HorizontalAlignment="Left"
VerticalAlignment="Top"
Style="{StaticResource StatsStyle}"
Text="Point Count: " />
<TextBlock Name="pointCount"
Grid.Column="3"
HorizontalAlignment="Left"
VerticalAlignment="Top"
Style="{StaticResource StatsStyle}" />
</Grid>
</Grid>
</UserControl>EEGExampleView.xaml.cs
View source code// *************************************************************************************
// SCICHART® Copyright SciChart Ltd. 2011-2022. All rights reserved.
//
// Web: http://www.scichart.com
// Support: support@scichart.com
// Sales: sales@scichart.com
//
// EEGExampleView.xaml.cs is part of the SCICHART® Examples. Permission is hereby granted
// to modify, create derivative works, distribute and publish any part of this source
// code whether for commercial, private or personal use.
//
// The SCICHART® examples are distributed in the hope that they will be useful, but
// without any warranty. It is provided "AS IS" without warranty of any kind, either
// expressed or implied.
// *************************************************************************************
using System;
using System.Diagnostics;
using System.Windows;
using System.Windows.Controls;
using System.Windows.Media;
using SciChart.Drawing.Common;
using SciChart.Examples.ExternalDependencies.Data;
namespace SciChart.Examples.Examples.CreateRealtimeChart.EEGChannelsDemo
{
/// <summary>
/// Interaction logic for EEGExampleView.xaml
/// </summary>
public partial class EEGExampleView : UserControl
{
private Stopwatch _stopWatch;
private double _lastFrameTime;
private MovingAverage _fpsAverage;
public EEGExampleView()
{
InitializeComponent();
_stopWatch = Stopwatch.StartNew();
_fpsAverage = new MovingAverage(5);
Loaded += OnLoaded;
Unloaded += OnUnloaded;
}
private void OnUnloaded(object sender, RoutedEventArgs routedEventArgs)
{
RenderSurfaceBase.UseThreadedRenderTimer = false;
CompositionTarget.Rendering -= CompositionTarget_Rendering;
}
private void OnLoaded(object sender, RoutedEventArgs routedEventArgs)
{
RenderSurfaceBase.UseThreadedRenderTimer = true;
CompositionTarget.Rendering -= CompositionTarget_Rendering;
CompositionTarget.Rendering += CompositionTarget_Rendering;
}
/// <summary>
/// Purely for stats reporting (FPS). Not needed for SciChart rendering
/// </summary>
private void CompositionTarget_Rendering(object sender, EventArgs e)
{
if (StopButton.IsChecked != true && ResetButton.IsChecked != true)
{
// Compute the render time
double frameTime = _stopWatch.ElapsedMilliseconds;
double delta = frameTime - _lastFrameTime;
double fps = 1000.0 / delta;
// Push the fps to the movingaverage, we want to average the FPS to get a more reliable reading
_fpsAverage.Push(fps);
// Render the fps to the screen
fpsCounter.Text = double.IsNaN(_fpsAverage.Current) ? "-" : string.Format("{0:0}", _fpsAverage.Current);
// Render the total point count (all series) to the screen
var eegExampleViewModel = (DataContext as EEGExampleViewModel);
pointCount.Text = eegExampleViewModel != null ? eegExampleViewModel.PointCount.ToString() : "Na";
_lastFrameTime = frameTime;
}
}
}
}
EEGExampleViewModel.cs
View source codeEEGChannelViewModel.cs
View source code