WPF Chart - Examples
SciChart WPF ships with hundreds of WPF Chart Examples which you can browse, play with, view the source-code and even export each WPF Chart Example to a stand-alone Visual Studio solution. All of this is possible with the new and improved SciChart WPF Examples Suite, which ships as part of the SciChart WPF SDK.
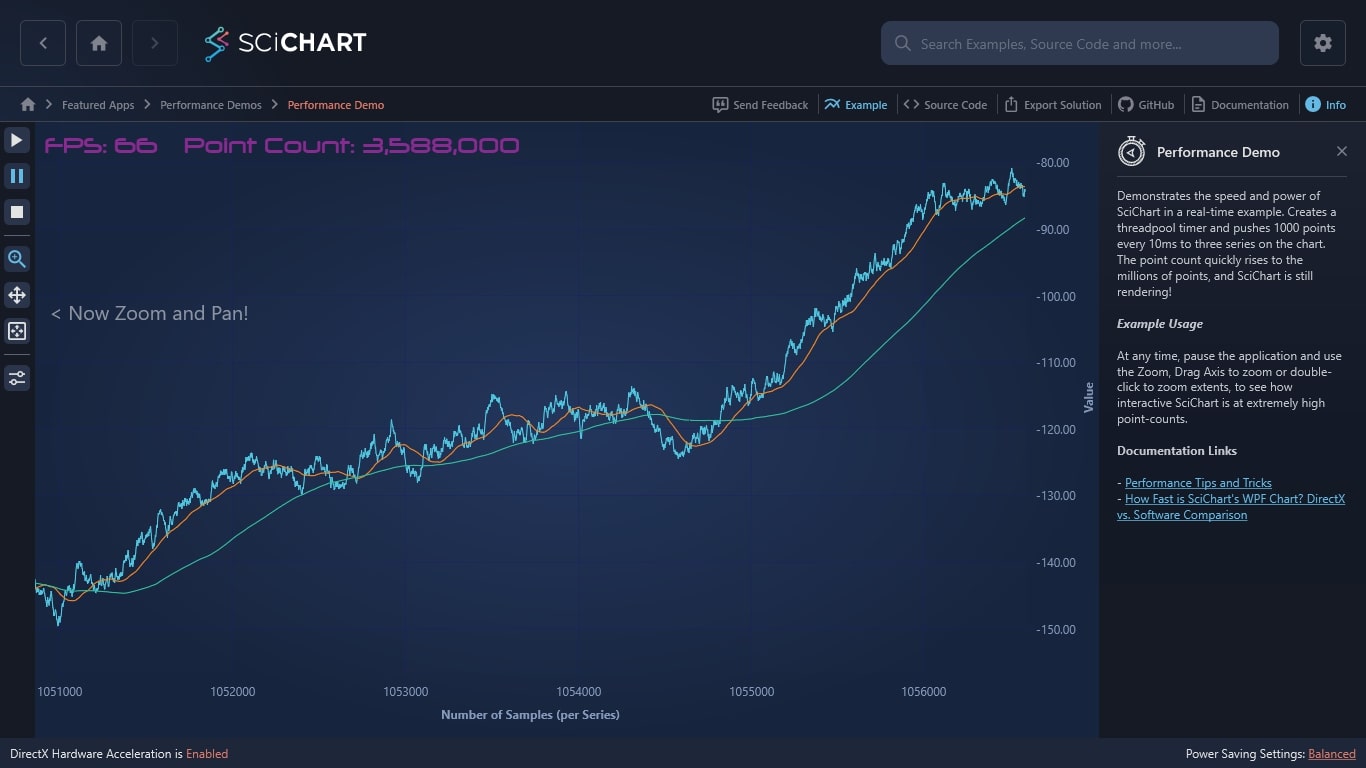
Demonstrates the speed and power of SciChart in a real-time example. Creates a threadpool timer and pushes 1000 points every 10ms to three series on the chart. The point count quickly rises to the millions of points, and SciChart is still rendering!
Example Usage
At any time, pause the application and use the Zoom, Drag Axis to zoom or double-click to zoom extents, to see how interactive SciChart is at extremely high point-counts.
Documentation Links
– Performance Tips and Tricks
– How Fast is SciChart’s WPF Chart? DirectX vs. Software Comparison

The C#/WPF source code for the WPF Chart Realtime Performance Demo example is included below (Scroll down!).
Did you know you can also view the source code from one of the following sources as well?
- Clone the SciChart.WPF.Examples from Github.
- Or, view source in the SciChart WPF Examples suite.
- Also the SciChart WPF Trial contains the full source for the examples (link below).
RealTimePerformanceDemoView.xaml
View source code<UserControl x:Class="SciChart.Examples.Examples.SeeFeaturedApplication.PerformanceDemo.RealTimePerformanceDemoView"
xmlns="http://schemas.microsoft.com/winfx/2006/xaml/presentation"
xmlns:x="http://schemas.microsoft.com/winfx/2006/xaml"
xmlns:s="http://schemas.abtsoftware.co.uk/scichart"
Loaded="OnExampleLoaded"
Unloaded="OnExampleUnloaded"
xmlns:mc="http://schemas.openxmlformats.org/markup-compatibility/2006"
xmlns:d="http://schemas.microsoft.com/expression/blend/2008"
xmlns:ext="http://schemas.abtsoftware.co.uk/scichart/exampleExternals"
d:DesignHeight="400"
d:DesignWidth="600"
mc:Ignorable="d">
<UserControl.Resources>
<ResourceDictionary>
<ResourceDictionary.MergedDictionaries>
<ResourceDictionary Source="/SciChart.Examples.ExternalDependencies;component/Resources/Styles/MergedResources.xaml" />
</ResourceDictionary.MergedDictionaries>
<ext:BoolToValueConverter x:Key="InvertBooleanConverter" TrueValue="False" FalseValue="True"/>
</ResourceDictionary>
</UserControl.Resources>
<Grid x:Name="LayoutRoot">
<Grid.ColumnDefinitions>
<ColumnDefinition Width="Auto" />
<ColumnDefinition Width="*" />
</Grid.ColumnDefinitions>
<Border Background="#FF232426" BorderThickness="0,0,2,0" BorderBrush="#323539" Canvas.ZIndex="9999">
<StackPanel Orientation="Vertical">
<ToggleButton x:Name="StartButton" Click="StartButton_Click" IsChecked="True" Style="{StaticResource PlayButtonStyle}" Padding="4"/>
<ToggleButton x:Name="PauseButton" Click="PauseButton_Click" Style="{StaticResource PauseButtonStyle}" Padding="7"/>
<ToggleButton x:Name="ResetButton" Click="ResetButton_Click" Style="{StaticResource StopButtonStyle}" Padding="7"/>
<ext:FlyoutSeparator Background="#444"/>
<ToggleButton Margin="3"
x:Name="enableZoom"
IsChecked="False"
ToolTipService.ToolTip="Toggle Rubber-Band Zoom"
Style="{StaticResource ZoomButtonStyle}"
s:ToggleButtonExtensions.GroupName="PerformanceDemoToolbar"/>
<ToggleButton Margin="3"
x:Name="enablePan"
ToolTipService.ToolTip="Toggle Zoom-Pan"
Style="{StaticResource PanButtonStyle}"
IsChecked="False"
s:ToggleButtonExtensions.GroupName="PerformanceDemoToolbar" />
<Button Margin="3" ToolTipService.ToolTip="Zoom to Extents"
Style="{StaticResource ZoomExtentsButtonStyle}"
Command="{Binding Source={x:Reference Name=sciChart}, Path=AnimateZoomExtentsCommand}"/>
<ext:FlyoutSeparator Background="#444"/>
<ext:FlyoutMenuButton Style="{StaticResource FlyoutMenuButtonStyle}" Content="CTRL" Padding="0">
<ext:FlyoutMenuButton.PopupContent>
<StackPanel Orientation="Vertical" MinWidth="150">
<TextBlock Text="RenderableSeries Controls" />
<ext:FlyoutSeparator/>
<CheckBox Margin="4" Checked="CheckBox_Checked" Content="Use Antialiasing?" IsChecked="True" Unchecked="CheckBox_Checked" Foreground="#999"/>
<TextBlock Text="Resampling Mode:" />
<ComboBox Margin="4" x:Name="ResamplingCombo" SelectionChanged="ComboBox_SelectionChanged" />
<TextBlock Text="Stroke Thickness:" />
<ComboBox Margin="4" x:Name="StrokeCombo" MinWidth="50" SelectionChanged="ComboBox_SelectionChanged" />
</StackPanel>
</ext:FlyoutMenuButton.PopupContent>
</ext:FlyoutMenuButton>
</StackPanel>
</Border>
<!-- Create the chart surface -->
<s:SciChartSurface Name="sciChart"
Grid.Column="1">
<!-- Define RenderableSeries -->
<s:SciChartSurface.RenderableSeries>
<s:FastLineRenderableSeries x:Name="RenderableSeries0" Stroke="#FF4083B7" />
<s:FastLineRenderableSeries x:Name="RenderableSeries1" Stroke="#FFFFA500" />
<s:FastLineRenderableSeries x:Name="RenderableSeries2" Stroke="#FFE13219" />
</s:SciChartSurface.RenderableSeries>
<!-- Create an X Axis -->
<s:SciChartSurface.XAxis>
<s:NumericAxis Margin="0,0,0,10"
AutoRange="Always"
AxisTitle="Number of Samples (per Series)"
DrawMinorGridLines="False"
DrawMinorTicks="False"
TextFormatting="#">
<s:NumericAxis.GrowBy>
<s:DoubleRange Max="0.1" Min="0.1" />
</s:NumericAxis.GrowBy>
</s:NumericAxis>
</s:SciChartSurface.XAxis>
<!-- Create a Y Axis -->
<s:SciChartSurface.YAxis>
<s:NumericAxis AutoRange="Always"
AxisTitle="Value"
DrawMinorGridLines="False"
DrawMinorTicks="False"
TextFormatting="0.00">
<s:NumericAxis.GrowBy>
<s:DoubleRange Max="0.1" Min="0.1" />
</s:NumericAxis.GrowBy>
</s:NumericAxis>
</s:SciChartSurface.YAxis>
<!-- Specify interactivity modifiers -->
<s:SciChartSurface.ChartModifier>
<s:ModifierGroup>
<s:RubberBandXyZoomModifier IsXAxisOnly="True" IsEnabled="{Binding Source={x:Reference Name=enableZoom}, Path=IsChecked, Mode=TwoWay}"/>
<s:ZoomPanModifier ClipModeX="None" IsEnabled="{Binding Source={x:Reference Name=enablePan}, Path=IsChecked, Mode=TwoWay}"/>
<s:XAxisDragModifier IsEnabled="{Binding Source={x:Reference Name=enableZoom}, Path=IsEnabled}"/>
<s:YAxisDragModifier IsEnabled="{Binding Source={x:Reference Name=enableZoom}, Path=IsEnabled}"/>
<s:MouseWheelZoomModifier IsEnabled="{Binding Source={x:Reference Name=enableZoom}, Path=IsEnabled}"/>
<s:ZoomExtentsModifier ExecuteOn="MouseDoubleClick" IsEnabled="{Binding Source={x:Reference Name=enableZoom}, Path=IsEnabled}"/>
</s:ModifierGroup>
</s:SciChartSurface.ChartModifier>
<!-- Some hints to the user -->
<s:SciChartSurface.Annotations>
<s:TextAnnotation CoordinateMode="Relative" X1="0" Y1="0" Margin="5,28,0,0" FontSize="20" Opacity="0.5" Foreground="#FFF" HorizontalAnchorPoint="Left" VerticalAnchorPoint="Center"
Text="< Pause to enable Zoom/Pan"
IsHidden="{Binding Source={x:Reference Name=enableZoom}, Path=IsEnabled}"/>
<s:TextAnnotation CoordinateMode="Relative" X1="0" Y1="0" Margin="5,95,0,0" FontSize="20" Opacity="0.5" Foreground="#FFF" HorizontalAnchorPoint="Left" VerticalAnchorPoint="Center"
Text="< Now Zoom and Pan!"
IsHidden="{Binding Source={x:Reference Name=enableZoom}, Path=IsEnabled, Converter={StaticResource InvertBooleanConverter}}"/>
</s:SciChartSurface.Annotations>
</s:SciChartSurface>
<!-- ************************************************ -->
<!-- IGNORE BELOW THIS LINE. Stats panel -->
<!-- ************************************************ -->
<!-- Define the Stats Panel -->
<Grid Grid.Column="1"
Margin="10,10,0,0"
HorizontalAlignment="Left"
VerticalAlignment="Top">
<Grid.Resources>
<!-- Style for Stats -->
<Style x:Key="StatsStyle" TargetType="TextBlock">
<Setter Property="FontSize" Value="26" />
<Setter Property="Margin" Value="0" />
<Setter Property="FontWeight" Value="Normal" />
<Setter Property="Foreground" Value="#BBFC9C29" />
<Setter Property="FontFamily" Value="pack://application:,,,/Resources/Fonts/#Neuropol Regular" />
</Style>
</Grid.Resources>
<Grid.ColumnDefinitions>
<ColumnDefinition Width="Auto" />
<ColumnDefinition Width="60" />
<ColumnDefinition Width="Auto" />
<ColumnDefinition Width="Auto" />
</Grid.ColumnDefinitions>
<TextBlock Grid.Column="0"
Style="{StaticResource StatsStyle}"
Text="FPS: " />
<TextBlock Name="FpsCounter"
Grid.Column="1"
Style="{StaticResource StatsStyle}" />
<TextBlock Grid.Column="2"
Margin="10,0,0,0"
Style="{StaticResource StatsStyle}"
Text="Point Count: " />
<TextBlock Name="PointCount"
Grid.Column="3"
Style="{StaticResource StatsStyle}" />
</Grid>
</Grid>
</UserControl>
RealTimePerformanceDemoView.xaml.cs
View source code// *************************************************************************************
// SCICHART® Copyright SciChart Ltd. 2011-2022. All rights reserved.
//
// Web: http://www.scichart.com
// Support: support@scichart.com
// Sales: sales@scichart.com
//
// RealTimePerformanceDemoView.xaml.cs is part of the SCICHART® Examples. Permission is hereby granted
// to modify, create derivative works, distribute and publish any part of this source
// code whether for commercial, private or personal use.
//
// The SCICHART® examples are distributed in the hope that they will be useful, but
// without any warranty. It is provided "AS IS" without warranty of any kind, either
// expressed or implied.
// *************************************************************************************
using System;
using System.Diagnostics;
using System.Timers;
using System.Windows;
using System.Windows.Controls;
using SciChart.Charting.Model.DataSeries;
using SciChart.Charting.Visuals.Axes;
using SciChart.Charting.Visuals.RenderableSeries;
using SciChart.Core.Utility;
using SciChart.Data.Numerics;
using SciChart.Examples.ExternalDependencies.Data;
namespace SciChart.Examples.Examples.SeeFeaturedApplication.PerformanceDemo
{
public partial class RealTimePerformanceDemoView : UserControl
{
private Random _random;
private bool _running;
private MovingAverage _maLow;
private MovingAverage _maHigh;
private Stopwatch _stopWatch;
private MovingAverage _fpsAverage;
private double _lastFrameTime;
private const int MaxCount = 10000000; // Max number of points to draw before demo stops
private const int BufferSize = 1000; // Number of points to append to each channel each tick
private const int TimerInterval = 10; // Interval of the timer to generate data in ms
// X, Y buffers used to buffer data into the Scichart in blocks of BufferSize
// This gives an increase in rendering throughput over one off appends of X, Y points
private readonly int[] xBuffer = new int[BufferSize];
private readonly float[] yBuffer = new float[BufferSize];
private readonly float[] maLowBuffer = new float[BufferSize];
private readonly float[] maHighBuffer = new float[BufferSize];
private Timer _timer;
private TimedMethod _startDelegate;
private XyDataSeries<int, float> _mainSeries;
private XyDataSeries<int, float> _maLowSeries;
private XyDataSeries<int, float> _maHighSeries;
public RealTimePerformanceDemoView()
{
InitializeComponent();
ResamplingCombo.Items.Add(ResamplingMode.None);
ResamplingCombo.Items.Add(ResamplingMode.MinMax);
ResamplingCombo.Items.Add(ResamplingMode.Mid);
ResamplingCombo.Items.Add(ResamplingMode.Min);
ResamplingCombo.Items.Add(ResamplingMode.Max);
ResamplingCombo.Items.Add(ResamplingMode.Auto);
ResamplingCombo.Items.Add(ResamplingMode.MinMaxWithUnevenSpacing);
ResamplingCombo.SelectedItem = ResamplingMode.Auto;
StrokeCombo.Items.Add(1);
StrokeCombo.Items.Add(2);
StrokeCombo.Items.Add(3);
StrokeCombo.Items.Add(4);
StrokeCombo.Items.Add(5);
StrokeCombo.SelectedItem = 1;
// Used purely for FPS reporting
sciChart.Rendered += OnSciChartRendered;
}
private void DataAppendLoop()
{
// By nesting multiple updates inside a SuspendUpdates using block, you get one redraw at the end
using (sciChart.SuspendUpdates())
{
// Preload previous value with k-1 sample, or 0.0 if the count is zero
int xValue = _mainSeries.Count > 0 ? _mainSeries.XValues[_mainSeries.Count - 1] : 0;
double yValue = _mainSeries.Count > 0 ? _mainSeries.YValues[_mainSeries.Count - 1] : 10.0f;
// Add N points at a time. We want to get to the higher point counts
// quickly to demonstrate performance.
// Also, it is more efficient to buffer and block update the chart
// even if you use SuspendUpdates due to the overhead of calculating min, max
// for a series
for (int i = 0; i < BufferSize; i++)
{
// Generate a new X,Y value in the random walk and buffer
xValue++;
yValue += _random.NextDouble() - 0.5;
xBuffer[i] = xValue;
yBuffer[i] = (float)yValue;
// Update moving averages
maLowBuffer[i] = (float)_maLow.Push(yValue).Current;
maHighBuffer[i] = (float)_maHigh.Push(yValue).Current;
}
// Append block of values to all three series
_mainSeries.Append(xBuffer, yBuffer);
_maLowSeries.Append(xBuffer, maLowBuffer);
_maHighSeries.Append(xBuffer, maHighBuffer);
}
}
private void OnSciChartRendered(object sender, EventArgs e)
{
// Compute the render time
double frameTime = _stopWatch.ElapsedMilliseconds;
double delta = frameTime - _lastFrameTime;
double fps = 1000.0 / delta;
double fpsAverageBefore = _fpsAverage.Current;
// Push the fps to the movingaverage, we want to average the FPS to get a more reliable reading
if (!double.IsInfinity(fps))
{
_fpsAverage.Push(fps);
}
double fpsAverageAfter = _fpsAverage.Current;
// Render the fps to the screen
if (Math.Abs(fpsAverageAfter - fpsAverageBefore) >= 0.1)
FpsCounter.Text = double.IsNaN(_fpsAverage.Current) ? "-" : string.Format("{0:0}", _fpsAverage.Current);
// Render the total point count (all series) to the screen
int numPoints = 3 * _mainSeries.Count;
PointCount.Text = string.Format("{0:n0}", numPoints);
if (numPoints > MaxCount)
{
this.PauseButton_Click(this, null);
}
_lastFrameTime = frameTime;
}
private void StartButton_Click(object sender, RoutedEventArgs e)
{
Start();
StartButton.IsChecked = true;
PauseButton.IsChecked = false;
ResetButton.IsChecked = false;
}
private void PauseButton_Click(object sender, RoutedEventArgs e)
{
Pause();
StartButton.IsChecked = false;
PauseButton.IsChecked = true;
ResetButton.IsChecked = false;
}
private void ResetButton_Click(object sender, RoutedEventArgs e)
{
Reset();
StartButton.IsChecked = false;
PauseButton.IsChecked = false;
ResetButton.IsChecked = true;
}
private void Start()
{
if (!_running)
{
EnableInteractivity(false);
_running = true;
_stopWatch.Start();
_timer = new Timer(TimerInterval);
_timer.Elapsed += OnTick;
_timer.AutoReset = true;
_timer.Start();
}
sciChart.InvalidateElement();
}
private void Pause()
{
if (_running)
{
EnableInteractivity(true);
_running = false;
_timer.Stop();
_timer.Elapsed -= OnTick;
_timer = null;
}
sciChart.InvalidateElement();
}
private void Reset()
{
if (_running)
{
Pause();
}
using (sciChart.SuspendUpdates())
{
var yRange = sciChart.YAxis.VisibleRange;
var xRange = sciChart.XAxis.VisibleRange;
RenderableSeries0 = (FastLineRenderableSeries)sciChart.RenderableSeries[0];
RenderableSeries1 = (FastLineRenderableSeries)sciChart.RenderableSeries[1];
RenderableSeries2 = (FastLineRenderableSeries)sciChart.RenderableSeries[2];
// Create three DataSeries
_mainSeries = new XyDataSeries<int, float>();
_maLowSeries = new XyDataSeries<int, float>();
_maHighSeries = new XyDataSeries<int, float>();
RenderableSeries0.DataSeries = _mainSeries;
RenderableSeries1.DataSeries = _maLowSeries;
RenderableSeries2.DataSeries = _maHighSeries;
EnableInteractivity(false);
_maLow = new MovingAverage(200);
_maHigh = new MovingAverage(1000);
_fpsAverage = new MovingAverage(50);
_random = new Random((int)DateTime.Now.Ticks);
_lastFrameTime = 0;
_stopWatch = new Stopwatch();
if (_timer != null)
{
_timer.Elapsed -= OnTick;
_timer = null;
}
sciChart.YAxis.VisibleRange = yRange;
sciChart.XAxis.VisibleRange = xRange;
}
}
private void OnTick(object sender, EventArgs e)
{
// Ensure only one timer Tick processed at a time
lock (_timer)
{
DataAppendLoop();
}
}
private void EnableInteractivity(bool enable)
{
if (!enable)
{
sciChart.XAxis.AutoRange = AutoRange.Always;
sciChart.YAxis.AutoRange = AutoRange.Always;
enableZoom.IsEnabled = false;
enablePan.IsEnabled = false;
enableZoom.IsChecked = false;
enablePan.IsChecked = false;
}
else
{
enableZoom.IsEnabled = true;
enablePan.IsEnabled = true;
enableZoom.IsChecked = true;
enablePan.IsChecked = false;
sciChart.XAxis.AutoRange = AutoRange.Once;
sciChart.YAxis.AutoRange = AutoRange.Once;
}
}
private void ComboBox_SelectionChanged(object sender, SelectionChangedEventArgs e)
{
if (RenderableSeries0 == null || RenderableSeries1 == null || RenderableSeries2 == null)
return;
// batch updates for efficiency
using (sciChart.SuspendUpdates())
{
var mode = (ResamplingMode)ResamplingCombo.SelectedItem;
// Set the resampling mode on all series
RenderableSeries0.ResamplingMode = mode;
RenderableSeries1.ResamplingMode = mode;
RenderableSeries2.ResamplingMode = mode;
if (StrokeCombo.SelectedItem == null)
return;
var strokeThickness = (int)StrokeCombo.SelectedItem;
// Set the StrokeThickness on all series
RenderableSeries0.StrokeThickness = strokeThickness;
RenderableSeries1.StrokeThickness = strokeThickness;
RenderableSeries2.StrokeThickness = strokeThickness;
}
}
private void CheckBox_Checked(object sender, RoutedEventArgs e)
{
if (RenderableSeries0 == null || RenderableSeries1 == null || RenderableSeries2 == null)
return;
// batch updates for efficiency
using (sciChart.SuspendUpdates())
{
// Set Antialiasing Flag on all series
bool useAA = ((CheckBox)sender).IsChecked == true;
RenderableSeries0.AntiAliasing = useAA;
RenderableSeries1.AntiAliasing = useAA;
RenderableSeries2.AntiAliasing = useAA;
}
}
private void OnExampleLoaded(object sender, RoutedEventArgs e)
{
// Manages the state of example on enter
Reset();
_startDelegate = TimedMethod.Invoke(Start).After(500).Go();
}
private void OnExampleUnloaded(object sender, RoutedEventArgs e)
{
// Manages the state of the example on exit
if (_startDelegate != null)
{
_startDelegate.Dispose();
_startDelegate = null;
}
Pause();
}
}
}
