WPF Chart - Examples
SciChart WPF ships with hundreds of WPF Chart Examples which you can browse, play with, view the source-code and even export each WPF Chart Example to a stand-alone Visual Studio solution. All of this is possible with the new and improved SciChart WPF Examples Suite, which ships as part of the SciChart WPF SDK.
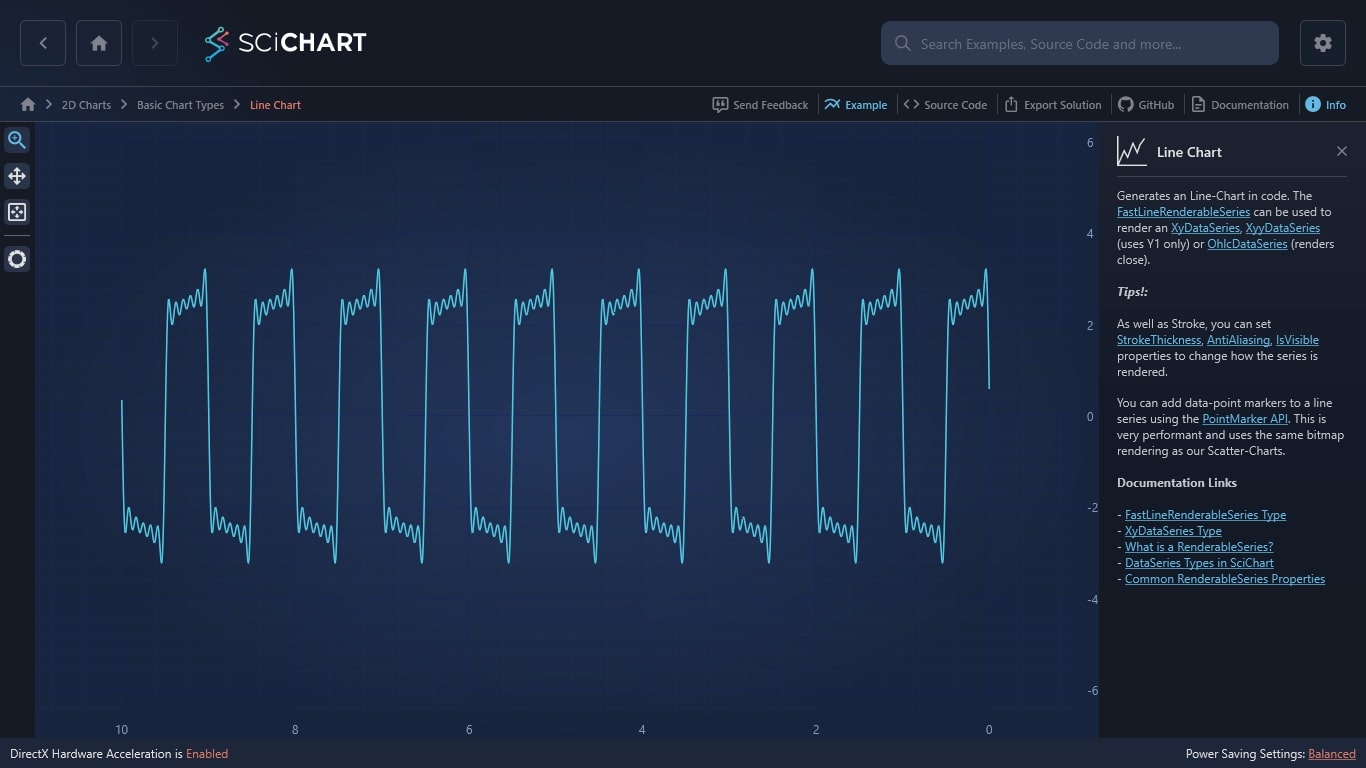
Using our WPF Charting library, you can generate a Line-Chart in code. The FastLineRenderableSeries can be used to render an XyDataSeries, XyyDataSeries (uses Y1 only) or OhlcDataSeries (renders close).
Tips!:
- As well as Stroke, you can set StrokeThickness, AntiAliasing, IsVisible properties to change how the series is rendered.
- You can add data-point markers to a line series using the PointMarker API. This is very performant and uses the same bitmap rendering as our Scatter-Charts.
Documentation Links
– FastLineRenderableSeries Type
– XyDataSeries Type
– What is a RenderableSeries?
– DataSeries Types in SciChart
– Common RenderableSeries Properties
The C#/WPF source code for the WPF Line Chart Example is included below.
You can also view the source code from one of the following sources:
- Clone the SciChart.WPF.Examples from Github.
- View source in the SciChart WPF Examples suite.
- SciChart WPF Trial contains the full source for the examples.
Download the Chart Examples or begin your free trial today.
Why Choose SciChart?
With SciChart, you gain access to millions of lines of code across platforms, and not to mention the Fastest WPF Chart Library in the world! You’ll also be able to join a developer community with thousands of members.
- In-house built hardware Xccelerator
- 5-star rated tech support
- Winner of the Queen’s Award for Innovation
- Fast performance on large data sets
- Expansive features & customizations
- 98% of customers recommend SciChart
Frequently Asked Questions
What WPF styling customizations do you support?
We support full customization capabilities. In our Theme Manager, we have set customizations that enable you to alter the colors of cursors, zoom, axis, grid and series. You can also create your own custom themes, helping you to create the exact charts you’re after – and leaving no compromises on your brand styling.
How do your WPF Line Charts compare with competitors?
That’s a good question! We are the world’s fastest WPF Chart Library. Building charts with us will help you display big data sets across multiple series simultaneously.
Do you offer a good level of support?
It’s not just our software that makes us the preferred choice for thousands of enterprise-level developers – We also offer 5-star rated tech support.

The C#/WPF source code for the WPF Line Chart example is included below (Scroll down!).
Did you know you can also view the source code from one of the following sources as well?
- Clone the SciChart.WPF.Examples from Github.
- Or, view source in the SciChart WPF Examples suite.
- Also the SciChart WPF Trial contains the full source for the examples (link below).
LineChartExampleView.xaml
View source code<UserControl x:Class="SciChart.Examples.Examples.CreateSimpleChart.LineChartExampleView"
xmlns="http://schemas.microsoft.com/winfx/2006/xaml/presentation"
xmlns:x="http://schemas.microsoft.com/winfx/2006/xaml"
xmlns:d="http://schemas.microsoft.com/expression/blend/2008"
xmlns:ext="http://schemas.abtsoftware.co.uk/scichart/exampleExternals"
xmlns:mc="http://schemas.openxmlformats.org/markup-compatibility/2006"
xmlns:s="http://schemas.abtsoftware.co.uk/scichart"
Loaded="LineChartExampleView_OnLoaded"
d:DesignHeight="400"
d:DesignWidth="600"
mc:Ignorable="d">
<UserControl.Resources>
<ResourceDictionary>
<ResourceDictionary.MergedDictionaries>
<ResourceDictionary Source="/SciChart.Examples.ExternalDependencies;component/Resources/Styles/ToolbarButtonsCommon.xaml" />
</ResourceDictionary.MergedDictionaries>
</ResourceDictionary>
</UserControl.Resources>
<Grid>
<Grid.ColumnDefinitions>
<ColumnDefinition Width="Auto" />
<ColumnDefinition Width="*" />
</Grid.ColumnDefinitions>
<!-- The SciChartInteractionToolbar adds zoom, pan, zoom extents and rotate functionality -->
<!-- to the chart and is included for example purposes. -->
<!-- If you wish to know how to zoom and pan a chart then do a search for Zoom Pan in the Examples suite! -->
<ext:SciChartInteractionToolbar TargetSurface="{Binding Source={x:Reference Name=sciChart}}" />
<!-- Create the chart surface -->
<s:SciChartSurface x:Name="sciChart" Grid.Column="1">
<!-- Declare RenderableSeries -->
<s:SciChartSurface.RenderableSeries>
<s:FastLineRenderableSeries x:Name="lineRenderSeries"
Stroke="#FF99EE99"
StrokeThickness="2">
<s:FastLineRenderableSeries.SeriesAnimation>
<s:SweepAnimation AnimationDelay="0:0:1" Duration="0:0:5" />
</s:FastLineRenderableSeries.SeriesAnimation>
</s:FastLineRenderableSeries>
</s:SciChartSurface.RenderableSeries>
<!-- Create an X Axis with GrowBy -->
<s:SciChartSurface.XAxis>
<s:NumericAxis DrawMajorBands="True" FlipCoordinates="True" GrowBy="0.1, 0.1" />
</s:SciChartSurface.XAxis>
<!-- Create a Y Axis with GrowBy. Optional bands give a cool look and feel for minimal performance impact -->
<s:SciChartSurface.YAxis>
<s:NumericAxis DrawMajorBands="True" GrowBy="0.5, 0.5" />
</s:SciChartSurface.YAxis>
</s:SciChartSurface>
</Grid>
</UserControl>LineChartExampleView.xaml.cs
View source code// *************************************************************************************
// SCICHART® Copyright SciChart Ltd. 2011-2022. All rights reserved.
//
// Web: http://www.scichart.com
// Support: support@scichart.com
// Sales: sales@scichart.com
//
// LineChartExampleView.xaml.cs is part of the SCICHART® Examples. Permission is hereby granted
// to modify, create derivative works, distribute and publish any part of this source
// code whether for commercial, private or personal use.
//
// The SCICHART® examples are distributed in the hope that they will be useful, but
// without any warranty. It is provided "AS IS" without warranty of any kind, either
// expressed or implied.
// *************************************************************************************
using System.Windows;
using System.Windows.Controls;
using SciChart.Charting.Model.DataSeries;
using SciChart.Examples.ExternalDependencies.Data;
namespace SciChart.Examples.Examples.CreateSimpleChart
{
public partial class LineChartExampleView : UserControl
{
public LineChartExampleView()
{
InitializeComponent();
}
private void LineChartExampleView_OnLoaded(object sender, RoutedEventArgs e)
{
// Create a DataSeries of type X=double, Y=double
var dataSeries = new UniformXyDataSeries<double>(0d, 0.002);
lineRenderSeries.DataSeries = dataSeries;
// Append data to series. SciChart automatically redraws
dataSeries.Append(DataManager.Instance.GetFourierYData(1.0, 0.1));
sciChart.ZoomExtents();
}
}
}
