WPF Chart - Examples
SciChart WPF ships with hundreds of WPF Chart Examples which you can browse, play with, view the source-code and even export each WPF Chart Example to a stand-alone Visual Studio solution. All of this is possible with the new and improved SciChart WPF Examples Suite, which ships as part of the SciChart WPF SDK.
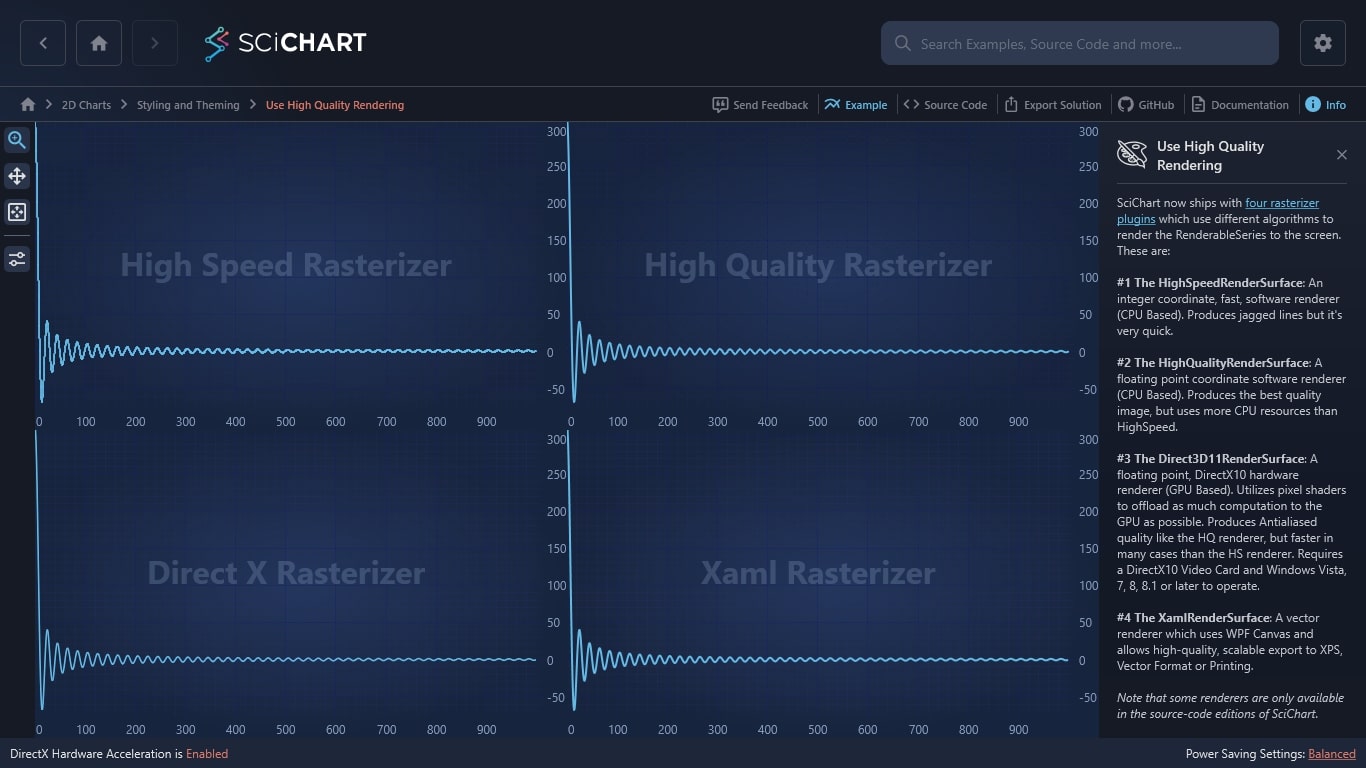
SciChart now ships with four rasterizer plugins which use different algorithms to render the RenderableSeries to the screen. These are:
#1 The HighSpeedRenderSurface: An integer coordinate, fast, software renderer (CPU Based). Produces jagged lines but it’s very quick.
#2 The HighQualityRenderSurface: A floating point coordinate software renderer (CPU Based). Produces the best quality image, but uses more CPU resources than HighSpeed.
#3 The Direct3D11RenderSurface: A floating point, DirectX10 hardware renderer (GPU Based). Utilizes pixel shaders to offload as much computation to the GPU as possible. Produces Antialiased quality like the HQ renderer, but faster in many cases than the HS renderer. Requires a DirectX10 Video Card and Windows Vista, 7, 8, 8.1 or later to operate.
#4 The XamlRenderSurface: A vector renderer which uses WPF Canvas and allows high-quality, scalable export to XPS, Vector Format or Printing.
Note that some renderers are only available in the source-code editions of SciChart.
Documentation Links
– SciChart Renderer Plugins
– Enabling the Visual Xccelerator Rendering Engine
– How Fast is SciChart’s WPF Chart? DirectX vs. Software Comparison

The C#/WPF source code for the WPF Chart Change Renderer Plugin example is included below (Scroll down!).
Did you know you can also view the source code from one of the following sources as well?
- Clone the SciChart.WPF.Examples from Github.
- Or, view source in the SciChart WPF Examples suite.
- Also the SciChart WPF Trial contains the full source for the examples (link below).
UseHighQualityRendering.xaml
View source code<UserControl x:Class="SciChart.Examples.Examples.StyleAChart.UseHighQualityRendering"
xmlns="http://schemas.microsoft.com/winfx/2006/xaml/presentation"
xmlns:x="http://schemas.microsoft.com/winfx/2006/xaml"
xmlns:s="http://schemas.abtsoftware.co.uk/scichart"
xmlns:mc="http://schemas.openxmlformats.org/markup-compatibility/2006"
xmlns:d="http://schemas.microsoft.com/expression/blend/2008"
xmlns:ext="http://schemas.abtsoftware.co.uk/scichart/exampleExternals"
d:DesignHeight="400"
d:DesignWidth="600"
mc:Ignorable="d">
<UserControl.Resources>
<s:CompositeCommandConverter x:Key="CompositeCommandConverter"/>
<!-- what's this empty style for? It just overrides some styles in our examples app App.xaml -->
<!-- so we can apply a rendersurface below. In your app you won't need it :) -->
<Style TargetType="s:SciChartSurface"/>
</UserControl.Resources>
<Grid>
<Grid.ColumnDefinitions>
<ColumnDefinition Width="Auto" />
<ColumnDefinition Width="*" />
<ColumnDefinition Width="*" />
</Grid.ColumnDefinitions>
<Grid.RowDefinitions>
<RowDefinition Height="*" />
<RowDefinition Height="*" />
</Grid.RowDefinitions>
<ext:SciChartInteractionToolbar Grid.RowSpan="2">
<ToggleButton Margin="3"
x:Name="enableZoom"
Style="{StaticResource ZoomButtonStyle}"
IsChecked="True"
s:ToggleButtonExtensions.GroupName="MultiAxisDemoToolbar"/>
<ToggleButton Margin="3"
x:Name="enablePan"
Style="{StaticResource PanButtonStyle}"
s:ToggleButtonExtensions.GroupName="MultiAxisDemoToolbar" />
<Button Margin="3"
ToolTipService.ToolTip="Zoom to Extents"
Style="{StaticResource ZoomExtentsButtonStyle}">
<Button.Command>
<MultiBinding Converter="{StaticResource CompositeCommandConverter}">
<Binding ElementName="ChartSurface1" Path="AnimateZoomExtentsCommand"/>
<Binding ElementName="ChartSurface2" Path="AnimateZoomExtentsCommand"/>
<Binding ElementName="ChartSurface3" Path="AnimateZoomExtentsCommand"/>
<Binding ElementName="ChartSurface4" Path="AnimateZoomExtentsCommand"/>
</MultiBinding>
</Button.Command>
</Button>
<ext:FlyoutSeparator Background="#444"/>
<ext:FlyoutMenuButton Style="{StaticResource FlyoutMenuButtonStyle}" Padding="0">
<TextBlock Text="CTRL" FontSize="10"/>
<ext:FlyoutMenuButton.PopupContent>
<StackPanel Orientation="Vertical" MinWidth="150">
<StackPanel.Resources>
<Style TargetType="{x:Type CheckBox}" BasedOn="{StaticResource {x:Type CheckBox}}">
<Style.Triggers>
<Trigger Property="IsChecked" Value="True">
<Setter Property="IsHitTestVisible" Value="False"/>
</Trigger>
</Style.Triggers>
</Style>
</StackPanel.Resources>
<TextBlock Text="Additional Controls" />
<RadioButton Margin="4" Style="{StaticResource CheckRadioBtn}" x:Name="UseLineSeries" Content="Use Line Series" IsChecked="True" GroupName="SeriesToggleGroup" />
<RadioButton Margin="4" Style="{StaticResource CheckRadioBtn}" x:Name="UseMountainSeries" Content="Use Mountain Series" GroupName="SeriesToggleGroup" />
<ext:FlyoutSeparator/>
<TextBlock Text="Stroke Thickness" />
<Slider x:Name="strokeThicknessSlider" Margin="4" Maximum="5.0" Minimum="1.0" Orientation="Horizontal" ToolTipService.ToolTip="{Binding Value, RelativeSource={RelativeSource Self}}" Value="2.0" />
</StackPanel>
</ext:FlyoutMenuButton.PopupContent>
</ext:FlyoutMenuButton>
</ext:SciChartInteractionToolbar>
<!-- Render SciChart using High Speed Render Surface -->
<!-- The only line required to enabl this feature is s:RenderSurfaceBase.RenderSurfaceType= -->
<s:SciChartSurface x:Name="ChartSurface1" Grid.Row="0" Grid.Column="1">
<s:SciChartSurface.RenderSurface>
<s:HighSpeedRenderSurface/>
</s:SciChartSurface.RenderSurface>
<s:SciChartSurface.RenderableSeries>
<!-- Toggle Line and MountainSeries visibility bound to same data via the toggle buttons -->
<s:FastLineRenderableSeries DataSeries="{Binding DataSeries, Mode=OneWay}"
IsVisible="{Binding ElementName=UseLineSeries, Path=IsChecked, Mode=TwoWay}"
StrokeThickness="{Binding ElementName=strokeThicknessSlider, Path=Value}" />
<s:FastMountainRenderableSeries DataSeries="{Binding DataSeries, Mode=OneWay}"
IsVisible="{Binding ElementName=UseMountainSeries, Path=IsChecked, Mode=TwoWay}"
StrokeThickness="{Binding ElementName=strokeThicknessSlider, Path=Value}" />
</s:SciChartSurface.RenderableSeries>
<s:SciChartSurface.ChartModifier>
<s:ModifierGroup s:MouseManager.MouseEventGroup="SharedModifierGroup">
<s:RubberBandXyZoomModifier ReceiveHandledEvents="True" IsEnabled="{Binding ElementName=enableZoom, Path=IsChecked}"/>
<s:ZoomPanModifier ReceiveHandledEvents="True" ClipModeX="None" XyDirection="XDirection" ZoomExtentsY="False" IsEnabled="{Binding ElementName=enablePan, Path=IsChecked}"/>
<s:ZoomExtentsModifier ReceiveHandledEvents="True" />
</s:ModifierGroup>
</s:SciChartSurface.ChartModifier>
<s:SciChartSurface.XAxis>
<s:NumericAxis VisibleRange="{Binding SharedXVisibleRange, Mode=TwoWay}" />
</s:SciChartSurface.XAxis>
<s:SciChartSurface.YAxis>
<s:NumericAxis />
</s:SciChartSurface.YAxis>
<s:SciChartSurface.Annotations>
<s:TextAnnotation AnnotationCanvas="AboveChart"
CoordinateMode="Relative"
FontSize="32"
FontWeight="Bold"
HorizontalAnchorPoint="Center"
Opacity="0.3"
Text="High Speed Rasterizer"
VerticalAnchorPoint="Center"
X1="0.5"
Y1="0.5" />
</s:SciChartSurface.Annotations>
</s:SciChartSurface>
<!-- Render SciChart using High Quality Render Surface -->
<!-- The only line required to enable this feature is s:RenderSurfaceBase.RenderSurfaceType= -->
<s:SciChartSurface x:Name="ChartSurface2" Grid.Row="0" Grid.Column="2">
<s:SciChartSurface.RenderSurface>
<s:HighQualityRenderSurface/>
</s:SciChartSurface.RenderSurface>
<s:SciChartSurface.RenderableSeries>
<!-- Toggle Line and MountainSeries visibility bound to same data via the toggle buttons -->
<s:FastLineRenderableSeries DataSeries="{Binding DataSeries, Mode=OneWay}"
IsVisible="{Binding ElementName=UseLineSeries, Path=IsChecked, Mode=TwoWay}"
StrokeThickness="{Binding ElementName=strokeThicknessSlider, Path=Value}" />
<s:FastMountainRenderableSeries DataSeries="{Binding DataSeries, Mode=OneWay}"
IsVisible="{Binding ElementName=UseMountainSeries, Path=IsChecked, Mode=TwoWay}"
StrokeThickness="{Binding ElementName=strokeThicknessSlider, Path=Value}" />
</s:SciChartSurface.RenderableSeries>
<s:SciChartSurface.ChartModifier>
<s:ModifierGroup s:MouseManager.MouseEventGroup="SharedModifierGroup">
<s:RubberBandXyZoomModifier ReceiveHandledEvents="True" IsEnabled="{Binding ElementName=enableZoom, Path=IsChecked}"/>
<s:ZoomPanModifier ReceiveHandledEvents="True" ClipModeX="None" XyDirection="XDirection" ZoomExtentsY="False" IsEnabled="{Binding ElementName=enablePan, Path=IsChecked}"/>
<s:ZoomExtentsModifier ReceiveHandledEvents="True" />
</s:ModifierGroup>
</s:SciChartSurface.ChartModifier>
<s:SciChartSurface.XAxis>
<s:NumericAxis VisibleRange="{Binding SharedXVisibleRange, Mode=TwoWay}" />
</s:SciChartSurface.XAxis>
<s:SciChartSurface.YAxis>
<s:NumericAxis />
</s:SciChartSurface.YAxis>
<s:SciChartSurface.Annotations>
<s:TextAnnotation AnnotationCanvas="AboveChart"
CoordinateMode="Relative"
FontSize="32"
FontWeight="Bold"
HorizontalAnchorPoint="Center"
Opacity="0.3"
Text="High Quality Rasterizer"
VerticalAnchorPoint="Center"
X1="0.5"
Y1="0.5" />
</s:SciChartSurface.Annotations>
</s:SciChartSurface>
<!-- Render SciChart using Direct X Render Surface -->
<!-- The only line required to enable this feature is s:VisualXcceleratorEngine.IsEnabled -->
<s:SciChartSurface x:Name="ChartSurface3" Grid.Row="1" Grid.Column="1">
<s:SciChartSurface.RenderableSeries>
<!-- Toggle Line and MountainSeries visibility bound to same data via the toggle buttons -->
<s:FastLineRenderableSeries DataSeries="{Binding DataSeries, Mode=OneWay}"
IsVisible="{Binding ElementName=UseLineSeries, Path=IsChecked, Mode=TwoWay}"
StrokeThickness="{Binding ElementName=strokeThicknessSlider, Path=Value}" />
<s:FastMountainRenderableSeries DataSeries="{Binding DataSeries, Mode=OneWay}"
IsVisible="{Binding ElementName=UseMountainSeries, Path=IsChecked, Mode=TwoWay}"
StrokeThickness="{Binding ElementName=strokeThicknessSlider, Path=Value}" />
</s:SciChartSurface.RenderableSeries>
<s:SciChartSurface.ChartModifier>
<s:ModifierGroup s:MouseManager.MouseEventGroup="SharedModifierGroup">
<s:RubberBandXyZoomModifier ReceiveHandledEvents="True" IsEnabled="{Binding ElementName=enableZoom, Path=IsChecked}"/>
<s:ZoomPanModifier ReceiveHandledEvents="True" ClipModeX="None" XyDirection="XDirection" ZoomExtentsY="False" IsEnabled="{Binding ElementName=enablePan, Path=IsChecked}"/>
<s:ZoomExtentsModifier ReceiveHandledEvents="True" />
</s:ModifierGroup>
</s:SciChartSurface.ChartModifier>
<s:SciChartSurface.XAxis>
<s:NumericAxis VisibleRange="{Binding SharedXVisibleRange, Mode=TwoWay}" />
</s:SciChartSurface.XAxis>
<s:SciChartSurface.YAxis>
<s:NumericAxis />
</s:SciChartSurface.YAxis>
<s:SciChartSurface.Annotations>
<s:TextAnnotation AnnotationCanvas="AboveChart"
CoordinateMode="Relative"
FontSize="32"
FontWeight="Bold"
HorizontalAnchorPoint="Center"
Opacity="0.3"
Text="Direct X Rasterizer"
VerticalAnchorPoint="Center"
X1="0.5"
Y1="0.5" />
</s:SciChartSurface.Annotations>
</s:SciChartSurface>
<!-- Render SciChart using Xaml Render Surface -->
<!-- The only line required to enable this feature is s:RenderSurfaceBase.RenderSurfaceType= -->
<s:SciChartSurface x:Name="ChartSurface4" Grid.Row="1" Grid.Column="2">
<s:SciChartSurface.RenderSurface>
<s:XamlRenderSurface />
</s:SciChartSurface.RenderSurface>
<s:SciChartSurface.RenderableSeries>
<!-- Toggle Line and MountainSeries visibility bound to same data via the toggle buttons -->
<s:FastLineRenderableSeries DataSeries="{Binding DataSeries, Mode=OneWay}"
IsVisible="{Binding ElementName=UseLineSeries, Path=IsChecked, Mode=TwoWay}"
StrokeThickness="{Binding ElementName=strokeThicknessSlider, Path=Value}" />
<s:FastMountainRenderableSeries DataSeries="{Binding DataSeries, Mode=OneWay}"
IsVisible="{Binding ElementName=UseMountainSeries, Path=IsChecked, Mode=TwoWay}"
StrokeThickness="{Binding ElementName=strokeThicknessSlider, Path=Value}" />
</s:SciChartSurface.RenderableSeries>
<s:SciChartSurface.ChartModifier>
<s:ModifierGroup s:MouseManager.MouseEventGroup="SharedModifierGroup">
<s:RubberBandXyZoomModifier ReceiveHandledEvents="True" IsEnabled="{Binding ElementName=enableZoom, Path=IsChecked}"/>
<s:ZoomPanModifier ReceiveHandledEvents="True" ClipModeX="None" XyDirection="XDirection" ZoomExtentsY="False" IsEnabled="{Binding ElementName=enablePan, Path=IsChecked}"/>
<s:ZoomExtentsModifier ReceiveHandledEvents="True" />
</s:ModifierGroup>
</s:SciChartSurface.ChartModifier>
<s:SciChartSurface.XAxis>
<s:NumericAxis VisibleRange="{Binding SharedXVisibleRange, Mode=TwoWay}" />
</s:SciChartSurface.XAxis>
<s:SciChartSurface.YAxis>
<s:NumericAxis />
</s:SciChartSurface.YAxis>
<s:SciChartSurface.Annotations>
<s:TextAnnotation AnnotationCanvas="AboveChart"
CoordinateMode="Relative"
FontSize="32"
FontWeight="Bold"
HorizontalAnchorPoint="Center"
Opacity="0.3"
Text="Xaml Rasterizer"
VerticalAnchorPoint="Center"
X1="0.5"
Y1="0.5" />
</s:SciChartSurface.Annotations>
</s:SciChartSurface>
</Grid>
</UserControl>UseHighQualityRendering.xaml.cs
View source code// *************************************************************************************
// SCICHART® Copyright SciChart Ltd. 2011-2022. All rights reserved.
//
// Web: http://www.scichart.com
// Support: support@scichart.com
// Sales: sales@scichart.com
//
// UseHighQualityRendering.xaml.cs is part of the SCICHART® Examples. Permission is hereby granted
// to modify, create derivative works, distribute and publish any part of this source
// code whether for commercial, private or personal use.
//
// The SCICHART® examples are distributed in the hope that they will be useful, but
// without any warranty. It is provided "AS IS" without warranty of any kind, either
// expressed or implied.
// *************************************************************************************
using System.Windows.Controls;
namespace SciChart.Examples.Examples.StyleAChart
{
/// <summary>
/// Interaction logic for UseHighQualityRendering.xaml
/// </summary>
public partial class UseHighQualityRendering : UserControl
{
public UseHighQualityRendering()
{
InitializeComponent();
}
}
}
UseHighQualityRenderingViewModel.cs
View source code// *************************************************************************************
// SCICHART® Copyright SciChart Ltd. 2011-2022. All rights reserved.
//
// Web: http://www.scichart.com
// Support: support@scichart.com
// Sales: sales@scichart.com
//
// UseHighQualityRenderingViewModel.cs is part of the SCICHART® Examples. Permission is
// hereby granted to modify, create derivative works, distribute and publish any part of
// this source code whether for commercial, private or personal use.
//
// The SCICHART® examples are distributed in the hope that they will be useful, but
// without any warranty. It is provided "AS IS" without warranty of any kind, either
// expressed or implied.
// *************************************************************************************
using System;
using SciChart.Charting.Model.DataSeries;
using SciChart.Data.Model;
using SciChart.Examples.ExternalDependencies.Common;
namespace SciChart.Examples.Examples.StyleAChart
{
public class UseHighQualityRenderingViewModel : BaseViewModel
{
private IRange _sharedXVisibleRange;
public IRange SharedXVisibleRange
{
get => _sharedXVisibleRange;
set
{
_sharedXVisibleRange = value;
OnPropertyChanged(nameof(SharedXVisibleRange));
}
}
public IXyDataSeries<double, double> DataSeries { get; }
public UseHighQualityRenderingViewModel()
{
DataSeries = CreateDataSeries();
}
private IXyDataSeries<double, double> CreateDataSeries()
{
const int count = 1000;
var dataSeries = new XyDataSeries<double>();
for (int i = 0; i < count; i++)
{
dataSeries.Append(i, count * Math.Sin(i * Math.PI * 0.1) / i);
}
return dataSeries;
}
}
}