WPF Chart - Examples
SciChart WPF ships with hundreds of WPF Chart Examples which you can browse, play with, view the source-code and even export each WPF Chart Example to a stand-alone Visual Studio solution. All of this is possible with the new and improved SciChart WPF Examples Suite, which ships as part of the SciChart WPF SDK.
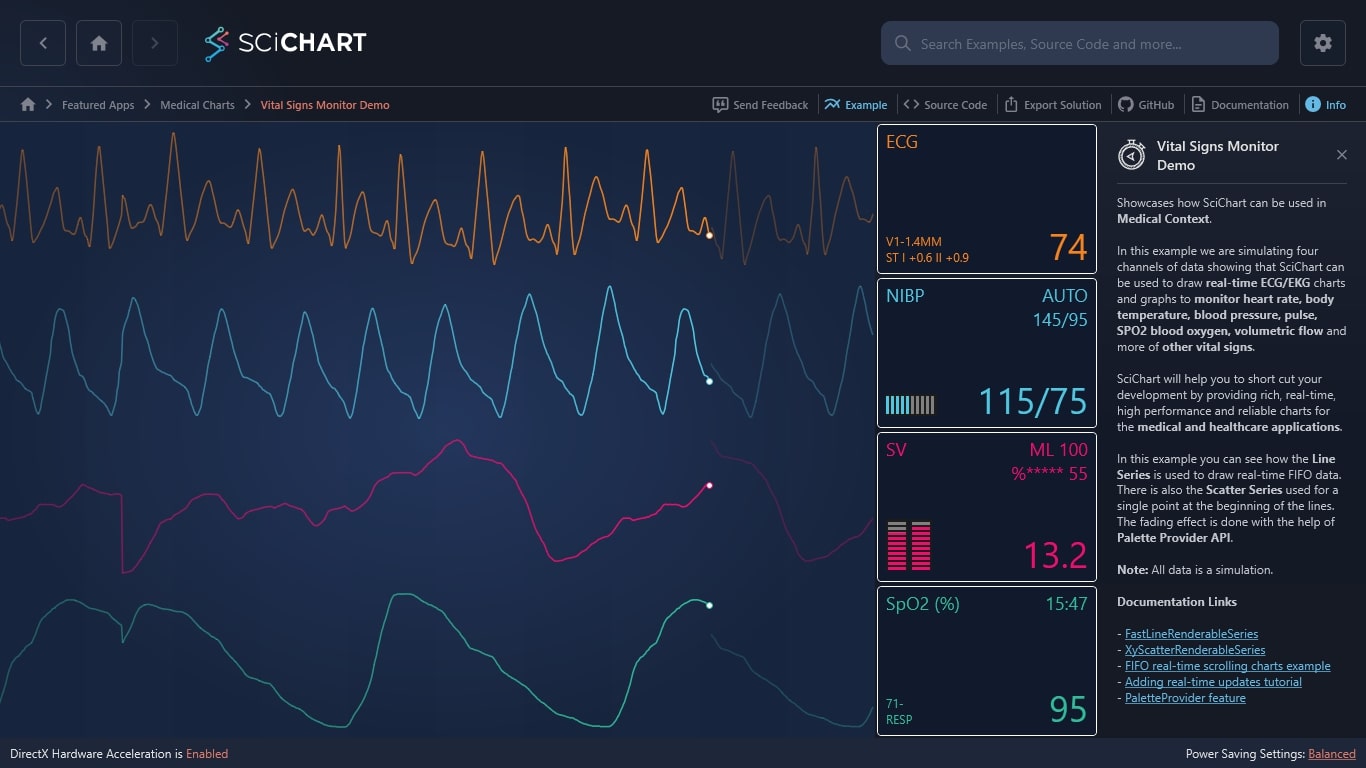
Showcases how SciChart can be used in Medical context.
In this example we are simulating four channels of data showing that SciChart can be used to draw real-time ECG/EKG charts and graphs to monitor heart rate, body temperature, blood pressure, pulse, SPO2 blood oxygen, volumetric flow and more of other vital signs.
SciChart will help you to short cut your development by providing rich, realtime, high performance and reliable charts for the medical and healthcare applications.
In this example you can see how the Line RenderableSeries (FastLineRenderableSeries) is used to draw realtime FIFO data. There is also one scatter (XyScatterRenderableSeries) point used for the dot at the beginning of the lines. The fading effect is done with the help of Palette Provider API.
Learn more from documentation:
– FIFO realtime scrolling charts example

The C#/WPF source code for the WPF Vital Signs ECG/EKG Medical Demo example is included below (Scroll down!).
Did you know you can also view the source code from one of the following sources as well?
- Clone the SciChart.WPF.Examples from Github.
- Or, view source in the SciChart WPF Examples suite.
- Also the SciChart WPF Trial contains the full source for the examples (link below).
VitalSignsBatch.cs
View source code// *************************************************************************************
// SCICHART® Copyright SciChart Ltd. 2011-2022. All rights reserved.
//
// Web: http://www.scichart.com
// Support: support@scichart.com
// Sales: sales@scichart.com
//
// VitalSignsBatch.cs is part of the SCICHART® Examples. Permission is hereby granted
// to modify, create derivative works, distribute and publish any part of this source
// code whether for commercial, private or personal use.
//
// The SCICHART® examples are distributed in the hope that they will be useful, but
// without any warranty. It is provided "AS IS" without warranty of any kind, either
// expressed or implied.
// *************************************************************************************
using System.Collections.Generic;
using System.Linq;
using SciChart.Examples.ExternalDependencies.Data;
namespace SciChart.Examples.Examples.SeeFeaturedApplication.VitalSignsMonitor
{
public class VitalSignsBatch
{
public VitalSignsBatch()
{
XValues = new List<double>();
ECGHeartRateValuesA = new List<double>();
BloodPressureValuesA = new List<double>();
BloodVolumeValuesA = new List<double>();
BloodOxygenationValuesA = new List<double>();
ECGHeartRateValuesB = new List<double>();
BloodPressureValuesB = new List<double>();
BloodVolumeValuesB = new List<double>();
BloodOxygenationValuesB = new List<double>();
}
public List<double> XValues { get; }
public List<double> ECGHeartRateValuesA { get; }
public List<double> BloodPressureValuesA { get; }
public List<double> BloodVolumeValuesA { get; }
public List<double> BloodOxygenationValuesA { get; }
public List<double> ECGHeartRateValuesB { get; set; }
public List<double> BloodPressureValuesB { get; set; }
public List<double> BloodVolumeValuesB { get; set; }
public List<double> BloodOxygenationValuesB { get; set; }
public VitalSignsData LastVitalSignsData { get; private set; }
public void UpdateData(IList<VitalSignsData> dataList)
{
XValues.Clear();
ECGHeartRateValuesA.Clear();
BloodPressureValuesA.Clear();
BloodVolumeValuesA.Clear();
BloodOxygenationValuesA.Clear();
ECGHeartRateValuesB.Clear();
BloodPressureValuesB.Clear();
BloodVolumeValuesB.Clear();
BloodOxygenationValuesB.Clear();
foreach (VitalSignsData data in dataList)
{
XValues.Add(data.XValue);
if (data.IsATrace)
{
ECGHeartRateValuesA.Add(data.ECGHeartRate);
BloodPressureValuesA.Add(data.BloodPressure);
BloodVolumeValuesA.Add(data.BloodVolume);
BloodOxygenationValuesA.Add(data.BloodOxygenation);
ECGHeartRateValuesB.Add(double.NaN);
BloodPressureValuesB.Add(double.NaN);
BloodVolumeValuesB.Add(double.NaN);
BloodOxygenationValuesB.Add(double.NaN);
}
else
{
ECGHeartRateValuesB.Add(data.ECGHeartRate);
BloodPressureValuesB.Add(data.BloodPressure);
BloodVolumeValuesB.Add(data.BloodVolume);
BloodOxygenationValuesB.Add(data.BloodOxygenation);
ECGHeartRateValuesA.Add(double.NaN);
BloodPressureValuesA.Add(double.NaN);
BloodVolumeValuesA.Add(double.NaN);
BloodOxygenationValuesA.Add(double.NaN);
}
}
LastVitalSignsData = dataList.Last();
}
}
}VitalSignsDataProvider.cs
View source code// *************************************************************************************
// SCICHART® Copyright SciChart Ltd. 2011-2022. All rights reserved.
//
// Web: http://www.scichart.com
// Support: support@scichart.com
// Sales: sales@scichart.com
//
// VitalSignsDataProvider.cs is part of the SCICHART® Examples. Permission is hereby
// granted to modify, create derivative works, distribute and publish any part of this
// source code whether for commercial, private or personal use.
//
// The SCICHART® examples are distributed in the hope that they will be useful, but
// without any warranty. It is provided "AS IS" without warranty of any kind, either
// expressed or implied.
// *************************************************************************************
using System;
using System.Collections.Generic;
using System.Linq;
using System.Reactive.Linq;
using SciChart.Data.Model;
using SciChart.Examples.ExternalDependencies.Data;
namespace SciChart.Examples.Examples.SeeFeaturedApplication.VitalSignsMonitor
{
public class VitalSignsDataProvider
{
private readonly TimeSpan _period;
private readonly IList<VitalSignsData> _vitalSignsData;
private int _currentIndex;
private int _totalIndex;
private bool _isATrace;
public VitalSignsDataProvider(TimeSpan period)
{
_period = period;
_vitalSignsData = DataManager.Instance.GetVitalSignsData();
}
public IObservable<VitalSignsData> Data => Observable.Interval(_period).Select(t => OnNext());
protected VitalSignsData OnNext()
{
if (_currentIndex >= _vitalSignsData.Count)
_currentIndex = 0;
var data = _vitalSignsData[_currentIndex];
data.XValue = _totalIndex * 10 / 800f % 10;
data.IsATrace = _isATrace;
_currentIndex += 10;
_totalIndex++;
if (_totalIndex % 800 == 0)
_isATrace = !_isATrace;
return data;
}
public DoubleRange EcgHeartRateRange => GetRange(_vitalSignsData.Select(x => x.ECGHeartRate));
public DoubleRange BloodPressureRange => GetRange(_vitalSignsData.Select(x => x.BloodPressure));
public DoubleRange BloodVolumeRange => GetRange(_vitalSignsData.Select(x => x.BloodVolume));
public DoubleRange BloodOxygenationRange => GetRange(_vitalSignsData.Select(x => x.BloodOxygenation));
private DoubleRange GetRange(IEnumerable<double> values)
{
var min = double.MaxValue;
var max = double.MinValue;
foreach (var value in values)
{
if (value < min) min = value;
if (value > max) max = value;
}
return new DoubleRange(min, max);
}
}
}VitalSignsIndicatorsProvider.cs
View source code// *************************************************************************************
// SCICHART® Copyright SciChart Ltd. 2011-2022. All rights reserved.
//
// Web: http://www.scichart.com
// Support: support@scichart.com
// Sales: sales@scichart.com
//
// VitalSignsIndicatorsProvider.cs is part of the SCICHART® Examples. Permission is hereby
// granted to modify, create derivative works, distribute and publish any part of this
// source code whether for commercial, private or personal use.
//
// The SCICHART® examples are distributed in the hope that they will be useful, but
// without any warranty. It is provided "AS IS" without warranty of any kind, either
// expressed or implied.
// *************************************************************************************
using System;
using System.Collections.Generic;
namespace SciChart.Examples.Examples.SeeFeaturedApplication.VitalSignsMonitor
{
public class VitalSignsIndicatorsProvider
{
private readonly Random _random = new Random();
private static readonly string[] BpmValues = { "67", "69", "72", "74" };
private static readonly string[] BpValues = { "120/70", "115/70", "115/75", "120/80" };
private static readonly string[] BvValues = { "13.1", "13.2", "13.3", "13.0" };
private static readonly int[] BpbValues = { 50, 75, 100 };
private static readonly int[] BvbValues = { 75, 90, 100 };
private static readonly string[] BoValues = { "93", "95", "96", "97" };
public string BpmValue { get; private set; } = BpmValues[0];
public string BpValue { get; private set; } = BpValues[0];
public string BvValue { get; private set; } = BvValues[0];
public int BpbValue { get; private set; } = BpbValues[0];
public int BvBar1Value { get; private set; } = BvbValues[0];
public int BvBar2Value { get; private set; } = BvbValues[0];
public string SpoValue { get; private set; } = BoValues[0];
public string SpoClockValue { get; private set; } = GetTimeString();
public void Update()
{
BpmValue = RandomString(BpmValues);
BpValue = RandomString(BpValues);
BpbValue = RandomInt(BpbValues);
BvValue = RandomString(BvValues);
BvBar1Value = RandomInt(BvbValues);
BvBar2Value = RandomInt(BvbValues);
SpoValue = RandomString(BoValues);
SpoClockValue = GetTimeString();
}
private string RandomString(IReadOnlyList<string> values)
{
return values[_random.Next(values.Count)];
}
private int RandomInt(IReadOnlyList<int> values)
{
return values[_random.Next(values.Count)];
}
private static string GetTimeString()
{
return DateTime.Now.ToString("HH:mm");
}
}
}VitalSignsMonitorView.xaml
View source code<UserControl x:Class="SciChart.Examples.Examples.SeeFeaturedApplication.VitalSignsMonitor.VitalSignsMonitorView"
xmlns="http://schemas.microsoft.com/winfx/2006/xaml/presentation"
xmlns:x="http://schemas.microsoft.com/winfx/2006/xaml"
xmlns:mc="http://schemas.openxmlformats.org/markup-compatibility/2006"
xmlns:d="http://schemas.microsoft.com/expression/blend/2008"
xmlns:s="http://schemas.abtsoftware.co.uk/scichart"
mc:Ignorable="d"
d:DesignHeight="450"
d:DesignWidth="800">
<UserControl.Resources>
<SolidColorBrush x:Key="HeartRateBrush" Color="#FF42B649"/>
<SolidColorBrush x:Key="BloodPressureBrush" Color="#FFFFFF00"/>
<SolidColorBrush x:Key="BloodVolumeBrush" Color="#FFB0C4DE"/>
<SolidColorBrush x:Key="BloodOxygenationBrush" Color="#FF6495ED"/>
<ItemsPanelTemplate x:Key="YAxesPanel">
<Grid>
<Grid.RowDefinitions>
<RowDefinition Height="10"/>
<RowDefinition Height="*"/>
<RowDefinition Height="20"/>
<RowDefinition Height="*"/>
<RowDefinition Height="20"/>
<RowDefinition Height="*"/>
<RowDefinition Height="20"/>
<RowDefinition Height="*"/>
<RowDefinition Height="10"/>
</Grid.RowDefinitions>
<Grid.ColumnDefinitions>
<ColumnDefinition Width="Auto"/>
</Grid.ColumnDefinitions>
</Grid>
</ItemsPanelTemplate>
<Style x:Key="MonitorBorderStyle" TargetType="{x:Type Border}">
<Setter Property="MinWidth" Value="220"/>
<Setter Property="MinHeight" Value="100"/>
<Setter Property="Margin" Value="2"/>
<Setter Property="Padding" Value="8,4,8,8"/>
<Setter Property="CornerRadius" Value="4"/>
<Setter Property="BorderThickness" Value="1"/>
<Setter Property="BorderBrush" Value="White"/>
<Setter Property="Background" Value="#1C1C1C"/>
</Style>
<Style x:Key="MonitorLargeTextBlockStyle" TargetType="{x:Type TextBlock}">
<Setter Property="FontSize" Value="36"/>
<Setter Property="TextAlignment" Value="Right"/>
<Setter Property="Margin" Value="0,0,0,-4"/>
<Setter Property="DockPanel.Dock" Value="Bottom"/>
</Style>
<Style x:Key="MonitorMiddleTextBlockStyle" TargetType="{x:Type TextBlock}">
<Setter Property="FontSize" Value="18"/>
<Setter Property="TextAlignment" Value="Left"/>
<Setter Property="DockPanel.Dock" Value="Top"/>
</Style>
<Style x:Key="MonitorSmallTextBlockStyle" TargetType="{x:Type TextBlock}">
<Setter Property="FontSize" Value="12"/>
<Setter Property="TextAlignment" Value="Left"/>
<Setter Property="DockPanel.Dock" Value="Bottom"/>
</Style>
<Style x:Key="MonitorIconTextBlockStyle" TargetType="{x:Type TextBlock}">
<Setter Property="FontSize" Value="24"/>
<Setter Property="FontFamily" Value="Segoe UI Symbol"/>
<Setter Property="TextAlignment" Value="Right"/>
<Setter Property="Margin" Value="0,-4,0,0"/>
<Setter Property="DockPanel.Dock" Value="Top"/>
</Style>
<Style x:Key="MonitorProgressBarStyle" TargetType="{x:Type ProgressBar}">
<Setter Property="Background" Value="Gray"/>
<Setter Property="HorizontalAlignment" Value="Left"/>
<Setter Property="DockPanel.Dock" Value="Bottom"/>
<Setter Property="Margin" Value="0,0,0,4"/>
<Setter Property="Template">
<Setter.Value>
<ControlTemplate TargetType="{x:Type ProgressBar}">
<Grid Width="50"
Height="20"
HorizontalAlignment="Left"
Background="{TemplateBinding Background}">
<Border x:Name="PART_Indicator"
HorizontalAlignment="Left"
Background="{TemplateBinding Foreground}"/>
<Border x:Name="PART_Track">
<Border.Background>
<DrawingBrush TileMode="Tile"
Viewport="0,0,5,20"
ViewportUnits="Absolute"
Viewbox="0,0,5,20"
ViewboxUnits="Absolute">
<DrawingBrush.Drawing>
<GeometryDrawing>
<GeometryDrawing.Geometry>
<GeometryGroup>
<LineGeometry StartPoint="4,0" EndPoint="4,20"/>
</GeometryGroup>
</GeometryDrawing.Geometry>
<GeometryDrawing.Pen>
<Pen Thickness="2" Brush="#1C1C1C"/>
</GeometryDrawing.Pen>
</GeometryDrawing>
</DrawingBrush.Drawing>
</DrawingBrush>
</Border.Background>
</Border>
<Border Margin="-1"
BorderThickness="0,2,2,2"
BorderBrush="#1C1C1C"/>
</Grid>
</ControlTemplate>
</Setter.Value>
</Setter>
</Style>
</UserControl.Resources>
<Grid>
<Grid.RowDefinitions>
<RowDefinition Height="*"/>
<RowDefinition Height="*"/>
<RowDefinition Height="*"/>
<RowDefinition Height="*"/>
</Grid.RowDefinitions>
<Grid.ColumnDefinitions>
<ColumnDefinition Width="*"/>
<ColumnDefinition Width="Auto"/>
</Grid.ColumnDefinitions>
<s:SciChartSurface Grid.RowSpan="4"
x:Name="Surface"
LeftAxesPanelTemplate="{StaticResource YAxesPanel}"
RightAxesPanelTemplate="{StaticResource YAxesPanel}"
s:VisualXcceleratorEngine.EnableImpossibleMode="False"/>
<Border Grid.Row="0" Grid.Column="1" Style="{StaticResource MonitorBorderStyle}">
<Grid>
<DockPanel LastChildFill="False">
<TextBlock Text="ECG"
Foreground="{StaticResource HeartRateBrush}"
Style="{StaticResource MonitorMiddleTextBlockStyle}"/>
<TextBlock Foreground="{StaticResource HeartRateBrush}"
Style="{StaticResource MonitorSmallTextBlockStyle}">
<Run Text="V1-1.4MM"/>
<LineBreak/>
<Run Text="ST I +0.6 II +0.9"/>
</TextBlock>
</DockPanel>
<DockPanel LastChildFill="False">
<TextBlock Text="❤"
x:Name="HeartBeatIcon"
Foreground="{StaticResource HeartRateBrush}"
Style="{StaticResource MonitorIconTextBlockStyle}"/>
<TextBlock x:Name="HeartRateIndicator"
Foreground="{StaticResource HeartRateBrush}"
Style="{StaticResource MonitorLargeTextBlockStyle}"/>
</DockPanel>
</Grid>
</Border>
<Border Grid.Row="1" Grid.Column="1" Style="{StaticResource MonitorBorderStyle}">
<Grid>
<DockPanel LastChildFill="False">
<TextBlock Text="NIBP"
Foreground="{StaticResource BloodPressureBrush}"
Style="{StaticResource MonitorMiddleTextBlockStyle}"/>
<ProgressBar x:Name="BloodPressureBar"
Foreground="{StaticResource BloodPressureBrush}"
Style="{StaticResource MonitorProgressBarStyle}"/>
</DockPanel>
<DockPanel LastChildFill="False">
<TextBlock TextAlignment="Right"
Foreground="{StaticResource BloodPressureBrush}"
Style="{StaticResource MonitorMiddleTextBlockStyle}">
<Run Text="AUTO"/>
<LineBreak/>
<Run Text="145/95"/>
</TextBlock>
<TextBlock x:Name="BloodPressureIndicator"
Foreground="{StaticResource BloodPressureBrush}"
Style="{StaticResource MonitorLargeTextBlockStyle}"/>
</DockPanel>
</Grid>
</Border>
<Border Grid.Row="2" Grid.Column="1" Style="{StaticResource MonitorBorderStyle}">
<Grid>
<DockPanel LastChildFill="False">
<TextBlock Text="SV"
Foreground="{StaticResource BloodVolumeBrush}"
Style="{StaticResource MonitorMiddleTextBlockStyle}"/>
<StackPanel DockPanel.Dock="Bottom" Margin="-4,0,0,0">
<StackPanel.RenderTransform>
<RotateTransform CenterX="25" CenterY="20" Angle="-90"/>
</StackPanel.RenderTransform>
<ProgressBar x:Name="BloodVolumeBar1"
Foreground="{StaticResource BloodVolumeBrush}"
Style="{StaticResource MonitorProgressBarStyle}"/>
<ProgressBar x:Name="BloodVolumeBar2"
Foreground="{StaticResource BloodVolumeBrush}"
Style="{StaticResource MonitorProgressBarStyle}"/>
</StackPanel>
</DockPanel>
<DockPanel LastChildFill="False">
<TextBlock TextAlignment="Right"
Foreground="{StaticResource BloodVolumeBrush}"
Style="{StaticResource MonitorMiddleTextBlockStyle}">
<Run Text="ML 100"/>
<LineBreak/>
<Run Text="%***** 55"/>
</TextBlock>
<TextBlock x:Name="BloodVolumeIndicator"
Foreground="{StaticResource BloodVolumeBrush}"
Style="{StaticResource MonitorLargeTextBlockStyle}"/>
</DockPanel>
</Grid>
</Border>
<Border Grid.Row="3" Grid.Column="1" Style="{StaticResource MonitorBorderStyle}">
<Grid>
<DockPanel LastChildFill="False">
<TextBlock Text="SpO2 (%)"
Foreground="{StaticResource BloodOxygenationBrush}"
Style="{StaticResource MonitorMiddleTextBlockStyle}"/>
<TextBlock Foreground="{StaticResource BloodOxygenationBrush}"
Style="{StaticResource MonitorSmallTextBlockStyle}">
<Run Text="71-"/>
<LineBreak/>
<Run Text="RESP"/>
</TextBlock>
</DockPanel>
<DockPanel LastChildFill="False">
<TextBlock x:Name="BloodOxygenClock"
TextAlignment="Right"
Foreground="{StaticResource BloodOxygenationBrush}"
Style="{StaticResource MonitorMiddleTextBlockStyle}"/>
<TextBlock x:Name="BloodOxygenIndicator"
Foreground="{StaticResource BloodOxygenationBrush}"
Style="{StaticResource MonitorLargeTextBlockStyle}"/>
</DockPanel>
</Grid>
</Border>
</Grid>
</UserControl>VitalSignsMonitorView.xaml.cs
View source codeusing System;
using System.Collections.Generic;
using System.Reactive.Disposables;
using System.Reactive.Linq;
using System.Threading;
using System.Windows;
using System.Windows.Controls;
using System.Windows.Media;
using SciChart.Charting.Model.DataSeries;
using SciChart.Charting.Visuals.Axes;
using SciChart.Charting.Visuals.PointMarkers;
using SciChart.Charting.Visuals.RenderableSeries;
using SciChart.Core.Extensions;
using SciChart.Data.Model;
using SciChart.Examples.ExternalDependencies.Data;
namespace SciChart.Examples.Examples.SeeFeaturedApplication.VitalSignsMonitor
{
public partial class VitalSignsMonitorView : UserControl
{
private const int FifoCapacity = 800;
private readonly XyDataSeries<double> _ecgDataSeries = CreateDataSeries(FifoCapacity);
private readonly XyDataSeries<double> _ecgSweepDataSeries = CreateDataSeries(FifoCapacity);
private readonly XyDataSeries<double> _bloodPressureDataSeries = CreateDataSeries(FifoCapacity);
private readonly XyDataSeries<double> _bloodPressureSweepDataSeries = CreateDataSeries(FifoCapacity);
private readonly XyDataSeries<double> _bloodVolumeDataSeries = CreateDataSeries(FifoCapacity);
private readonly XyDataSeries<double> _bloodVolumeSweepDataSeries = CreateDataSeries(FifoCapacity);
private readonly XyDataSeries<double> _bloodOxygenationDataSeries = CreateDataSeries(FifoCapacity);
private readonly XyDataSeries<double> _bloodOxygenationSweepDataSeries = CreateDataSeries(FifoCapacity);
private readonly XyDataSeries<double> _lastEcgSweepDataSeries = CreateDataSeries(1);
private readonly XyDataSeries<double> _lastBloodPressureDataSeries = CreateDataSeries(1);
private readonly XyDataSeries<double> _lastBloodVolumeDataSeries = CreateDataSeries(1);
private readonly XyDataSeries<double> _lastBloodOxygenationSweepDataSeries = CreateDataSeries(1);
private readonly VitalSignsDataProvider _dataProvider = new VitalSignsDataProvider(TimeSpan.FromMilliseconds(5));
private readonly VitalSignsIndicatorsProvider _indicatorsProvider = new VitalSignsIndicatorsProvider();
private readonly VitalSignsBatch _dataBatch = new VitalSignsBatch();
private IDisposable _dataSubscription;
public VitalSignsMonitorView()
{
InitializeComponent();
Loaded += OnLoaded;
Unloaded += OnUnloaded;
}
private void OnLoaded(object sender, RoutedEventArgs e)
{
SetupCharts();
UpdateIndicators();
var dataSubscription = _dataProvider.Data
.Buffer(TimeSpan.FromMilliseconds(50))
.ObserveOn(SynchronizationContext.Current)
.Do(UpdateCharts)
.Subscribe();
var indicatorSubscription = Observable
.Interval(TimeSpan.FromSeconds(1))
.ObserveOn(SynchronizationContext.Current)
.Do(UpdateIndicators)
.Subscribe();
_dataSubscription = new CompositeDisposable(dataSubscription, indicatorSubscription);
}
private void OnUnloaded(object sender, RoutedEventArgs e)
{
_dataSubscription.Dispose();
}
private void SetupCharts()
{
var xAxis = new NumericAxis
{
VisibleRange = new DoubleRange(0, 10),
AutoRange = AutoRange.Never,
DrawMajorGridLines = false,
DrawMinorGridLines = false,
Visibility = Visibility.Collapsed
};
const string ecgId = "ecgId";
const string bloodPressureId = "bloodPressureId";
const string bloodVolumeId = "bloodVolumeId";
const string bloodOxygenationId = "bloodOxygenationId";
var heartRateColor = GetResourceColor("HeartRateBrush");
var bloodPressureColor = GetResourceColor("BloodPressureBrush");
var bloodVolumeColor = GetResourceColor("BloodVolumeBrush");
var bloodOxygenation = GetResourceColor("BloodOxygenationBrush");
using (Surface.SuspendUpdates())
{
Surface.XAxes.Add(xAxis);
Surface.YAxes.Add(CreateYAxis(ecgId, _dataProvider.EcgHeartRateRange, 1));
Surface.YAxes.Add(CreateYAxis(bloodPressureId, _dataProvider.BloodPressureRange, 3));
Surface.YAxes.Add(CreateYAxis(bloodVolumeId, _dataProvider.BloodVolumeRange, 5));
Surface.YAxes.Add(CreateYAxis(bloodOxygenationId, _dataProvider.BloodOxygenationRange, 7));
var ecgSeries = CreateRenderableSeries(ecgId, _ecgDataSeries,
_ecgSweepDataSeries, _lastEcgSweepDataSeries, heartRateColor);
var bloodPressureSeries = CreateRenderableSeries(bloodPressureId, _bloodPressureDataSeries,
_bloodPressureSweepDataSeries, _lastBloodPressureDataSeries, bloodPressureColor);
var bloodVolumeSeries = CreateRenderableSeries(bloodVolumeId, _bloodVolumeDataSeries,
_bloodVolumeSweepDataSeries, _lastBloodVolumeDataSeries, bloodVolumeColor);
var bloodOxygenationSeries = CreateRenderableSeries(bloodOxygenationId, _bloodOxygenationDataSeries,
_bloodOxygenationSweepDataSeries, _lastBloodOxygenationSweepDataSeries, bloodOxygenation);
ecgSeries.ForEachDo(x => Surface.RenderableSeries.Add(x));
bloodPressureSeries.ForEachDo(x => Surface.RenderableSeries.Add(x));
bloodVolumeSeries.ForEachDo(x => Surface.RenderableSeries.Add(x));
bloodOxygenationSeries.ForEachDo(x => Surface.RenderableSeries.Add(x));
}
}
private void UpdateCharts(IList<VitalSignsData> data)
{
if (data.Count == 0) return;
_dataBatch.UpdateData(data);
using (Surface.SuspendUpdates())
{
var xValues = _dataBatch.XValues;
_ecgDataSeries.Append(xValues, _dataBatch.ECGHeartRateValuesA);
_ecgSweepDataSeries.Append(xValues, _dataBatch.ECGHeartRateValuesB);
_bloodPressureDataSeries.Append(xValues, _dataBatch.BloodPressureValuesA);
_bloodPressureSweepDataSeries.Append(xValues, _dataBatch.BloodPressureValuesB);
_bloodOxygenationDataSeries.Append(xValues, _dataBatch.BloodOxygenationValuesA);
_bloodOxygenationSweepDataSeries.Append(xValues, _dataBatch.BloodOxygenationValuesB);
_bloodVolumeDataSeries.Append(xValues, _dataBatch.BloodVolumeValuesA);
_bloodVolumeSweepDataSeries.Append(xValues, _dataBatch.BloodVolumeValuesB);
var lastEcgData = _dataBatch.LastVitalSignsData;
var xValue = lastEcgData.XValue;
_lastEcgSweepDataSeries.Append(xValue, lastEcgData.ECGHeartRate);
_lastBloodPressureDataSeries.Append(xValue, lastEcgData.BloodPressure);
_lastBloodOxygenationSweepDataSeries.Append(xValue, lastEcgData.BloodOxygenation);
_lastBloodVolumeDataSeries.Append(xValue, lastEcgData.BloodVolume);
}
}
private void UpdateIndicators(long time = 0L)
{
HeartBeatIcon.Visibility = time % 2 == 0 ? Visibility.Hidden : Visibility.Visible;
if (time % 5 == 0)
{
_indicatorsProvider.Update();
HeartRateIndicator.Text = _indicatorsProvider.BpmValue;
BloodPressureIndicator.Text = _indicatorsProvider.BpValue;
BloodPressureBar.Value = _indicatorsProvider.BpbValue;
BloodVolumeIndicator.Text = _indicatorsProvider.BvValue;
BloodVolumeBar1.Value = _indicatorsProvider.BvBar1Value;
BloodVolumeBar2.Value = _indicatorsProvider.BvBar2Value;
BloodOxygenIndicator.Text = _indicatorsProvider.SpoValue;
BloodOxygenClock.Text = _indicatorsProvider.SpoClockValue;
}
}
private Color GetResourceColor(string resourceKey)
{
return (FindResource(resourceKey) as SolidColorBrush)?.Color ?? Colors.White;
}
private NumericAxis CreateYAxis(string axisId, IRange visibleRange, int stackedIndex)
{
var yAxis = new NumericAxis
{
Id = axisId,
Width = 0d,
VisibleRange = visibleRange,
AutoRange = AutoRange.Never,
AxisAlignment = AxisAlignment.Right,
DrawMajorBands = false,
DrawMinorGridLines = false,
DrawMajorGridLines = false
};
Grid.SetRow(yAxis, stackedIndex);
return yAxis;
}
private static XyDataSeries<double> CreateDataSeries(int fifoCapacity)
{
return new XyDataSeries<double>
{
FifoCapacity = fifoCapacity,
AcceptsUnsortedData = true
};
}
private IEnumerable<IRenderableSeries> CreateRenderableSeries(string yAxisId,
IDataSeries baseSeries, IDataSeries sweepSeries, IDataSeries lastSeries, Color color)
{
const int strokeThickness = 1;
const int pointMarkerSize = 4;
var rs1 = new FastLineRenderableSeries
{
YAxisId = yAxisId,
DataSeries = baseSeries,
Stroke = color,
StrokeThickness = strokeThickness,
PaletteProvider = new VitalSignsPaletteProvider()
};
var rs2 = new FastLineRenderableSeries
{
YAxisId = yAxisId,
DataSeries = sweepSeries,
Stroke = color,
StrokeThickness = strokeThickness,
PaletteProvider = new VitalSignsPaletteProvider()
};
var rs3 = new XyScatterRenderableSeries
{
YAxisId = yAxisId,
DataSeries = lastSeries,
PointMarker = new EllipsePointMarker
{
Width = pointMarkerSize,
Height = pointMarkerSize,
Fill = color,
Stroke = Colors.White,
StrokeThickness = strokeThickness
}
};
return new IRenderableSeries[] { rs1, rs2, rs3 };
}
}
}VitalSignsPaletteProvider.cs
View source code// *************************************************************************************
// SCICHART® Copyright SciChart Ltd. 2011-2022. All rights reserved.
//
// Web: http://www.scichart.com
// Support: support@scichart.com
// Sales: sales@scichart.com
//
// VitalSignsPaletteProvider.cs is part of the SCICHART® Examples. Permission is hereby
// granted to modify, create derivative works, distribute and publish any part of this
// source code whether for commercial, private or personal use.
//
// The SCICHART® examples are distributed in the hope that they will be useful, but
// without any warranty. It is provided "AS IS" without warranty of any kind, either
// expressed or implied.
// *************************************************************************************
using System.Windows.Media;
using SciChart.Charting.Model.DataSeries;
using SciChart.Charting.Visuals.PaletteProviders;
using SciChart.Charting.Visuals.RenderableSeries;
using SciChart.Data.Model;
namespace SciChart.Examples.Examples.SeeFeaturedApplication.VitalSignsMonitor
{
public class VitalSignsPaletteProvider : IStrokePaletteProvider
{
private readonly byte _defaultAlpha;
private readonly byte _diffAlpha;
public Values<Color> Colors { get; } = new Values<Color>();
public VitalSignsPaletteProvider(byte defaultAlpha = 50)
{
_defaultAlpha = defaultAlpha;
_diffAlpha = (byte)(255 - defaultAlpha);
}
public void OnBeginSeriesDraw(IRenderableSeries rSeries)
{
var defaultColor = rSeries.Stroke;
var count = rSeries.DataSeries.Count;
if (Colors.Count != count)
{
Colors.Count = count;
for (int i = 0; i < count; i++)
{
var color = defaultColor;
color.A = (byte)(_defaultAlpha + _diffAlpha * i / count);
Colors.Items[i] = color;
}
}
}
public Color? OverrideStrokeColor(IRenderableSeries rSeries, int index, IPointMetadata metadata)
{
return Colors.Items[index];
}
}
}