WPF Chart - Examples
SciChart WPF ships with hundreds of WPF Chart Examples which you can browse, play with, view the source-code and even export each WPF Chart Example to a stand-alone Visual Studio solution. All of this is possible with the new and improved SciChart WPF Examples Suite, which ships as part of the SciChart WPF SDK.
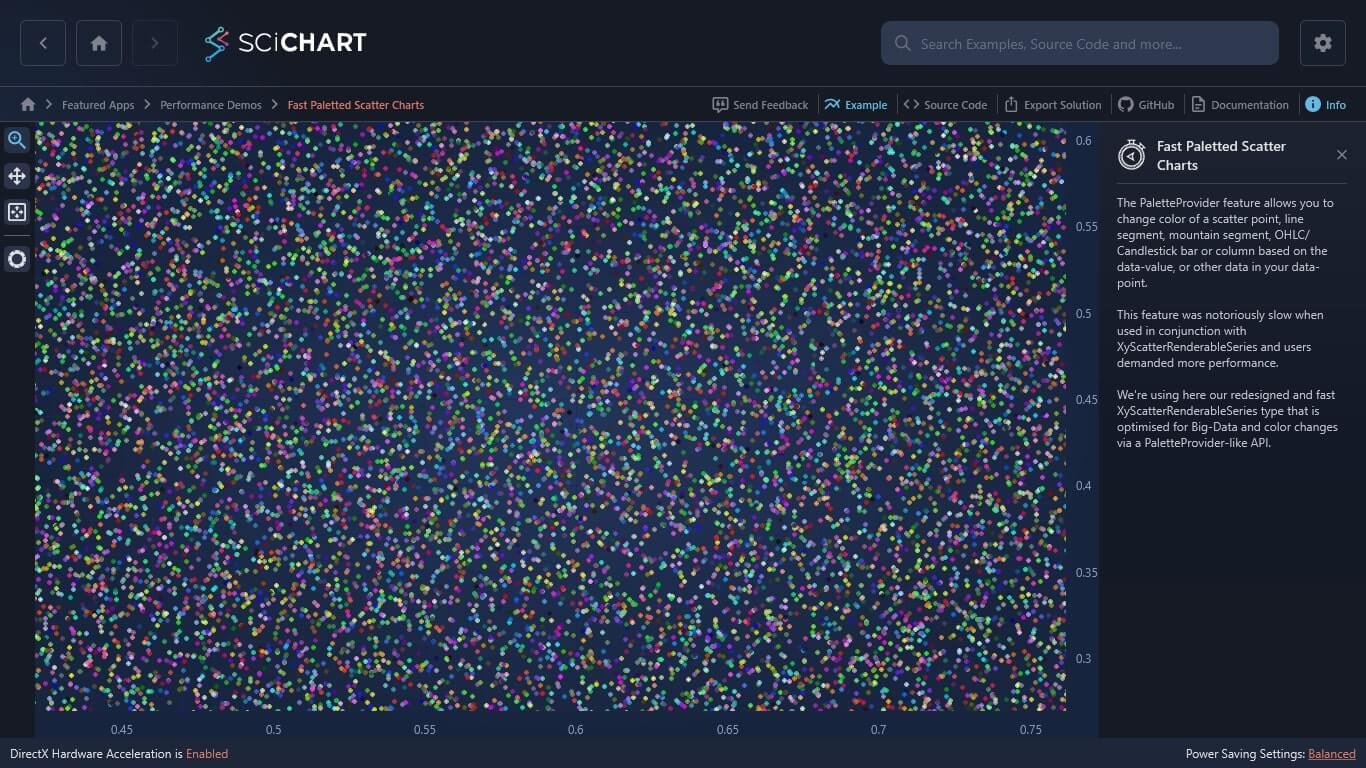
The PaletteProvider feature allows you to change color of a scatter point, line segment, mountain segment, OHLC/Candlestick bar or column based on the data-value, or other data in your data-point.
This feature was notoriously slow when used in conjunction with XyScatterRenderableSeries and users demanded more performance.
As a result, we developed the ExtremeScatterRenderableSeries – a DirectX only scatter series type optimised for Big-Data and color changes via a PaletteProvider-like API.

The C#/WPF source code for the WPF Fast Paletted Scatter Chart Example example is included below (Scroll down!).
Did you know you can also view the source code from one of the following sources as well?
- Clone the SciChart.WPF.Examples from Github.
- Or, view source in the SciChart WPF Examples suite.
- Also the SciChart WPF Trial contains the full source for the examples (link below).
FastPalettedScatterCharts.xaml
View source code<UserControl x:Class="SciChart.Examples.Examples.PerformanceDemos2D.ScatterPerf.FastPalettedScatterCharts"
xmlns="http://schemas.microsoft.com/winfx/2006/xaml/presentation"
xmlns:x="http://schemas.microsoft.com/winfx/2006/xaml"
xmlns:mc="http://schemas.openxmlformats.org/markup-compatibility/2006"
xmlns:d="http://schemas.microsoft.com/expression/blend/2008"
xmlns:s="http://schemas.abtsoftware.co.uk/scichart"
xmlns:ext="http://schemas.abtsoftware.co.uk/scichart/exampleExternals"
mc:Ignorable="d"
d:DesignHeight="500"
d:DesignWidth="800">
<Grid>
<Grid.ColumnDefinitions>
<ColumnDefinition Width="Auto"/>
<ColumnDefinition Width="*"/>
</Grid.ColumnDefinitions>
<!-- The SciChartInteractionToolbar adds zoom, pan, zoom extents and rotate functionality -->
<!-- to the chart and is included for example purposes. -->
<!-- If you wish to know how to zoom and pan a chart then do a search for Zoom Pan in the Examples suite! -->
<ext:SciChartInteractionToolbar TargetSurface="{Binding Source={x:Reference Name=sciChart}}"/>
<s:SciChartSurface x:Name="sciChart" Grid.Column="1">
<s:SciChartSurface.XAxis>
<s:NumericAxis/>
</s:SciChartSurface.XAxis>
<s:SciChartSurface.YAxis>
<s:NumericAxis/>
</s:SciChartSurface.YAxis>
<s:SciChartSurface.Annotations>
<s:TextAnnotation x:Name="warningText"
Text="The ExtremeScatterRenderableSeries is only available when DirectX hardware acceleration is available."
X1="0.5" Y1="0.5"
CoordinateMode="Relative"
HorizontalAnchorPoint="Center"
Foreground="#FF6600"/>
</s:SciChartSurface.Annotations>
</s:SciChartSurface>
</Grid>
</UserControl>FastPalettedScatterCharts.xaml.cs
View source codeusing System;
using System.Collections.Generic;
using System.Windows.Controls;
using System.Windows.Media;
using SciChart.Charting;
using SciChart.Charting.Model.DataSeries;
using SciChart.Charting.Visuals.PaletteProviders;
using SciChart.Charting.Visuals.PointMarkers;
using SciChart.Charting.Visuals.RenderableSeries;
using SciChart.Data.Model;
namespace SciChart.Examples.Examples.PerformanceDemos2D.ScatterPerf
{
/// <summary>
/// Interaction logic for FastPalettedScatterCharts.xaml
/// </summary>
public partial class FastPalettedScatterCharts : UserControl
{
public FastPalettedScatterCharts()
{
InitializeComponent();
if (VisualXcceleratorEngine.SupportsHardwareAcceleration)
{
warningText.IsHidden = true;
SetupScatterSeries();
}
else
{
warningText.IsHidden = false;
}
}
private void SetupScatterSeries()
{
var dataSeries = new XyDataSeries<double, double>() { AcceptsUnsortedData = true };
var random = new Random(0);
var dataPointColors = new List<Color>();
for (int i = 0; i < 100000; i++)
{
dataSeries.Append(random.NextDouble(), random.NextDouble());
dataPointColors.Add(GetRandomColor(random));
}
var scatterSeries = new XyScatterRenderableSeries()
{
PointMarker = new EllipsePointMarker() {Width = 5, Height = 5}
};
sciChart.RenderableSeries.Add(scatterSeries);
scatterSeries.DataSeries = dataSeries;
scatterSeries.PaletteProvider = new ScatterSeriesPaletteProvider(dataPointColors);
}
private static Color GetRandomColor(Random random)
{
return Color.FromArgb(0xFF, (byte)random.Next(255), (byte)random.Next(255), (byte)random.Next(255));
}
}
public class ScatterSeriesPaletteProvider : IPointMarkerPaletteProvider
{
private readonly List<Color> _dataPointColors;
private readonly Values<Color> _colors = new Values<Color>();
public ScatterSeriesPaletteProvider(List<Color> dataPointColors)
{
_dataPointColors = dataPointColors;
}
public void OnBeginSeriesDraw(IRenderableSeries rSeries)
{
}
public PointPaletteInfo? OverridePointMarker(IRenderableSeries rSeries, int index, IPointMetadata metadata)
{
var ppi = new PointPaletteInfo();
ppi.Stroke = _dataPointColors[index];
ppi.Fill = _dataPointColors[index];
return ppi;
}
}
}
