WPF Chart - Examples
SciChart WPF ships with hundreds of WPF Chart Examples which you can browse, play with, view the source-code and even export each WPF Chart Example to a stand-alone Visual Studio solution. All of this is possible with the new and improved SciChart WPF Examples Suite, which ships as part of the SciChart WPF SDK.
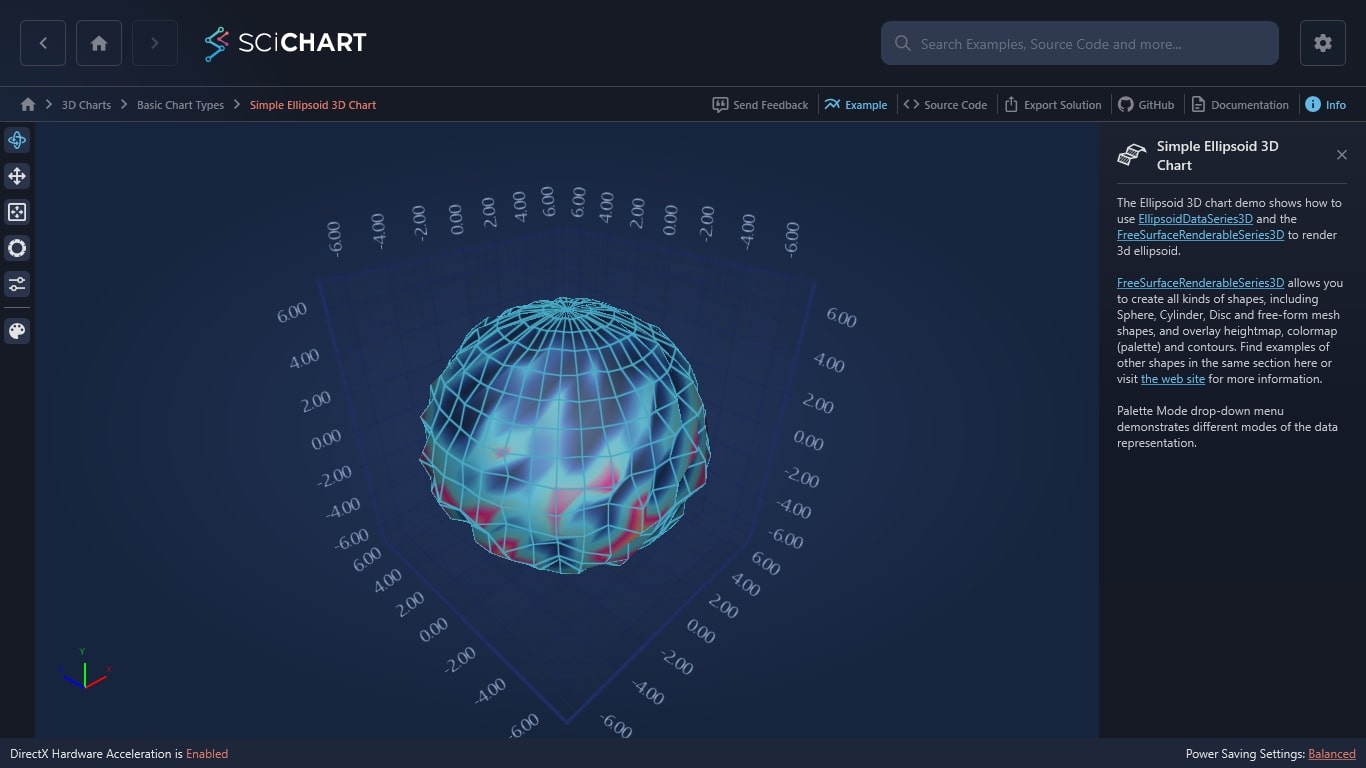
Our WPF 3D chart software and Ellipsoid 3D chart demo shows how to use EllipsoidDataSeries3D in real-time to render to a 3D FreeSurfaceRenderableSeries3D.The Free Surface Mesh colors and palette can be udpated by supplying a MeshColorPalette, which wraps a LinearGradientBrush.Many mesh options are available such as Wireframe, SolidMesh, Solid with Wireframe, and many paletting options such as Solid Cells, Interpolated Cells and Textured.

The C#/WPF source code for the WPF 3D Chart RealTime 3D Ellipsoid Mesh Example example is included below (Scroll down!).
Did you know you can also view the source code from one of the following sources as well?
- Clone the SciChart.WPF.Examples from Github.
- Or, view source in the SciChart WPF Examples suite.
- Also the SciChart WPF Trial contains the full source for the examples (link below).
CreateRealTime3DGeoidChart.xaml
View source code<UserControl x:Class="SciChart.Examples.Examples.Charts3D.CreateRealtime3DCharts.CreateRealTime3DGeoidChart"
xmlns="http://schemas.microsoft.com/winfx/2006/xaml/presentation"
xmlns:x="http://schemas.microsoft.com/winfx/2006/xaml"
xmlns:mc="http://schemas.openxmlformats.org/markup-compatibility/2006"
xmlns:s3D="http://schemas.abtsoftware.co.uk/scichart3D"
xmlns:d="http://schemas.microsoft.com/expression/blend/2008"
xmlns:ext="http://schemas.abtsoftware.co.uk/scichart/exampleExternals"
xmlns:system="clr-namespace:System;assembly=mscorlib"
mc:Ignorable="d"
d:DesignHeight="400"
d:DesignWidth="600">
<UserControl.Resources>
<!-- Simulates a Linear Interpolated color map -->
<s3D:GradientColorPalette x:Key="MeshColorPalette" IsStepped="False">
<s3D:GradientColorPalette.GradientStops>
<GradientStop Offset="1" Color="DarkRed"/>
<GradientStop Offset="0.7" Color="Red"/>
<GradientStop Offset="0.5" Color="Yellow"/>
<GradientStop Offset="0.01" Color="GreenYellow"/>
<GradientStop Offset="0.0075" Color="Cyan"/>
<GradientStop Offset="0.005" Color="Blue"/>
<GradientStop Offset="0.0" Color="#1D2C6B"/>
</s3D:GradientColorPalette.GradientStops>
</s3D:GradientColorPalette>
</UserControl.Resources>
<Grid>
<Grid.ColumnDefinitions>
<ColumnDefinition Width="Auto"/>
<ColumnDefinition Width="*"/>
</Grid.ColumnDefinitions>
<ext:SciChart3DInteractionToolbar TargetSurface="{Binding Source={x:Reference Name=SciChart3DSurface}}">
<ext:FlyoutSeparator Background="#444"/>
<ToggleButton x:Name="StartButton" Click="StartButton_Click" Style="{StaticResource PlayButtonStyle}" Padding="4"/>
<ToggleButton x:Name="PauseButton" Click="PauseButton_Click" Style="{StaticResource PauseButtonStyle}" Padding="7"/>
<ext:FlyoutSeparator Background="#444"/>
<ext:FlyoutMenuButton Style="{StaticResource FlyoutMenuButtonStyle}" Content="MESH" FontSize="9" Padding="0">
<ext:FlyoutMenuButton.PopupContent>
<StackPanel Orientation="Vertical" MinWidth="150">
<TextBlock Text="Opacity" FontSize="11"/>
<ext:FlyoutSeparator/>
<ComboBox x:Name="OpacityCombo" SelectedIndex="0" Margin="3,5" FontSize="11">
<ComboBox.Items>
<system:Double>1.0</system:Double>
<system:Double>0.8</system:Double>
<system:Double>0.5</system:Double>
<system:Double>0.3</system:Double>
<system:Double>0.0</system:Double>
</ComboBox.Items>
</ComboBox>
<TextBlock Text="Draw Mesh As" FontSize="11"/>
<ext:FlyoutSeparator/>
<ComboBox x:Name="DrawMeshAsCombo" SelectedIndex="0" Margin="3,5" FontSize="11">
<ComboBox.Items>
<s3D:DrawMeshAs>SolidMesh</s3D:DrawMeshAs>
<s3D:DrawMeshAs>SolidWireFrame</s3D:DrawMeshAs>
<s3D:DrawMeshAs>Wireframe</s3D:DrawMeshAs>
</ComboBox.Items>
</ComboBox>
</StackPanel>
</ext:FlyoutMenuButton.PopupContent>
</ext:FlyoutMenuButton>
<ext:FlyoutMenuButton Style="{StaticResource FlyoutMenuButtonStyle}" Content="DATA" FontSize="9" Padding="0">
<ext:FlyoutMenuButton.PopupContent>
<StackPanel Orientation="Vertical" MinWidth="150" >
<TextBlock Text="Choose what data to Render" FontSize="11"/>
<ext:FlyoutSeparator/>
<ComboBox x:Name="DataCombo" SelectedIndex="2" Margin="3,5" SelectionChanged="DataCombo_OnSelectionChanged" FontSize="11">
<ComboBox.Items>
<system:String>3D Geoid 10 x 10</system:String>
<system:String>3D Geoid 50 x 50</system:String>
<system:String>3D Geoid 100 x 100</system:String>
<system:String>3D Geoid 500 x 500</system:String>
<system:String>3D Geoid 1k x 1k</system:String>
</ComboBox.Items>
</ComboBox>
<TextBlock Text="Change scale of the Displacement Map" FontSize="11"/>
<ext:FlyoutSeparator/>
<Slider x:Name="sliderHeightOffsetsScale"
Width="200"
Margin="3"
HorizontalAlignment="Left"
Minimum="0" Maximum="1"
Orientation="Horizontal"
Value="0.5" />
</StackPanel>
</ext:FlyoutMenuButton.PopupContent>
</ext:FlyoutMenuButton>
</ext:SciChart3DInteractionToolbar>
<s3D:SciChart3DSurface x:Name="SciChart3DSurface" Grid.Column="1" WorldDimensions="200,200,200" BorderThickness="0">
<s3D:SciChart3DSurface.Camera>
<s3D:Camera3D ZoomToFitOnAttach="True"/>
</s3D:SciChart3DSurface.Camera>
<s3D:SciChart3DSurface.RenderableSeries>
<s3D:FreeSurfaceRenderableSeries3D x:Name="SurfaceMesh"
DrawMeshAs="{Binding Source={x:Reference DrawMeshAsCombo}, Path=SelectedItem}"
Stroke="#77228B22"
ContourStroke="#77228B22"
StrokeThickness="2.0"
Opacity="{Binding Source={x:Reference OpacityCombo}, Path=SelectedItem}"
MeshColorPalette="{StaticResource MeshColorPalette}"
PaletteMinimum="0.0, 6.0, 0.0" PaletteMaximum="0.0, 7.0, 0.0" />
</s3D:SciChart3DSurface.RenderableSeries>
<s3D:SciChart3DSurface.XAxis>
<s3D:NumericAxis3D VisibleRange="-8,8" AutoRange="Never" />
</s3D:SciChart3DSurface.XAxis>
<s3D:SciChart3DSurface.YAxis>
<s3D:NumericAxis3D VisibleRange="-8,8" AutoRange="Never" />
</s3D:SciChart3DSurface.YAxis>
<s3D:SciChart3DSurface.ZAxis>
<s3D:NumericAxis3D VisibleRange="-8,8" AutoRange="Never" />
</s3D:SciChart3DSurface.ZAxis>
</s3D:SciChart3DSurface>
</Grid>
</UserControl>
CreateRealTime3DGeoidChart.xaml.cs
View source code// *************************************************************************************
// SCICHART® Copyright SciChart Ltd. 2011-2022. All rights reserved.
//
// Web: http://www.scichart.com
// Support: support@scichart.com
// Sales: sales@scichart.com
//
// CreateRealTime3DGeoidChart.xaml.cs is part of the SCICHART® Examples. Permission is hereby granted
// to modify, create derivative works, distribute and publish any part of this source
// code whether for commercial, private or personal use.
//
// The SCICHART® examples are distributed in the hope that they will be useful, but
// without any warranty. It is provided "AS IS" without warranty of any kind, either
// expressed or implied.
// *************************************************************************************
using System;
using System.Threading.Tasks;
using System.Windows;
using System.Windows.Controls;
using System.Windows.Media.Imaging;
using System.Windows.Threading;
using SciChart.Charting3D.Model;
using SciChart.Data.Model;
namespace SciChart.Examples.Examples.Charts3D.CreateRealtime3DCharts
{
/// <summary>
/// Interaction logic for CreateRealTime3DGeoidChart.xaml
/// </summary>
public partial class CreateRealTime3DGeoidChart : UserControl
{
private DispatcherTimer _timer;
private object _syncRoot = new object();
public CreateRealTime3DGeoidChart()
{
InitializeComponent();
this.Loaded += (s, e) =>
{
this.StartButton.IsChecked = true;
this.OnStart();
};
this.Unloaded += (s, e) =>
{
this.OnStop();
};
}
private void StartButton_Click(object sender, RoutedEventArgs e)
{
OnStart();
}
private void PauseButton_Click(object sender, RoutedEventArgs e)
{
OnStop();
}
private void DataCombo_OnSelectionChanged(object sender, EventArgs e)
{
OnStart();
}
private void OnStart()
{
if (!IsLoaded) return;
int countU, countV;
switch (DataCombo.SelectedIndex)
{
case 0:
countU = countV = 10;
break;
case 1:
countU = countV = 50;
break;
case 2:
countU = countV = 100;
break;
case 3:
countU = countV = 500;
break;
case 4:
countU = countV = 1000;
break;
default:
throw new ArgumentOutOfRangeException();
}
lock (_syncRoot)
{
OnStop();
}
BitmapImage bitmapImage = new BitmapImage();
// Load image from resources
bitmapImage.BeginInit();
bitmapImage.CacheOption = BitmapCacheOption.OnDemand;
bitmapImage.CreateOptions = BitmapCreateOptions.DelayCreation;
bitmapImage.DecodePixelWidth = countU;
bitmapImage.DecodePixelHeight = countV;
bitmapImage.UriSource = new Uri("pack://application:,,,/SciChart.Examples.ExternalDependencies;component/Resources/Images/globe_heightmap.png");
bitmapImage.EndInit();
// Creating Geo height (displacement) map
var geoHeightMap = new double[countU, countV];
int nStride = (bitmapImage.PixelWidth * bitmapImage.Format.BitsPerPixel + 7) / 8;
int bytsPerPixel = bitmapImage.Format.BitsPerPixel / 8;
byte[] pixelByteArray = new byte[bitmapImage.PixelWidth * nStride];
bitmapImage.CopyPixels(pixelByteArray, nStride, 0);
for (int v = 0; v < countV; v++)
{
for (var u = 0; u < countU; u++)
{
int pixelIndex = v * nStride + u * bytsPerPixel;
var offset = pixelByteArray[pixelIndex] / 255.0f;
geoHeightMap[v, u] = offset;
}
}
var dataSeries = new EllipsoidDataSeries3D<double>(countU, countV)
{
SeriesName = "Geo Mesh",
A = 6,
B = 6,
C = 6
};
var frontBuffer = dataSeries.InternalArray;
var backBuffer = new GridData<double>(countU, countV).InternalArray;
int frames = 0;
_timer = new DispatcherTimer();
_timer.Interval = TimeSpan.FromMilliseconds(20);
_timer.Tick += (s, arg) =>
{
lock (_syncRoot)
{
double heightOffsetsScale = sliderHeightOffsetsScale.Value;
double freq = (Math.Sin(frames++*0.1) + 1.0) / 2.0;
// Each set of geoHeightMap[i,j] schedules a redraw when the next Render event fires. Therefore, we suspend updates so that we can update the chart once
// We parallelize it by using Parallel.For for the outer loop
// Equivalent of "for (int j = 0; j < countU; j++)"
// This will result in more CPU usage, but we wish to demo the performance of the actual rendering, not the slowness of generating test data! :)
Parallel.For(0, countV, i =>
{
var buf = frontBuffer;
for (int j = 0; j < countU; j++)
{
// Rotate (offset) J index
int rj = j + frames;
if (rj >= countU)
{
rj -= countU * (rj / countU);
}
buf[i][j] = geoHeightMap[i, rj] + Math.Pow(geoHeightMap[i, rj], freq * 10.0) * heightOffsetsScale;
}
});
using (dataSeries.SuspendUpdates(false, true))
{
dataSeries.CopyFrom(frontBuffer);
var temp = backBuffer;
backBuffer = frontBuffer;
frontBuffer = temp;
}
}
};
SurfaceMesh.DataSeries = dataSeries;
_timer.Start();
StartButton.IsEnabled = false;
PauseButton.IsEnabled = true;
}
private void OnStop()
{
if (_timer != null)
{
_timer.Stop();
StartButton.IsEnabled = true;
PauseButton.IsEnabled = false;
}
}
}
}
