WPF Chart - Examples
SciChart WPF ships with hundreds of WPF Chart Examples which you can browse, play with, view the source-code and even export each WPF Chart Example to a stand-alone Visual Studio solution. All of this is possible with the new and improved SciChart WPF Examples Suite, which ships as part of the SciChart WPF SDK.
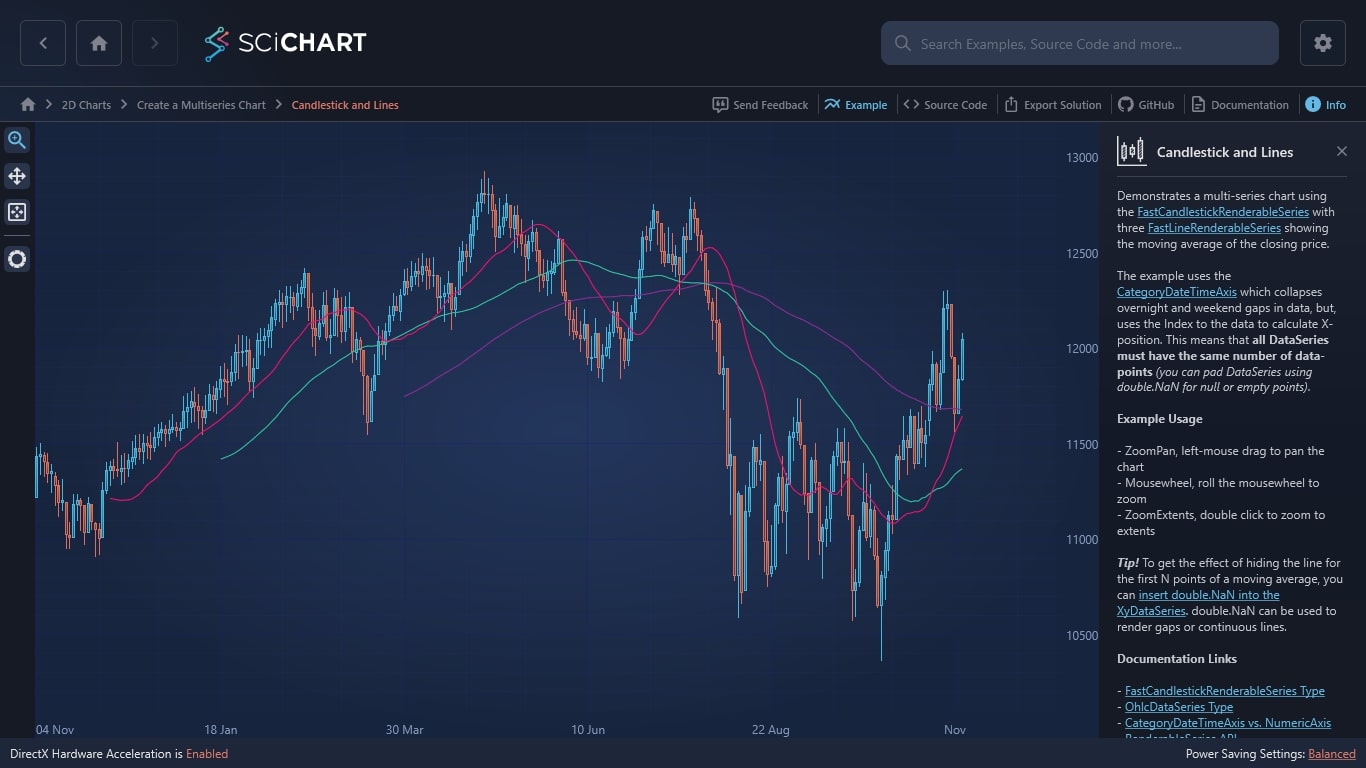
Demonstrates a multi-series chart using the FastCandlestickRenderableSeries with three FastLineRenderableSeries showing the moving average of the closing price.
The example uses the CategoryDateTimeAxis which collapses overnight and weekend gaps in data, but, uses the Index to the data to calculate X-position. This means that all DataSeries must have the same number of data-points (you can pad DataSeries using double.NaN for null or empty points).
Example Usage
– ZoomPan, left-mouse drag to pan the chart
– Mousewheel, roll the mousewheel to zoom
– ZoomExtents, double click to zoom to extents
Tip! To get the effect of hiding the line for the first N points of a moving average, you can insert double.NaN into the XyDataSeries. double.NaN can be used to render gaps or continuous lines.
Documentation Links
– FastCandlestickRenderableSeries Type
– OhlcDataSeries Type
– CategoryDateTimeAxis vs. NumericAxis
– RenderableSeries API

The C#/WPF source code for the WPF Candlestick Chart and Moving Averages example is included below (Scroll down!).
Did you know you can also view the source code from one of the following sources as well?
- Clone the SciChart.WPF.Examples from Github.
- Or, view source in the SciChart WPF Examples suite.
- Also the SciChart WPF Trial contains the full source for the examples (link below).
CandlestickWithLinesView.xaml
View source code<UserControl x:Class="SciChart.Examples.Examples.CreateMultiseriesChart.CandlestickWithLinesView"
xmlns="http://schemas.microsoft.com/winfx/2006/xaml/presentation"
xmlns:x="http://schemas.microsoft.com/winfx/2006/xaml"
xmlns:s="http://schemas.abtsoftware.co.uk/scichart"
Loaded="CandlesticksWithLines_Loaded"
xmlns:mc="http://schemas.openxmlformats.org/markup-compatibility/2006"
xmlns:d="http://schemas.microsoft.com/expression/blend/2008"
xmlns:ext="http://schemas.abtsoftware.co.uk/scichart/exampleExternals"
d:DesignHeight="400"
d:DesignWidth="600"
mc:Ignorable="d">
<Grid>
<Grid.ColumnDefinitions>
<ColumnDefinition Width="Auto" />
<ColumnDefinition Width="*" />
</Grid.ColumnDefinitions>
<!-- The SciChartInteractionToolbar adds zoom, pan, zoom extents and rotate functionality -->
<!-- to the chart and is included for example purposes. -->
<!-- If you wish to know how to zoom and pan a chart then do a search for Zoom Pan in the Examples suite! -->
<ext:SciChartInteractionToolbar TargetSurface="{Binding Source={x:Reference Name=sciChart}}" />
<s:SciChartSurface x:Name="sciChart" Padding="0" BorderThickness="0" Grid.Column="1">
<s:SciChartSurface.RenderableSeries>
<s:FastCandlestickRenderableSeries>
<s:FastCandlestickRenderableSeries.FillUp>
<LinearGradientBrush StartPoint="0,0" EndPoint="0,1">
<GradientStop Offset="0" Color="#55002200" />
<GradientStop Offset="1" Color="#FF00AA00" />
</LinearGradientBrush>
</s:FastCandlestickRenderableSeries.FillUp>
<s:FastCandlestickRenderableSeries.FillDown>
<LinearGradientBrush StartPoint="0,0" EndPoint="0,1">
<GradientStop Offset="0" Color="#55441111" />
<GradientStop Offset="1" Color="#FFFF0000" />
</LinearGradientBrush>
</s:FastCandlestickRenderableSeries.FillDown>
</s:FastCandlestickRenderableSeries>
<s:FastLineRenderableSeries Stroke="#FF1919" />
<s:FastLineRenderableSeries Stroke="#1964FF" />
<s:FastLineRenderableSeries Stroke="#FF9B27" />
</s:SciChartSurface.RenderableSeries>
<s:SciChartSurface.XAxis>
<s:CategoryDateTimeAxis GrowBy="0.0, 0.1" DrawMajorBands="True"/>
</s:SciChartSurface.XAxis>
<s:SciChartSurface.YAxis>
<s:NumericAxis GrowBy="0.1, 0.1" DrawMajorBands="True"/>
</s:SciChartSurface.YAxis>
</s:SciChartSurface>
</Grid>
</UserControl>
CandlestickWithLinesView.xaml.cs
View source code// *************************************************************************************
// SCICHART® Copyright SciChart Ltd. 2011-2022. All rights reserved.
//
// Web: http://www.scichart.com
// Support: support@scichart.com
// Sales: sales@scichart.com
//
// CandlestickWithLinesView.xaml.cs is part of the SCICHART® Examples. Permission is hereby granted
// to modify, create derivative works, distribute and publish any part of this source
// code whether for commercial, private or personal use.
//
// The SCICHART® examples are distributed in the hope that they will be useful, but
// without any warranty. It is provided "AS IS" without warranty of any kind, either
// expressed or implied.
// *************************************************************************************
using System;
using System.Windows;
using System.Windows.Controls;
using SciChart.Charting.Model.DataSeries;
using SciChart.Examples.ExternalDependencies.Common;
using SciChart.Examples.ExternalDependencies.Data;
namespace SciChart.Examples.Examples.CreateMultiseriesChart
{
public partial class CandlestickWithLinesView : UserControl
{
public CandlestickWithLinesView()
{
InitializeComponent();
}
private void CandlesticksWithLines_Loaded(object sender, RoutedEventArgs e)
{
// Create multiple DataSeries to store OHLC candlestick data, and Xy moving average data
var dataSeries0 = new OhlcDataSeries<DateTime, double>();
var dataSeries1 = new XyDataSeries<DateTime, double>();
var dataSeries2 = new XyDataSeries<DateTime, double>();
var dataSeries3 = new XyDataSeries<DateTime, double>();
// Prices are in the format Time, Open, High, Low, Close (all IList)
var prices = DataManager.Instance.GetPriceData(Instrument.Indu.Value, TimeFrame.Daily);
// Append data to series.
// First series is rendered as a Candlestick Chart so we append OHLC data
dataSeries0.Append(prices.TimeData, prices.OpenData, prices.HighData, prices.LowData, prices.CloseData);
// Subsequent series append moving average of the close prices
dataSeries1.Append(prices.TimeData, DataManager.Instance.ComputeMovingAverage(prices.CloseData, 100));
dataSeries2.Append(prices.TimeData, DataManager.Instance.ComputeMovingAverage(prices.CloseData, 50));
dataSeries3.Append(prices.TimeData, DataManager.Instance.ComputeMovingAverage(prices.CloseData, 20));
sciChart.RenderableSeries[0].DataSeries = dataSeries0;
sciChart.RenderableSeries[1].DataSeries = dataSeries1;
sciChart.RenderableSeries[2].DataSeries = dataSeries2;
sciChart.RenderableSeries[3].DataSeries = dataSeries3;
sciChart.ZoomExtents();
}
}
}
