WPF Chart - Examples
SciChart WPF ships with hundreds of WPF Chart Examples which you can browse, play with, view the source-code and even export each WPF Chart Example to a stand-alone Visual Studio solution. All of this is possible with the new and improved SciChart WPF Examples Suite, which ships as part of the SciChart WPF SDK.
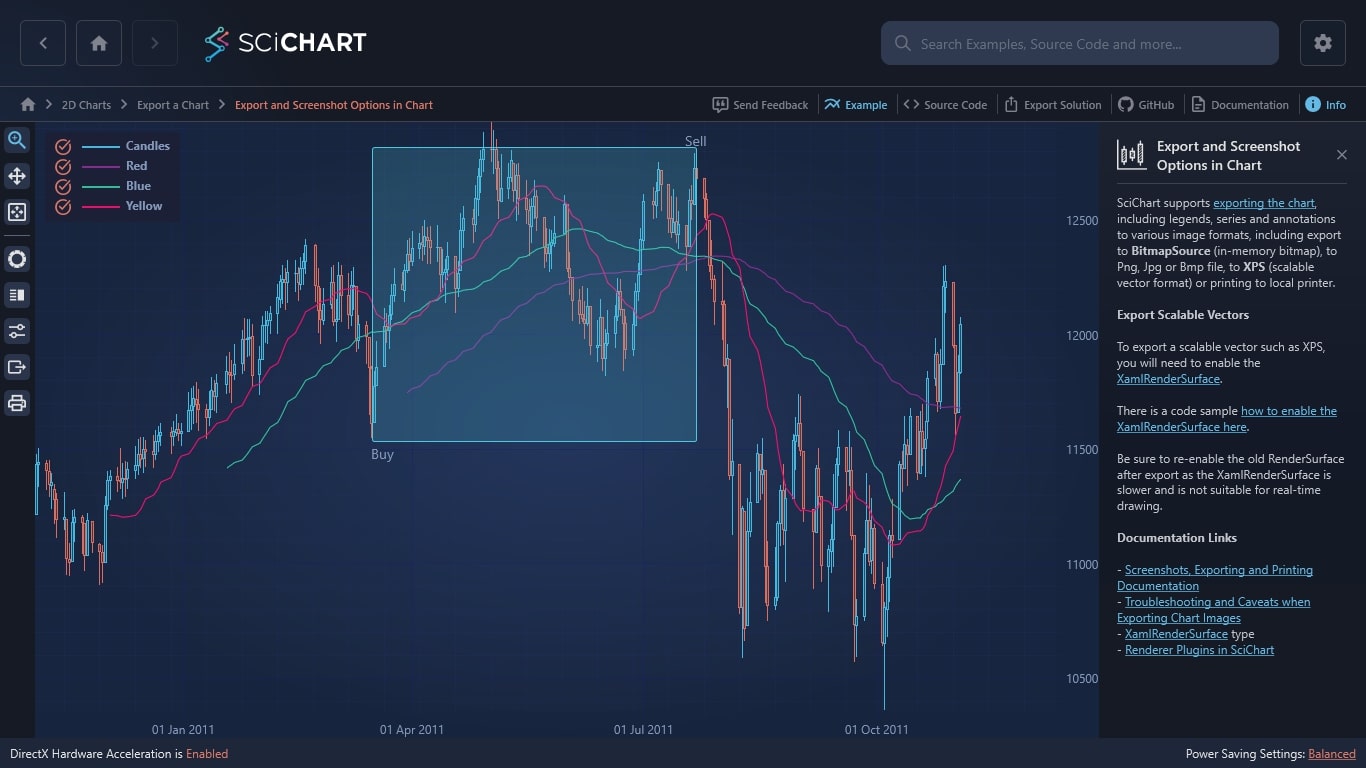
SciChart supports exporting the chart, including legends, series and annotations to various image formats, including export to BitmapSource (in-memory bitmap), to Png, Jpg or Bmp file, to XPS (scalable vector format) or printing to local printer.
Export Scalable Vectors
To export a scalable vector such as XPS, you will need to enable the XamlRenderSurface.
There is a code sample how to enable the XamlRenderSurface here.
Be sure to re-enable the old RenderSurface after export as the XamlRenderSurface is slower and is not suitable for real-time drawing.
Documentation Links
– Screenshots, Exporting and Printing Documentation
– Troubleshooting and Caveats when Exporting Chart Images
– XamlRenderSurface type
– Renderer Plugins in SciChart

The C#/WPF source code for the WPF Export and Screenshot Options in Chart example is included below (Scroll down!).
Did you know you can also view the source code from one of the following sources as well?
- Clone the SciChart.WPF.Examples from Github.
- Or, view source in the SciChart WPF Examples suite.
- Also the SciChart WPF Trial contains the full source for the examples (link below).
ExportAndScreenshotOptionsChart.xaml
View source code<UserControl x:Class="SciChart.Examples.Examples.ExportAChart.ExportAndScreenshotsChart.ExportAndScreenshotOptionsChart"
xmlns="http://schemas.microsoft.com/winfx/2006/xaml/presentation"
xmlns:x="http://schemas.microsoft.com/winfx/2006/xaml"
xmlns:d="http://schemas.microsoft.com/expression/blend/2008"
xmlns:ext="http://schemas.abtsoftware.co.uk/scichart/exampleExternals"
xmlns:mc="http://schemas.openxmlformats.org/markup-compatibility/2006"
xmlns:s="http://schemas.abtsoftware.co.uk/scichart"
d:DesignHeight="300"
d:DesignWidth="300"
mc:Ignorable="d">
<UserControl.Resources>
<ResourceDictionary>
<ResourceDictionary.MergedDictionaries>
<ResourceDictionary Source="/SciChart.Examples.ExternalDependencies;component/Resources/Styles/ToolbarButtonsCommon.xaml" />
</ResourceDictionary.MergedDictionaries>
<Style BasedOn="{StaticResource DefaultButtonStyle}" TargetType="Button">
<Setter Property="Padding" Value="0" />
<Setter Property="FontSize" Value="10" />
</Style>
<Style TargetType="CheckBox">
<Setter Property="Foreground" Value="#aaa" />
<Setter Property="Margin" Value="3" />
<Setter Property="FontSize" Value="14" />
</Style>
</ResourceDictionary>
</UserControl.Resources>
<Grid>
<Grid.ColumnDefinitions>
<ColumnDefinition Width="Auto" />
<ColumnDefinition Width="*" />
</Grid.ColumnDefinitions>
<!-- The SciChartInteractionToolbar adds zoom, pan, zoom extents and rotate functionality -->
<!-- to the chart and is included for example purposes. -->
<!-- If you wish to know how to zoom and pan a chart then do a search for Zoom Pan in the Examples suite! -->
<ext:SciChartInteractionToolbar TargetSurface="{Binding Source={x:Reference Name=sciChart}}">
<ToggleButton x:Name="useAA"
Content="Alias"
FontSize="10"
IsChecked="True"
Padding="0"
Style="{StaticResource DefaultToggleButtonStyle}" />
<ext:FlyoutSeparator />
<Button Click="ExportToXPS"
Content="XPS"
ToolTip="Export XPS" />
<Button Click="ExportToXPSBig"
Content="XPSb"
ToolTip="Export XPS Big" />
<ext:FlyoutSeparator />
<Button Click="ExportToPng"
Content="PNG"
ToolTip="Export PNG" />
<Button Click="ExportPngInMemory"
Content="PNGb"
FontSize="9"
ToolTip="Export PNG Big" />
<ext:FlyoutSeparator />
<Button Click="OnPrintClick"
Content="Print"
FontSize="10"
ToolTip="Print" />
</ext:SciChartInteractionToolbar>
<!-- This Panel need for printing -->
<Grid Grid.Column="1">
<s:SciChartSurface x:Name="sciChart">
<s:SciChartSurface.RenderableSeries>
<s:FastCandlestickRenderableSeries AntiAliasing="{Binding Source={x:Reference Name=useAA}, Path=IsChecked, Mode=TwoWay}">
<s:FastCandlestickRenderableSeries.FillUp>
<LinearGradientBrush StartPoint="0,0" EndPoint="0,1">
<GradientStop Offset="0" Color="#55002200" />
<GradientStop Offset="1" Color="#FF00AA00" />
</LinearGradientBrush>
</s:FastCandlestickRenderableSeries.FillUp>
<s:FastCandlestickRenderableSeries.FillDown>
<LinearGradientBrush StartPoint="0,0" EndPoint="0,1">
<GradientStop Offset="0" Color="#55441111" />
<GradientStop Offset="1" Color="#FFFF0000" />
</LinearGradientBrush>
</s:FastCandlestickRenderableSeries.FillDown>
</s:FastCandlestickRenderableSeries>
<s:FastLineRenderableSeries AntiAliasing="{Binding Source={x:Reference Name=useAA}, Path=IsChecked, Mode=TwoWay}" Stroke="#FF1919" />
<s:FastLineRenderableSeries AntiAliasing="{Binding Source={x:Reference Name=useAA}, Path=IsChecked, Mode=TwoWay}" Stroke="#1964FF" />
<s:FastLineRenderableSeries AntiAliasing="{Binding Source={x:Reference Name=useAA}, Path=IsChecked, Mode=TwoWay}" Stroke="#FF9B27" />
</s:SciChartSurface.RenderableSeries>
<s:SciChartSurface.XAxis>
<s:DateTimeAxis DrawMajorBands="True" GrowBy="0.0, 0.1" />
</s:SciChartSurface.XAxis>
<s:SciChartSurface.YAxis>
<s:NumericAxis />
</s:SciChartSurface.YAxis>
<s:SciChartSurface.ChartModifier>
<s:ModifierGroup>
<s:LegendModifier Margin="10" />
<s:RubberBandXyZoomModifier />
<s:ZoomExtentsModifier />
</s:ModifierGroup>
</s:SciChartSurface.ChartModifier>
<s:SciChartSurface.Annotations>
<s:TextAnnotation x:Name="buyTxtAnnot"
FontSize="14"
Text="Buy"
Y1="11533"
Y2="11533" />
<s:TextAnnotation x:Name="sellTxtAnnot"
FontSize="14"
Text="Sell"
Y1="12900"
Y2="12900" />
<s:BoxAnnotation x:Name="boxAnnotation"
Background="#55279B27"
BorderBrush="#279B27"
BorderThickness="1"
CornerRadius="2"
Y1="11537"
Y2="12819" />
</s:SciChartSurface.Annotations>
</s:SciChartSurface>
</Grid>
</Grid>
</UserControl>
ExportAndScreenshotOptionsChart.xaml.cs
View source codeusing System;
using System.IO;
using System.Linq;
using System.Windows;
using System.Windows.Controls;
using System.Windows.Media;
using System.Xml.Serialization;
using Microsoft.Win32;
using SciChart.Charting.Common.Extensions;
using SciChart.Charting.Model.DataSeries;
using SciChart.Charting.Visuals;
using SciChart.Charting.Visuals.Axes;
using SciChart.Charting.Visuals.Axes.LabelProviders;
using SciChart.Core;
using SciChart.Examples.ExternalDependencies.Common;
using SciChart.Examples.ExternalDependencies.Data;
namespace SciChart.Examples.Examples.ExportAChart.ExportAndScreenshotsChart
{
/// <summary>
/// Interaction logic for ExportAndScreenshotOptionsChart.xaml
/// </summary>
public partial class ExportAndScreenshotOptionsChart : UserControl
{
public ExportAndScreenshotOptionsChart()
{
InitializeComponent();
sciChart.Loaded += OnLoaded_SciChartSurface;
}
private void OnLoaded_SciChartSurface(object sender, RoutedEventArgs e)
{
// Create multiple DataSeries to store OHLC candlestick data, and Xy moving average data
var dataSeries0 = new OhlcDataSeries<DateTime, double>() {SeriesName = "Candles"};
var dataSeries1 = new XyDataSeries<DateTime, double>() { SeriesName = "Red" };
var dataSeries2 = new XyDataSeries<DateTime, double>() { SeriesName = "Blue" };
var dataSeries3 = new XyDataSeries<DateTime, double>() { SeriesName = "Yellow" };
// Prices are in the format Time, Open, High, Low, Close (all IList)
var prices = DataManager.Instance.GetPriceData(Instrument.Indu.Value, TimeFrame.Daily);
// Append data to series.
// First series is rendered as a Candlestick Chart so we append OHLC data
dataSeries0.Append(prices.TimeData, prices.OpenData, prices.HighData, prices.LowData, prices.CloseData);
// Subsequent series append moving average of the close prices
dataSeries1.Append(prices.TimeData, DataManager.Instance.ComputeMovingAverage(prices.CloseData, 100));
dataSeries2.Append(prices.TimeData, DataManager.Instance.ComputeMovingAverage(prices.CloseData, 50));
dataSeries3.Append(prices.TimeData, DataManager.Instance.ComputeMovingAverage(prices.CloseData, 20));
sciChart.RenderableSeries[0].DataSeries = dataSeries0;
sciChart.RenderableSeries[1].DataSeries = dataSeries1;
sciChart.RenderableSeries[2].DataSeries = dataSeries2;
sciChart.RenderableSeries[3].DataSeries = dataSeries3;
boxAnnotation.X1 = new DateTime(2011, 7, 21, 17, 2, 39);
boxAnnotation.X2 = new DateTime(2011, 3, 16, 6, 44, 18);
buyTxtAnnot.X1 = new DateTime(2011, 3, 14, 0, 24, 11);
buyTxtAnnot.X2 = buyTxtAnnot.X1;
sellTxtAnnot.X1 = new DateTime(2011, 7, 15, 21, 19, 28);
sellTxtAnnot.X2 = sellTxtAnnot.X1;
sciChart.ZoomExtents();
}
private void ExportToXPS(object sender, RoutedEventArgs e)
{
string filePath;
if(GetAndCheckPath("XPS | *.xps", out filePath))
{
sciChart.ExportToFile(filePath, ExportType.Xps, true);
}
}
private void ExportToXPSBig(object sender, RoutedEventArgs e)
{
string filePath;
if(GetAndCheckPath("XPS | *.xps", out filePath))
{
sciChart.ExportToFile(filePath, ExportType.Xps, true, new Size(2000, 2000));
}
}
private void ExportToPng(object sender, RoutedEventArgs e)
{
string filePath;
if(GetAndCheckPath("PNG | *.png", out filePath))
{
sciChart.ExportToFile(filePath, ExportType.Png, false);
}
}
private void ExportPngInMemory(object sender, RoutedEventArgs e)
{
string filePath;
if(GetAndCheckPath("PNG | *.png", out filePath))
{
sciChart.ExportToFile(filePath, ExportType.Png, false, new Size(2000, 1500));
}
}
public SaveFileDialog CreateFileDialog(string filter)
{
var saveFileDialog = new SaveFileDialog
{
Filter = filter,
InitialDirectory = Environment.GetFolderPath(Environment.SpecialFolder.Desktop)
};
return saveFileDialog;
}
private void OnPrintClick(object sender, RoutedEventArgs e)
{
sciChart.Print();
}
private bool GetAndCheckPath(string filter, out string path)
{
var ret = false;
var isGoodPath = false;
var saveFileDialog = CreateFileDialog(filter);
path = null;
while (!isGoodPath)
{
if (saveFileDialog.ShowDialog() == true)
{
if (IsFileGoodForWriting(saveFileDialog.FileName))
{
path = saveFileDialog.FileName;
isGoodPath = true;
ret = true;
}
else
{
MessageBox.Show(
"File is inaccesible for writing or you can not create file in this location, please choose another one.");
}
}
else
{
isGoodPath = true;
}
}
return ret;
}
/// <summary>
/// Check if file is Good for writing
/// </summary>
/// <param name="filePath">File path</param>
/// <returns></returns>
public static bool IsFileGoodForWriting(string filePath)
{
FileStream stream = null;
FileInfo file = new FileInfo(filePath);
try
{
stream = file.Open(FileMode.OpenOrCreate, FileAccess.Read, FileShare.None);
}
catch (Exception)
{
//the file is unavailable because it is:
//still being written to
//or being processed by another thread
//or does not exist (has already been processed)
return false;
}
finally
{
if (stream != null)
stream.Close();
}
//file is not locked
return true;
}
}
}
