WPF Chart - Examples
SciChart WPF ships with hundreds of WPF Chart Examples which you can browse, play with, view the source-code and even export each WPF Chart Example to a stand-alone Visual Studio solution. All of this is possible with the new and improved SciChart WPF Examples Suite, which ships as part of the SciChart WPF SDK.
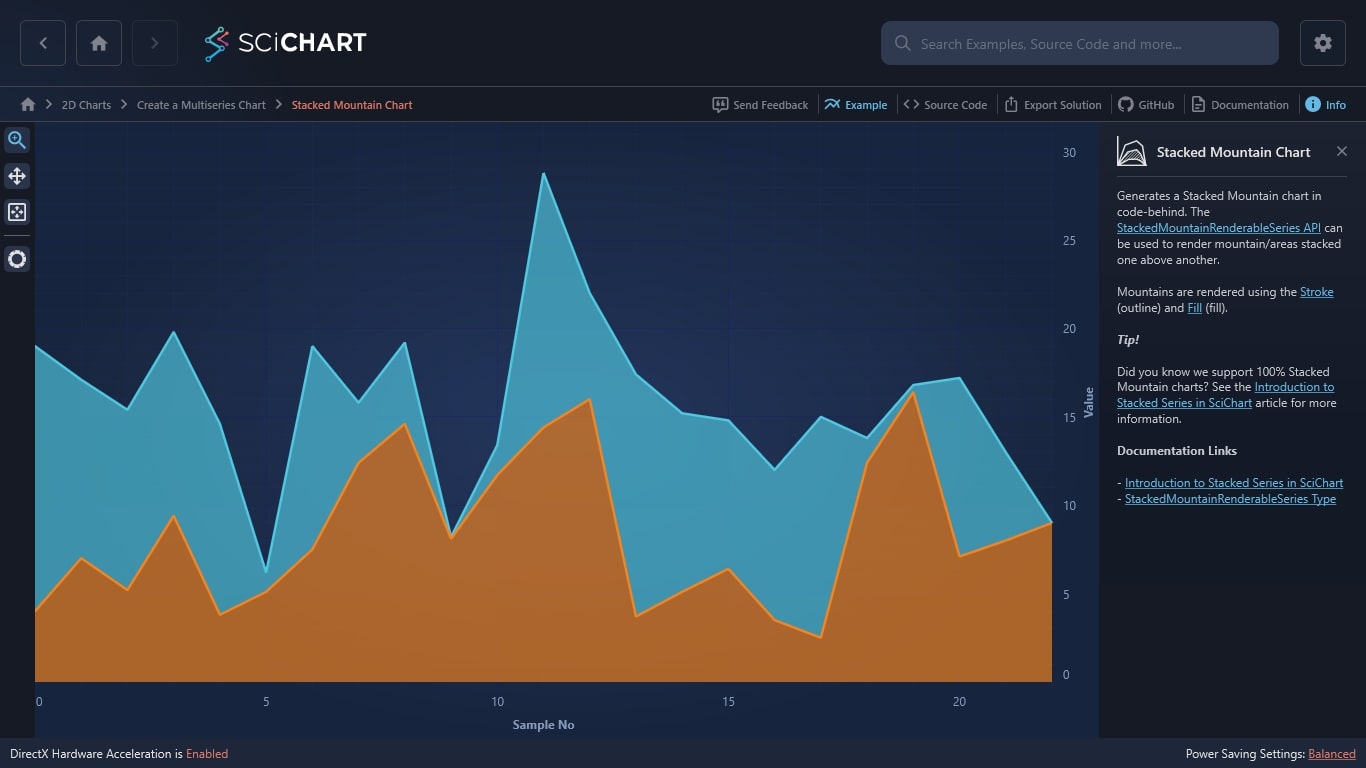
Our WPF Chart Library can generate a Stacked Mountain chart in code-behind. The StackedMountainRenderableSeries API can be used to render mountain/areas stacked one above another.
Mountains are rendered using the Stroke (outline) and Fill (fill).
Tip!
Did you know we support 100% Stacked Mountain charts? See the Introduction to Stacked Series in SciChart article for more information.
Documentation Links
– Introduction to Stacked Series in SciChart
– StackedMountainRenderableSeries Type

The C#/WPF source code for the WPF Stacked Mountain Chart example is included below (Scroll down!).
Did you know you can also view the source code from one of the following sources as well?
- Clone the SciChart.WPF.Examples from Github.
- Or, view source in the SciChart WPF Examples suite.
- Also the SciChart WPF Trial contains the full source for the examples (link below).
StackedMountainChartExampleView.xaml
View source code<UserControl x:Class="SciChart.Examples.Examples.CreateMultiseriesChart.StackedMountainChartExampleView"
xmlns="http://schemas.microsoft.com/winfx/2006/xaml/presentation"
xmlns:x="http://schemas.microsoft.com/winfx/2006/xaml"
xmlns:s="http://schemas.abtsoftware.co.uk/scichart"
xmlns:ex="http://schemas.abtsoftware.co.uk/scichart/exampleExternals"
xmlns:mc="http://schemas.openxmlformats.org/markup-compatibility/2006"
xmlns:d="http://schemas.microsoft.com/expression/blend/2008"
d:DesignHeight="400"
d:DesignWidth="600"
mc:Ignorable="d">
<UserControl.Resources>
<LinearGradientBrush x:Key="chartFill1" StartPoint="0,0" EndPoint="0,1">
<GradientStop Offset="0" Color="#DDDBE0E1" />
<GradientStop Offset="1.0" Color="#88B6C1C3" />
</LinearGradientBrush>
<LinearGradientBrush x:Key="chartFill0" StartPoint="0,0" EndPoint="0,1">
<GradientStop Offset="0" Color="#DDACBCCA" />
<GradientStop Offset="1.0" Color="#88439AAF" />
</LinearGradientBrush>
</UserControl.Resources>
<Grid>
<Grid.ColumnDefinitions>
<ColumnDefinition Width="Auto" />
<ColumnDefinition Width="*" />
</Grid.ColumnDefinitions>
<ex:SciChartInteractionToolbar TargetSurface="{Binding Source={x:Reference Name=sciChart}}" />
<!-- Create the chart surface -->
<s:SciChartSurface Name="sciChart" Grid.Column="1" Padding="0" BorderThickness="0">
<!-- Declare RenderableSeries -->
<s:SciChartSurface.RenderableSeries>
<s:StackedMountainRenderableSeries x:Name="mountainSeries1"
Fill="{StaticResource chartFill0}"
Stroke="#EEE"
StrokeThickness="2">
<s:StackedMountainRenderableSeries.SeriesAnimation>
<s:FadeAnimation AnimationDelay="0:0:1" Duration="0:0:3"/>
</s:StackedMountainRenderableSeries.SeriesAnimation>
</s:StackedMountainRenderableSeries>
<s:StackedMountainRenderableSeries x:Name="mountainSeries2"
Fill="{StaticResource chartFill1}"
Stroke="#EEE"
StrokeThickness="2">
<s:StackedMountainRenderableSeries.SeriesAnimation>
<s:FadeAnimation AnimationDelay="0:0:1" Duration="0:0:3"/>
</s:StackedMountainRenderableSeries.SeriesAnimation>
</s:StackedMountainRenderableSeries>
</s:SciChartSurface.RenderableSeries>
<!-- Create an X Axis -->
<s:SciChartSurface.XAxis>
<s:NumericAxis AxisTitle="Sample No" TextFormatting="0.########" DrawMajorBands="True"/>
</s:SciChartSurface.XAxis>
<!-- Create a Y Axis with GrowBy -->
<s:SciChartSurface.YAxis>
<s:NumericAxis AxisTitle="Value"
DrawMajorBands="True"
GrowBy="0,0.1" />
</s:SciChartSurface.YAxis>
<s:SciChartSurface.ChartModifier>
<s:ModifierGroup>
<s:XAxisDragModifier ClipModeX="None" />
<s:YAxisDragModifier />
<s:ZoomExtentsModifier />
</s:ModifierGroup>
</s:SciChartSurface.ChartModifier>
</s:SciChartSurface>
</Grid>
</UserControl>StackedMountainChartExampleView.xaml.cs
View source code// *************************************************************************************
// SCICHART® Copyright SciChart Ltd. 2011-2022. All rights reserved.
//
// Web: http://www.scichart.com
// Support: support@scichart.com
// Sales: sales@scichart.com
//
// StackedMountainChartExampleView.xaml.cs is part of the SCICHART® Examples. Permission is hereby granted
// to modify, create derivative works, distribute and publish any part of this source
// code whether for commercial, private or personal use.
//
// The SCICHART® examples are distributed in the hope that they will be useful, but
// without any warranty. It is provided "AS IS" without warranty of any kind, either
// expressed or implied.
// *************************************************************************************
using System.Windows.Controls;
using SciChart.Charting.Model.DataSeries;
namespace SciChart.Examples.Examples.CreateMultiseriesChart
{
/// <summary>
/// Interaction logic for StackedMountainChartExampleView.xaml
/// </summary>
public partial class StackedMountainChartExampleView : UserControl
{
public StackedMountainChartExampleView()
{
InitializeComponent();
var yValues1 = new[] { 4.0, 7, 5.2, 9.4, 3.8, 5.1, 7.5, 12.4, 14.6, 8.1, 11.7, 14.4, 16.0, 3.7, 5.1, 6.4, 3.5, 2.5, 12.4, 16.4, 7.1, 8.0, 9.0 };
var yValues2 = new[] { 15.0, 10.1, 10.2, 10.4, 10.8, 1.1, 11.5, 3.4, 4.6, 0.1, 1.7, 14.4, 6.0, 13.7, 10.1, 8.4, 8.5, 12.5, 1.4, 0.4, 10.1, 5.0, 0.0 };
var dataSeries1 = new XyDataSeries<double, double>() { SeriesName = "data1" };
var dataSeries2 = new XyDataSeries<double, double>() { SeriesName = "data2" }; ;
for (int i = 0; i < yValues1.Length; i++) dataSeries1.Append(i, yValues1[i]);
for (int i = 0; i < yValues2.Length; i++) dataSeries2.Append(i, yValues2[i]);
using (this.sciChart.SuspendUpdates())
{
this.mountainSeries1.DataSeries = dataSeries1;
this.mountainSeries2.DataSeries = dataSeries2;
}
}
}
}