WPF Chart - Examples
SciChart WPF ships with hundreds of WPF Chart Examples which you can browse, play with, view the source-code and even export each WPF Chart Example to a stand-alone Visual Studio solution. All of this is possible with the new and improved SciChart WPF Examples Suite, which ships as part of the SciChart WPF SDK.
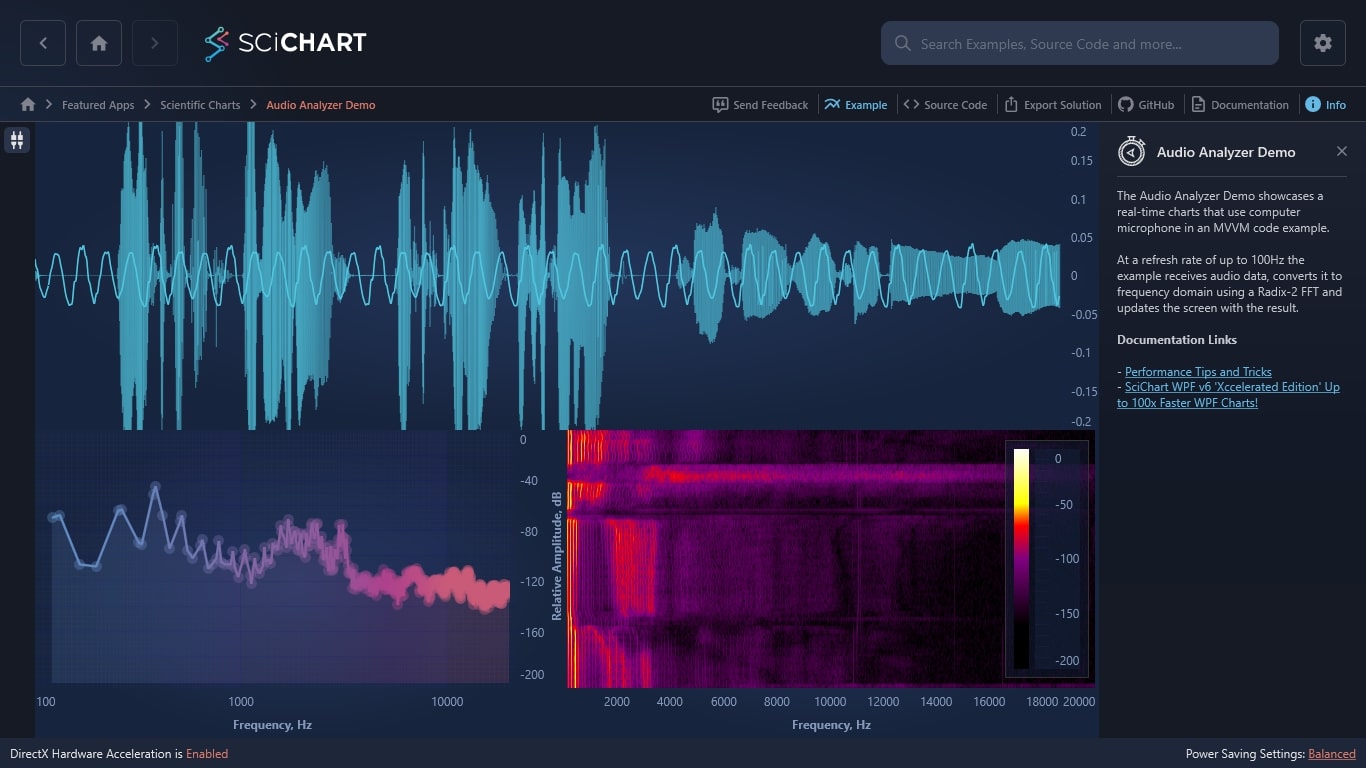
The Audio Analyzer demo showcases realtime charts that use computer microphone in an MVVM code example.
At a refresh rate of up to 100 Hz the example receives audio data and creates a waveform of the sounds, that you can see in the top chart.
The example next converts the audio data to a frequency domain using a Radix-2FFT and updates the screen with the result. There is a Fourier transform done with the help of the column chart on the lower left side and the spectrogram, created with heatmap on the right.
This showcases how SciChart can be used for spectral analysis, visualizing scientific data from data-acquisition devices, audio spectra, or radio frequency.

The C#/WPF source code for the WPF Audio Analyzer example is included below (Scroll down!).
Did you know you can also view the source code from one of the following sources as well?
- Clone the SciChart.WPF.Examples from Github.
- Or, view source in the SciChart WPF Examples suite.
- Also the SciChart WPF Trial contains the full source for the examples (link below).
AudioAnalyzerView.xaml
View source code<UserControl x:Class="SciChart.Examples.Examples.SeeFeaturedApplication.AudioAnalyzer.AudioAnalyzerView"
xmlns="http://schemas.microsoft.com/winfx/2006/xaml/presentation"
xmlns:x="http://schemas.microsoft.com/winfx/2006/xaml"
xmlns:mc="http://schemas.openxmlformats.org/markup-compatibility/2006"
xmlns:d="http://schemas.microsoft.com/expression/blend/2008"
xmlns:ext="http://schemas.abtsoftware.co.uk/scichart/exampleExternals"
xmlns:i="http://schemas.microsoft.com/xaml/behaviors"
xmlns:s="http://schemas.abtsoftware.co.uk/scichart"
xmlns:local="clr-namespace:SciChart.Examples.Examples.SeeFeaturedApplication.AudioAnalyzer"
mc:Ignorable="d"
d:DataContext="{d:DesignInstance Type=local:AudioAnalyzerViewModel, IsDesignTimeCreatable=False}"
d:DesignHeight="450" d:DesignWidth="800">
<UserControl.Resources>
<ResourceDictionary>
<ResourceDictionary.MergedDictionaries>
<ResourceDictionary Source="/SciChart.Examples.ExternalDependencies;component/Resources/Styles/ToolbarButtonsCommon.xaml" />
</ResourceDictionary.MergedDictionaries>
<s:GradientStopsToLinearGradientBrushConverter x:Key="ColorsToLineatGradientBrushConverter"/>
<Style x:Key="AxisStyle" TargetType="s:AxisBase">
<Setter Property="DrawMajorBands" Value="False" />
<Setter Property="IsPrimaryAxis" Value="False" />
<Setter Property="AxisBandsFill" Value="Transparent" />
<Setter Property="DrawMajorGridLines" Value="false" />
<Setter Property="DrawMinorGridLines" Value="false" />
<Setter Property="MajorTickLineStyle">
<Setter.Value>
<Style TargetType="Line">
<Setter Property="Stroke" Value="Transparent" />
</Style>
</Setter.Value>
</Setter>
<Setter Property="MinorTickLineStyle">
<Setter.Value>
<Style TargetType="Line">
<Setter Property="Stroke" Value="Transparent" />
</Style>
</Setter.Value>
</Setter>
</Style>
</ResourceDictionary>
</UserControl.Resources>
<i:Interaction.Triggers>
<i:EventTrigger EventName="Loaded">
<i:InvokeCommandAction Command="{Binding StartCommand}" />
</i:EventTrigger>
<i:EventTrigger EventName="Unloaded">
<i:InvokeCommandAction Command="{Binding StopCommand}" />
</i:EventTrigger>
</i:Interaction.Triggers>
<Grid>
<Grid.ColumnDefinitions>
<ColumnDefinition Width="Auto" />
<ColumnDefinition Width="*" />
</Grid.ColumnDefinitions>
<local:AudioAnalyzerInteractionToolbar x:Name="UserToolbar" TargetSurface="{Binding Source={x:Reference Name=sciChartFreq}}">
<ext:FlyoutMenuButton Content="INP"
Padding="0"
Style="{StaticResource FlyoutMenuButtonStyle}">
<ext:FlyoutMenuButton.PopupContent>
<StackPanel MinWidth="150"
Margin="0,0,0,4"
Orientation="Vertical">
<TextBlock Text="Audio input device"/>
<ext:FlyoutSeparator />
<ComboBox Margin="4"
SelectedValue="{Binding SelectedDeviceId}"
ItemsSource="{Binding AvailableDevices}"
DisplayMemberPath="DisplayName"
SelectedValuePath="ID">
</ComboBox>
</StackPanel>
</ext:FlyoutMenuButton.PopupContent>
</ext:FlyoutMenuButton>
</local:AudioAnalyzerInteractionToolbar>
<Grid Grid.Column="1">
<Grid.RowDefinitions>
<RowDefinition/>
<RowDefinition/>
</Grid.RowDefinitions>
<Grid.ColumnDefinitions>
<ColumnDefinition Width="*" />
<ColumnDefinition Width="*" />
<ColumnDefinition Width="90" />
</Grid.ColumnDefinitions>
<!-- Create the chart surface -->
<s:SciChartSurface Grid.Row="0" Grid.ColumnSpan="3">
<s:SciChartSurface.ViewportManager>
<local:YPeakViewportManager/>
</s:SciChartSurface.ViewportManager>
<!-- Declare RenderableSeries -->
<s:SciChartSurface.RenderableSeries>
<s:FastLineRenderableSeries DataSeries="{Binding DataSeries}"
Stroke="#FF99EE99"
StrokeThickness="2">
</s:FastLineRenderableSeries>
</s:SciChartSurface.RenderableSeries>
<!-- Create an X Axis -->
<s:SciChartSurface.XAxis>
<s:NumericAxis AutoRange="Always" Visibility="Collapsed" DrawMajorGridLines="False" DrawMinorGridLines="False" DrawMajorBands="False"/>
</s:SciChartSurface.XAxis>
<!-- Create a Y Axis -->
<s:SciChartSurface.YAxis>
<s:NumericAxis AutoRange="Always" DrawMajorGridLines="False" DrawMinorGridLines="False" DrawMajorBands="False"/>
</s:SciChartSurface.YAxis>
</s:SciChartSurface>
<s:SciChartSurface Grid.Row="1" Grid.Column="0" x:Name="sciChartFreq">
<s:SciChartSurface.ViewportManager>
<local:YPeakViewportManager/>
</s:SciChartSurface.ViewportManager>
<!-- Declare RenderableSeries -->
<s:SciChartSurface.RenderableSeries>
<s:FastMountainRenderableSeries DataSeries="{Binding FrequencyDataSeries}"
AntiAliasing="True"
Stroke="Transparent"
ZeroLineY="-1000">
<s:FastMountainRenderableSeries.PaletteProvider>
<local:AudioAnalyzerPaletteProvider>
<local:AudioAnalyzerPaletteProvider.Palette>
<s:HeatmapColorPalette Minimum="-250" Maximum="0">
<s:HeatmapColorPalette.GradientStops>
<GradientStop Offset="0" Color="DarkBlue" />
<GradientStop Offset="0.3" Color="CornflowerBlue" />
<GradientStop Offset="0.5" Color="DarkGreen" />
<GradientStop Offset="0.6" Color="Chartreuse" />
<GradientStop Offset="0.75" Color="Yellow" />
<GradientStop Offset="0.95" Color="Red" />
</s:HeatmapColorPalette.GradientStops>
</s:HeatmapColorPalette>
</local:AudioAnalyzerPaletteProvider.Palette>
</local:AudioAnalyzerPaletteProvider>
</s:FastMountainRenderableSeries.PaletteProvider>
</s:FastMountainRenderableSeries>
</s:SciChartSurface.RenderableSeries>
<!-- Create an X Axis -->
<s:SciChartSurface.XAxis>
<s:NumericAxis AutoRange="Always" AxisTitle="Frequency, Hz"/>
</s:SciChartSurface.XAxis>
<!-- Create a Y Axis -->
<s:SciChartSurface.YAxis>
<s:NumericAxis AutoRange="Always" AxisTitle="Relative Amplitude, dB"/>
</s:SciChartSurface.YAxis>
</s:SciChartSurface>
<s:HeatmapColorMap Grid.Row="1" Grid.Column="2"
Margin="0 0 0 48"
BorderBrush="#777"
BorderThickness="1"
VerticalAlignment="Stretch"
HorizontalAlignment="Stretch"
Orientation="Vertical"
TextFormatting="0.00"
Background="{Binding Source={x:Reference Name=sciChartHeatMap}, Path=Background}"
Foreground="{Binding Source={x:Reference Name=sciChartHeatMap}, Path=Foreground}"
Maximum="{Binding Source={x:Reference Name=HeatmapRenderableSeries}, Path=ColorMap.Maximum}"
Minimum="{Binding Source={x:Reference Name=HeatmapRenderableSeries}, Path=ColorMap.Minimum}"
ColorMap="{Binding Source={x:Reference Name=HeatmapRenderableSeries}, Path=ColorMap.GradientStops, Converter={StaticResource ColorsToLineatGradientBrushConverter}}">
</s:HeatmapColorMap>
<s:SciChartSurface x:Name="sciChartHeatMap"
Grid.Row="1"
Grid.Column="1"
VerticalAlignment="Stretch"
HorizontalAlignment="Stretch">
<s:SciChartSurface.RenderableSeries>
<s:FastUniformHeatmapRenderableSeries x:Name="HeatmapRenderableSeries" DataSeries="{Binding UniformHeatmapDataSeries}">
<s:FastUniformHeatmapRenderableSeries.ColorMap>
<s:HeatmapColorPalette Minimum="-200" Maximum="0">
<s:HeatmapColorPalette.GradientStops>
<GradientStop Offset="0" Color="Transparent" />
<GradientStop Offset="0.0001" Color="DarkBlue" />
<GradientStop Offset="0.2" Color="CornflowerBlue" />
<GradientStop Offset="0.45" Color="DarkGreen" />
<GradientStop Offset="0.5" Color="Chartreuse" />
<GradientStop Offset="0.7" Color="Yellow" />
<GradientStop Offset="0.9" Color="Red" />
</s:HeatmapColorPalette.GradientStops>
</s:HeatmapColorPalette>
</s:FastUniformHeatmapRenderableSeries.ColorMap>
</s:FastUniformHeatmapRenderableSeries>
</s:SciChartSurface.RenderableSeries>
<s:SciChartSurface.XAxis>
<s:NumericAxis Style="{StaticResource AxisStyle}" VisibleRange="{Binding Source={x:Reference Name=sciChartFreq}, Path=XAxis.VisibleRange, Mode=TwoWay}"
AxisTitle="{Binding Source={x:Reference Name=sciChartFreq}, Path=XAxis.AxisTitle, Mode=OneWay}" />
</s:SciChartSurface.XAxis>
<s:SciChartSurface.YAxis>
<s:NumericAxis Style="{StaticResource AxisStyle}" Visibility="Hidden" FlipCoordinates="True" />
</s:SciChartSurface.YAxis>
</s:SciChartSurface>
</Grid>
</Grid>
</UserControl>
AudioAnalyzerView.xaml.cs
View source code// *************************************************************************************
// SCICHART® Copyright SciChart Ltd. 2011-2022. All rights reserved.
//
// Web: http://www.scichart.com
// Support: support@scichart.com
// Sales: sales@scichart.com
//
// AudioAnalyzerView.xaml.cs is part of the SCICHART® Examples. Permission is hereby granted
// to modify, create derivative works, distribute and publish any part of this source
// code whether for commercial, private or personal use.
//
// The SCICHART® examples are distributed in the hope that they will be useful, but
// without any warranty. It is provided "AS IS" without warranty of any kind, either
// expressed or implied.
// *************************************************************************************
using System.Windows.Controls;
namespace SciChart.Examples.Examples.SeeFeaturedApplication.AudioAnalyzer
{
/// <summary>
/// Interaction logic for AudioAnalyzerView.xaml
/// </summary>
public partial class AudioAnalyzerView : UserControl
{
public AudioAnalyzerView()
{
InitializeComponent();
}
}
}
AudioDataAnalyzer.cs
View source code// *************************************************************************************
// SCICHART® Copyright SciChart Ltd. 2011-2022. All rights reserved.
//
// Web: http://www.scichart.com
// Support: support@scichart.com
// Sales: sales@scichart.com
//
// AudioDataAnalyzer.cs is part of the SCICHART® Examples. Permission is hereby granted
// to modify, create derivative works, distribute and publish any part of this source
// code whether for commercial, private or personal use.
//
// The SCICHART® examples are distributed in the hope that they will be useful, but
// without any warranty. It is provided "AS IS" without warranty of any kind, either
// expressed or implied.
// *************************************************************************************
using NAudio.Dsp;
using System;
namespace SciChart.Examples.Examples.SeeFeaturedApplication.AudioAnalyzer
{
class AudioDataAnalyzer
{
private readonly AudioDeviceHandler _handler;
private int _fftWindowSize;
private int _log2;
private Complex[] _fftInput;
public double[] DbValues { get; }
public double[,] SpectrogramBuffer { get; }
public const int SpectrogramFrameCount = 200;
public int FftDataPoints { get; }
public int FftFrequencySpacing { get; }
//These are used to improve Append() perf
public int[] PrimaryIndices { get; }
public int[] FftIndices { get; }
public double[] Samples => _handler.Samples;
public event EventHandler Update;
public AudioDataAnalyzer(AudioDeviceHandler handler)
{
_handler = handler;
// On Windows, sample rate could be pretty much anything and FFT requires power-of-2 window size
// So we need to pick sufficient window size based on sample rate
var sampleRate = (double)_handler.SamplesPerSecond;
const double minLen = 0.05; // seconds
var fftWindowSize = 512;
_log2 = 9;
while (fftWindowSize / sampleRate < minLen)
{
fftWindowSize *= 2;
_log2 += 1;
}
_fftWindowSize = fftWindowSize;
_fftInput = new Complex[_fftWindowSize];
FftDataPoints = fftWindowSize / 2;
FftFrequencySpacing = _handler.SamplesPerSecond / fftWindowSize;
FftIndices = new int[FftDataPoints];
for (int i = 0; i < FftIndices.Length; i++)
{
FftIndices[i] = i * FftFrequencySpacing;
}
SpectrogramBuffer = new double[SpectrogramFrameCount, FftDataPoints];
for (int x = 0; x < SpectrogramFrameCount; x++)
{
for (int y = 0; y < FftDataPoints; y++)
{
SpectrogramBuffer[x, y] = double.MinValue;
}
}
DbValues = new double[FftDataPoints];
PrimaryIndices = new int[handler.BufferSize];
for (int i = 0; i < PrimaryIndices.Length; i++)
{
PrimaryIndices[i] = i;
}
handler.DataReceived += DataReceived;
}
private void DataReceived(object sender, EventArgs e)
{
ProcessData(_handler.Samples);
}
private void ProcessData(double[] input)
{
var offset = input.Length - _fftWindowSize;
for (int i = 0; i < _fftWindowSize; i++)
{
Complex c = new Complex();
c.X = (float)(input[offset + i] * FastFourierTransform.BlackmannHarrisWindow(i, _fftWindowSize));
c.Y = 0;
_fftInput[i] = c;
}
FastFourierTransform.FFT(true, _log2, _fftInput);
ComputeDbValues(_fftInput, DbValues);
Array.Copy(SpectrogramBuffer, FftDataPoints, SpectrogramBuffer, 0, (SpectrogramFrameCount - 1) * FftDataPoints);
for (var i = 0; i < FftDataPoints; i++)
{
SpectrogramBuffer[SpectrogramFrameCount - 1, i] = DbValues[i];
}
Update?.Invoke(this, EventArgs.Empty);
}
private void ComputeDbValues(Complex[] compl, double[] tgt)
{
for (int i = 0; i < FftDataPoints; i++)
{
var c = compl[i];
double mag = Math.Sqrt(c.X * c.X + c.Y * c.Y);
var db = 20 * Math.Log10(mag);
tgt[i] = db;
}
}
}
}
AudioDeviceSource.cs
View source code// *************************************************************************************
// SCICHART® Copyright SciChart Ltd. 2011-2022. All rights reserved.
//
// Web: http://www.scichart.com
// Support: support@scichart.com
// Sales: sales@scichart.com
//
// AudioDeviceSource.cs is part of the SCICHART® Examples. Permission is hereby granted
// to modify, create derivative works, distribute and publish any part of this source
// code whether for commercial, private or personal use.
//
// The SCICHART® examples are distributed in the hope that they will be useful, but
// without any warranty. It is provided "AS IS" without warranty of any kind, either
// expressed or implied.
// *************************************************************************************
using NAudio.CoreAudioApi;
using NAudio.CoreAudioApi.Interfaces;
using System;
using System.Collections.Generic;
using System.Collections.ObjectModel;
using System.Linq;
using System.Windows.Threading;
namespace SciChart.Examples.Examples.SeeFeaturedApplication.AudioAnalyzer
{
class AudioDeviceSource : IDisposable, IMMNotificationClient
{
private MMDeviceEnumerator _enumerator = new MMDeviceEnumerator();
private Dispatcher _dispatcher;
public ObservableCollection<AudioDeviceInfo> Devices { get; } = new ObservableCollection<AudioDeviceInfo>();
public event EventHandler DevicesChanged;
public string DefaultDevice { get; private set; }
public AudioDeviceSource()
{
_dispatcher = Dispatcher.CurrentDispatcher;
_enumerator.RegisterEndpointNotificationCallback(this);
RefreshDevices();
}
public AudioDeviceHandler CreateHandlder(string id)
{
var device = _enumerator.GetDevice(id);
return new AudioDeviceHandler(device);
}
private void RefreshDevices()
{
if (!_dispatcher.CheckAccess())
{
_dispatcher.BeginInvoke((Action)RefreshDevices);
return;
}
DefaultDevice = GetDefaultDevice();
var deviceMap = Devices.ToDictionary(d => d.ID, d => d);
var presentDevices = new HashSet<string>();
foreach (var d in _enumerator.EnumerateAudioEndPoints(DataFlow.Capture, DeviceState.Active))
{
presentDevices.Add(d.ID);
if(deviceMap.TryGetValue(d.ID, out var device))
{
device.Update(d);
}
else
{
Devices.Add(new AudioDeviceInfo(d));
}
d.Dispose();
}
for (int i = Devices.Count - 1; i >=0; i--)
{
if (!presentDevices.Contains(Devices[i].ID))
{
Devices.RemoveAt(i);
}
}
DevicesChanged?.Invoke(this, EventArgs.Empty);
}
private string GetDefaultDevice()
{
if(!_enumerator.HasDefaultAudioEndpoint(DataFlow.Capture, Role.Communications))
{
return null;
}
using (var device = _enumerator.GetDefaultAudioEndpoint(DataFlow.Capture, Role.Communications))
{
return device.ID;
}
}
public void Dispose()
{
_enumerator.UnregisterEndpointNotificationCallback(this);
_enumerator.Dispose();
}
public void OnDeviceStateChanged(string deviceId, DeviceState newState)
{
RefreshDevices();
}
public void OnDeviceAdded(string pwstrDeviceId)
{
RefreshDevices();
}
public void OnDeviceRemoved(string deviceId)
{
RefreshDevices();
}
public void OnDefaultDeviceChanged(DataFlow flow, Role role, string defaultDeviceId)
{
RefreshDevices();
}
public void OnPropertyValueChanged(string pwstrDeviceId, PropertyKey key)
{
RefreshDevices();
}
}
}
