WPF Chart - Examples
SciChart WPF ships with hundreds of WPF Chart Examples which you can browse, play with, view the source-code and even export each WPF Chart Example to a stand-alone Visual Studio solution. All of this is possible with the new and improved SciChart WPF Examples Suite, which ships as part of the SciChart WPF SDK.
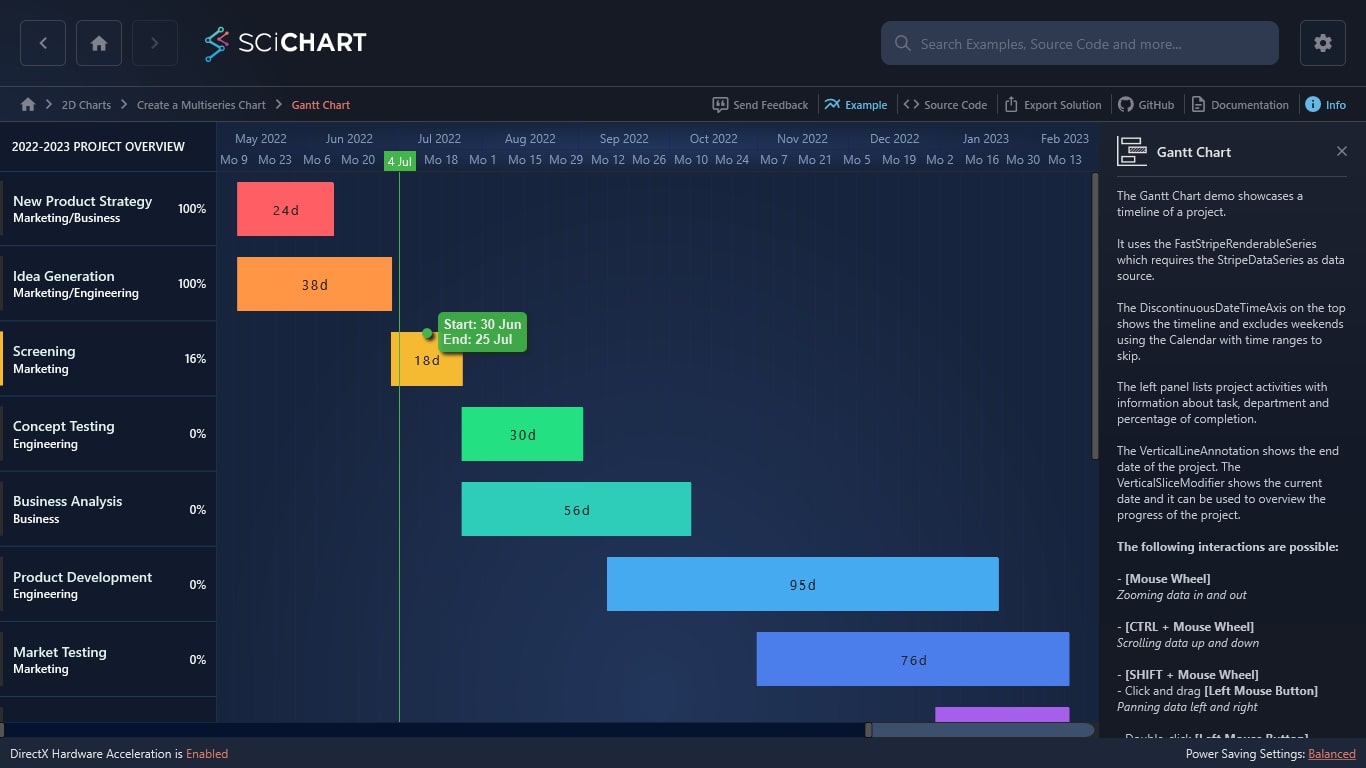
Demonstrates how to use FastStripeRenderableSeries FastStripeRenderableSeries to compose a Gantt Chart.
The FastStripeRenderableSeries requires an StripeDataSeries.
The DiscontinuousDateTimeAxis on the top shows the timeline and excludes weekends using the Calendar with time ranges to skip.
The left panel lists project activities with information about task, department and percentage of completion.
The VerticalLineAnnotation shows the end date of the project. The VerticalSliceModifier shows the current date and it can be used to overview the progress of the project.
Documentation Links
– FastStripeRenderableSeries Type
– StripeDataSeries Type
– RenderableSeries API

The C#/WPF source code for the WPF Gantt Chart example is included below (Scroll down!).
Did you know you can also view the source code from one of the following sources as well?
- Clone the SciChart.WPF.Examples from Github.
- Or, view source in the SciChart WPF Examples suite.
- Also the SciChart WPF Trial contains the full source for the examples (link below).
GanttChartView.xaml
View source code<UserControl x:Class="SciChart.Examples.Examples.CreateMultiseriesChart.GanttChart.GanttChartView"
xmlns="http://schemas.microsoft.com/winfx/2006/xaml/presentation"
xmlns:b="http://schemas.microsoft.com/xaml/behaviors"
xmlns:x="http://schemas.microsoft.com/winfx/2006/xaml"
xmlns:s="http://schemas.abtsoftware.co.uk/scichart"
xmlns:local="clr-namespace:SciChart.Examples.Examples.CreateMultiseriesChart.GanttChart">
<UserControl.Resources>
<ResourceDictionary Source="GanttChartResources.xaml"/>
</UserControl.Resources>
<Grid Margin="-2,0,0,0" Background="#1C1C1E">
<Grid.RowDefinitions>
<RowDefinition Height="50"/>
<RowDefinition Height="*"/>
<RowDefinition Height="Auto"/>
</Grid.RowDefinitions>
<Grid.ColumnDefinitions>
<ColumnDefinition Width="2*"/>
<ColumnDefinition Width="8*"/>
</Grid.ColumnDefinitions>
<Border Grid.Row="0"
Grid.Column="0"
BorderThickness="0,0,1,1"
BorderBrush="#2C2C2E">
<TextBlock Text="2022-2023 PROJECT OVERVIEW"
TextTrimming="CharacterEllipsis"
FontSize="12"
FontWeight="SemiBold"
Foreground="#A6A7AC"
HorizontalAlignment="Left"
VerticalAlignment="Center"
Margin="15,0"/>
</Border>
<s:SciChartSurface Grid.Row="0" Grid.Column="1">
<s:SciChartSurface.XAxis>
<s:DoubleScaleDiscontinuousDateTimeAxis Height="50"
AxisBandsFrequency="Daily"
VisibleRange="{Binding XVisibleRange, Mode=TwoWay}"
VisibleRangeLimit="{Binding XVisibleRangeLimit}"
Calendar="{StaticResource XAxisCalendar}"
Style="{StaticResource DoubleScaleXAxisStyle}"/>
</s:SciChartSurface.XAxis>
<s:SciChartSurface.YAxis>
<s:NumericAxis Visibility="Collapsed"/>
</s:SciChartSurface.YAxis>
<s:SciChartSurface.Annotations>
<s:VerticalLineAnnotation X1="{Binding XEndDate, Mode=OneWay}">
<s:VerticalLineAnnotation.AnnotationLabels>
<s:AnnotationLabel Text="Project End"
Background="OrangeRed"
Foreground="White"
AxisLabelStyle="{StaticResource XAxisLabelStyle}"/>
</s:VerticalLineAnnotation.AnnotationLabels>
</s:VerticalLineAnnotation>
</s:SciChartSurface.Annotations>
<s:SciChartSurface.ChartModifier>
<s:VerticalSliceModifier ShowAxisLabels="False">
<s:VerticalSliceModifier.VerticalLines>
<s:VerticalLineAnnotation X1="{Binding XCurrentDate, Mode=TwoWay}">
<s:VerticalLineAnnotation.AnnotationLabels>
<s:AnnotationLabel Background="#42B649"
Foreground="White"
AxisLabelStyle="{StaticResource XAxisLabelStyle}"/>
</s:VerticalLineAnnotation.AnnotationLabels>
</s:VerticalLineAnnotation>
</s:VerticalSliceModifier.VerticalLines>
</s:VerticalSliceModifier>
</s:SciChartSurface.ChartModifier>
</s:SciChartSurface>
<ScrollViewer Grid.Row="1"
Grid.ColumnSpan="2"
Style="{StaticResource ItemsScrollViewerStyle}">
<b:Interaction.Behaviors>
<local:GridItemsScrollBehavior/>
</b:Interaction.Behaviors>
<Grid>
<Grid.ColumnDefinitions>
<ColumnDefinition Width="2*"/>
<ColumnDefinition Width="8*"/>
</Grid.ColumnDefinitions>
<ItemsControl Grid.Column="0"
Margin="0,-2,0,0"
ItemsSource="{Binding Items, Mode=OneWay}">
<ItemsControl.ItemsPanel>
<ItemsPanelTemplate>
<Grid>
<b:Interaction.Behaviors>
<local:GridItemsPanelBehavior/>
</b:Interaction.Behaviors>
</Grid>
</ItemsPanelTemplate>
</ItemsControl.ItemsPanel>
<ItemsControl.ItemTemplate>
<DataTemplate>
<Border MinHeight="75"
BorderThickness="0,1,1,0"
BorderBrush="#2C2C2E">
<Grid Margin="0,10,10,10" >
<Grid.ColumnDefinitions>
<ColumnDefinition Width="6"/>
<ColumnDefinition Width="*"/>
<ColumnDefinition Width="30"/>
</Grid.ColumnDefinitions>
<Border Grid.Column="0">
<Border.Style>
<Style TargetType="Border">
<Setter Property="Background" Value="#2C2C2E"/>
<Style.Triggers>
<DataTrigger Binding="{Binding IsCurrent}" Value="True">
<Setter Property="Background" Value="{Binding Fill}"/>
</DataTrigger>
</Style.Triggers>
</Style>
</Border.Style>
</Border>
<StackPanel Grid.Column="1" VerticalAlignment="Center" Margin="10,0">
<TextBlock Text="{Binding Name}"
TextTrimming="CharacterEllipsis"
FontSize="14"
FontWeight="SemiBold"
Foreground="#A6A7AC"/>
<TextBlock Text="{Binding Department}"
TextTrimming="CharacterEllipsis"
FontSize="12"
FontWeight="SemiBold"
Foreground="DimGray"/>
</StackPanel>
<TextBlock Grid.Column="2"
Text="{Binding Completion, StringFormat='{}{0}%'}"
FontSize="12"
FontWeight="SemiBold"
Foreground="DimGray"
HorizontalAlignment="Right"
VerticalAlignment="Center"/>
</Grid>
</Border>
</DataTemplate>
</ItemsControl.ItemTemplate>
</ItemsControl>
<s:SciChartSurface Grid.Column="1"
LeftAxesPanelTemplate="{StaticResource YAxesPanel}"
YAxes="{s:AxesBinding YAxes, Mode=OneWay}"
RenderableSeries="{s:SeriesBinding RenderableSeries}">
<s:SciChartSurface.XAxis>
<s:DoubleScaleDiscontinuousDateTimeAxis Height="0"
x:Name="DoubleScaleDateTimeAxis"
AxisBandsFrequency="Daily"
VisibleRange="{Binding XVisibleRange, Mode=TwoWay}"
VisibleRangeLimit="{Binding XVisibleRangeLimit}"
Calendar="{StaticResource XAxisCalendar}"
Style="{StaticResource DoubleScaleXAxisStyle}"/>
</s:SciChartSurface.XAxis>
<s:SciChartSurface.Annotations>
<s:VerticalLineAnnotation ShowLabel="False"
Stroke="OrangeRed"
StrokeThickness="1"
X1="{Binding XEndDate, Mode=OneWay}"/>
</s:SciChartSurface.Annotations>
<s:SciChartSurface.ChartModifier>
<s:ModifierGroup>
<s:ZoomPanModifier XyDirection="XDirection" ZoomExtentsY="False"/>
<s:ZoomExtentsModifier XyDirection="XDirection"/>
<s:MouseWheelZoomModifier XyDirection="XDirection"/>
<s:VerticalSliceModifier ShowAxisLabels="False">
<s:VerticalSliceModifier.VerticalLines>
<s:VerticalLineAnnotation IsEditable="True"
Stroke="#42B649"
StrokeThickness="1"
X1="{Binding XCurrentDate, Mode=TwoWay}"/>
</s:VerticalSliceModifier.VerticalLines>
</s:VerticalSliceModifier>
</s:ModifierGroup>
</s:SciChartSurface.ChartModifier>
</s:SciChartSurface>
</Grid>
</ScrollViewer>
<Border Grid.Row="2"
Grid.ColumnSpan="2"
Background="#262729">
<s:SciChartScrollbar Margin="4,0"
IsAnimated="False"
Axis="{Binding Source={x:Reference DoubleScaleDateTimeAxis}}"
GripsStyle="{StaticResource ScrollGripStyle}"/>
</Border>
</Grid>
</UserControl>GanttChartView.xaml.cs
View source codeusing System.Windows.Controls;
namespace SciChart.Examples.Examples.CreateMultiseriesChart.GanttChart
{
public partial class GanttChartView : UserControl
{
public GanttChartView()
{
InitializeComponent();
}
}
}GanttChartResources.xaml
View source code<ResourceDictionary xmlns="http://schemas.microsoft.com/winfx/2006/xaml/presentation"
xmlns:x="http://schemas.microsoft.com/winfx/2006/xaml"
xmlns:b="http://schemas.microsoft.com/xaml/behaviors"
xmlns:s="http://schemas.abtsoftware.co.uk/scichart"
xmlns:local="clr-namespace:SciChart.Examples.Examples.CreateMultiseriesChart.GanttChart">
<local:WeekDaysAxisCalendar x:Key="XAxisCalendar" x:Shared="False"/>
<Style x:Key="DoubleScaleXAxisStyle" TargetType="s:DoubleScaleDiscontinuousDateTimeAxis">
<Setter Property="GrowBy" Value="0.02,0.08"/>
<Setter Property="AxisAlignment" Value="Top"/>
<Setter Property="DrawMinorGridLines" Value="False"/>
<Setter Property="DrawMajorBands" Value="False"/>
<Setter Property="DrawAxisScaleBands" Value="False"/>
<Setter Property="BorderThickness" Value="0,0,0,1"/>
<Setter Property="BorderBrush" Value="#2C2C2E"/>
</Style>
<Style x:Key="XAxisLabelStyle" TargetType="s:AnnotationLabel">
<Setter Property="Text" Value="{Binding FormattedLabel, Mode=OneWay}"/>
<Setter Property="LabelPlacement" Value="Axis"/>
<Setter Property="MinHeight" Value="26"/>
<Setter Property="BorderThickness" Value="0"/>
<Setter Property="CornerRadius" Value="0"/>
</Style>
<ItemsPanelTemplate x:Key="YAxesPanel">
<Grid Background="#2C2C2E">
<b:Interaction.Behaviors>
<local:GridItemsPanelBehavior IsReverseOrder="True"/>
</b:Interaction.Behaviors>
</Grid>
</ItemsPanelTemplate>
<Style x:Key="ItemYAxisStyle" TargetType="s:AxisBase">
<Setter Property="Width" Value="0"/>
<Setter Property="MinHeight" Value="75"/>
<Setter Property="VisibleRange" Value="-0.2,1.2"/>
<Setter Property="AutoRange" Value="Never"/>
<Setter Property="DrawLabels" Value="False"/>
<Setter Property="DrawMinorTicks" Value="False"/>
<Setter Property="DrawMajorTicks" Value="False"/>
<Setter Property="DrawMinorGridLines" Value="False"/>
<Setter Property="DrawMajorGridLines" Value="False"/>
<Setter Property="DrawMajorBands" Value="False"/>
<Setter Property="s:MouseWheelZoomModifier.IncludeAxis" Value="False"/>
</Style>
<Style x:Key="DefaultYAxisStyle" TargetType="s:AxisBase">
<Setter Property="Visibility" Value="Collapsed"/>
<Setter Property="DrawLabels" Value="False"/>
<Setter Property="DrawMinorTicks" Value="False"/>
<Setter Property="DrawMajorTicks" Value="False"/>
<Setter Property="DrawMinorGridLines" Value="False"/>
<Setter Property="DrawMajorGridLines" Value="False"/>
<Setter Property="DrawMajorBands" Value="False"/>
</Style>
<DataTemplate x:Key="ItemTooltipTemplate" DataType="s:StripeSeriesInfo">
<StackPanel Orientation="Vertical">
<TextBlock Foreground="White">
<Run Text="Start:"/>
<Run Text="{Binding FormattedXValue, Mode=OneWay}"/>
</TextBlock>
<TextBlock Foreground="White">
<Run Text="End:"/>
<Run Text="{Binding FormattedX1Value, Mode=OneWay}"/>
</TextBlock>
</StackPanel>
</DataTemplate>
<DropShadowEffect x:Key="DropShadowEffect"
BlurRadius="5"
Direction="-45"
ShadowDepth="5"
Color="DimGray"/>
<Style x:Key="ItemRenderableSeriesStyle" TargetType="s:FastStripeRenderableSeriesForMvvm">
<Setter Property="LabelColor" Value="#272727"/>
<Setter Property="LabelFontSize" Value="13"/>
<Setter Property="s:VerticalSliceModifier.TooltipTemplate" Value="{StaticResource ItemTooltipTemplate}"/>
<Setter Property="s:VerticalSliceModifier.TooltipContainerStyle">
<Setter.Value>
<Style TargetType="s:TooltipControl">
<Setter Property="Template">
<Setter.Value>
<ControlTemplate TargetType="s:TooltipControl">
<Border Background="#42B649"
CornerRadius="5"
Opacity="0.9"
Margin="0,0,5,5"
Padding="5"
Effect="{StaticResource DropShadowEffect}">
<ContentPresenter Content="{TemplateBinding DataContext}"
ContentTemplate="{TemplateBinding ContentTemplate}"/>
</Border>
</ControlTemplate>
</Setter.Value>
</Setter>
</Style>
</Setter.Value>
</Setter>
<Setter Property="RolloverMarkerTemplate">
<Setter.Value>
<ControlTemplate>
<Ellipse Width="10"
Height="10"
Fill="#42B649"
Effect="{StaticResource DropShadowEffect}"/>
</ControlTemplate>
</Setter.Value>
</Setter>
</Style>
<Style x:Key="ItemsScrollViewerStyle" TargetType="{x:Type ScrollViewer}">
<Setter Property="VerticalScrollBarVisibility" Value="Auto"/>
<Setter Property="HorizontalScrollBarVisibility" Value="Disabled"/>
<Setter Property="OverridesDefaultStyle" Value="True"/>
<Setter Property="Template">
<Setter.Value>
<ControlTemplate TargetType="{x:Type ScrollViewer}">
<Grid Background="{TemplateBinding Background}">
<ScrollContentPresenter />
<ScrollBar x:Name="PART_VerticalScrollBar"
HorizontalAlignment="Right"
VerticalAlignment="Stretch"
Value="{TemplateBinding VerticalOffset}"
Maximum="{TemplateBinding ScrollableHeight}"
ViewportSize="{TemplateBinding ViewportHeight}"
Visibility="{TemplateBinding ComputedVerticalScrollBarVisibility}"/>
<ScrollBar x:Name="PART_HorizontalScrollBar"
VerticalAlignment="Bottom"
HorizontalAlignment="Stretch"
Orientation="Horizontal"
Value="{TemplateBinding HorizontalOffset}"
Maximum="{TemplateBinding ScrollableWidth}"
ViewportSize="{TemplateBinding ViewportWidth}"
Visibility="{TemplateBinding ComputedHorizontalScrollBarVisibility}"/>
</Grid>
</ControlTemplate>
</Setter.Value>
</Setter>
</Style>
<Style x:Key="ScrollThumbStyle" TargetType="{x:Type Thumb}">
<Setter Property="Template">
<Setter.Value>
<ControlTemplate TargetType="{x:Type Thumb}">
<Border Height="Auto"
Width="Auto"
CornerRadius="2"
BorderThickness="1"
BorderBrush="#121212"
HorizontalAlignment="Stretch"
VerticalAlignment="Stretch"
Background="{TemplateBinding Background}"/>
</ControlTemplate>
</Setter.Value>
</Setter>
</Style>
<Style TargetType="{x:Type ScrollBar}">
<Setter Property="Stylus.IsFlicksEnabled" Value="False"/>
<Setter Property="Foreground" Value="#535353"/>
<Setter Property="Background" Value="Transparent"/>
<Setter Property="MinWidth" Value="8"/>
<Setter Property="MinHeight" Value="8"/>
<Setter Property="Width" Value="8"/>
<Setter Property="Height" Value="Auto"/>
<Setter Property="Template">
<Setter.Value>
<ControlTemplate TargetType="{x:Type ScrollBar}">
<Grid x:Name="GridRoot" Background="{TemplateBinding Background}">
<Border x:Name="BorderBackground" CornerRadius="0" Background="Transparent">
<Track x:Name="PART_Track" IsDirectionReversed="True" Focusable="False">
<Track.Thumb>
<Thumb x:Name="Thumb"
Background="{TemplateBinding Foreground}"
Style="{DynamicResource ScrollThumbStyle}"/>
</Track.Thumb>
<Track.IncreaseRepeatButton>
<RepeatButton x:Name="PageUp"
Opacity="0"
Focusable="False"
Command="ScrollBar.PageDownCommand"/>
</Track.IncreaseRepeatButton>
<Track.DecreaseRepeatButton>
<RepeatButton x:Name="PageDown"
Opacity="0"
Focusable="False"
Command="ScrollBar.PageUpCommand"/>
</Track.DecreaseRepeatButton>
</Track>
</Border>
</Grid>
<ControlTemplate.Triggers>
<Trigger Property="IsMouseOver" Value="True">
<Setter TargetName="Thumb" Property="Background" Value="#838383"/>
<Setter TargetName="BorderBackground" Property="Background" Value="#262728"/>
</Trigger>
<Trigger Property="IsEnabled" Value="False">
<Setter TargetName="Thumb" Property="Visibility" Value="Collapsed" />
</Trigger>
</ControlTemplate.Triggers>
</ControlTemplate>
</Setter.Value>
</Setter>
</Style>
<Style x:Key="ScrollGripStyle" TargetType="s:ScrollbarResizeGrip">
<Setter Property="OverridesDefaultStyle" Value="True"/>
<Setter Property="VerticalAlignment" Value="Center"/>
<Setter Property="Template">
<Setter.Value>
<ControlTemplate TargetType="s:ScrollbarResizeGrip">
<Border x:Name="Thumb"
Height="16"
Width="8"
CornerRadius="2"
BorderThickness="1"
BorderBrush="#121212"
Background="#535353"/>
<ControlTemplate.Triggers>
<Trigger SourceName="Thumb" Property="IsMouseOver" Value="True">
<Setter TargetName="Thumb" Property="Background" Value="#838383"/>
</Trigger>
</ControlTemplate.Triggers>
</ControlTemplate>
</Setter.Value>
</Setter>
</Style>
</ResourceDictionary>GanttChartViewModel.cs
View source codeusing System;
using System.Collections.Generic;
using System.Linq;
using System.Windows.Media;
using SciChart.Charting.Model.ChartSeries;
using SciChart.Charting.Model.DataSeries;
using SciChart.Charting.Visuals.Axes;
using SciChart.Core.Extensions;
using SciChart.Data.Model;
using SciChart.Examples.ExternalDependencies.Common;
namespace SciChart.Examples.Examples.CreateMultiseriesChart.GanttChart
{
public class GanttChartViewModel : BaseViewModel
{
private List<IAxisViewModel> _yAxes;
private List<IRenderableSeriesViewModel> _renderableSeries;
private DateRange _xVisibleRange;
private DateTime _xCurrentDate;
private DateTime _xEndDate;
public IEnumerable<GanttItemViewModel> Items { get; }
public IEnumerable<IAxisViewModel> YAxes => ToAxes();
public IEnumerable<IRenderableSeriesViewModel> RenderableSeries => ToRenderableSeries();
public DateRange XVisibleRangeLimit { get; }
public DateRange XVisibleRange
{
get => _xVisibleRange;
set
{
_xVisibleRange = value;
OnPropertyChanged(nameof(XVisibleRange));
}
}
public DateTime XCurrentDate
{
get => _xCurrentDate;
set
{
if (_xCurrentDate != value)
{
_xCurrentDate = value;
OnPropertyChanged(nameof(XCurrentDate));
Items.ForEachDo(x => x.CheckCompletion(XCurrentDate));
}
}
}
public DateTime XEndDate
{
get => _xEndDate;
set
{
if (_xEndDate != value)
{
_xEndDate = value;
OnPropertyChanged(nameof(XEndDate));
}
}
}
public GanttChartViewModel()
{
Items = new[]
{
new GanttItemViewModel
{
Id = "1",
Name = "New Product Strategy",
Department = "Marketing/Business",
Start = new DateTime(2022, 05, 10),
End = new DateTime(2022, 06, 10),
Color = Color.FromRgb(255, 95, 100)
},
new GanttItemViewModel
{
Id = "2",
Name = "Idea Generation",
Department = "Marketing/Engineering",
Start = new DateTime(2022, 05, 10),
End = new DateTime(2022, 06, 30),
Color = Color.FromRgb(255, 150, 70)
},
new GanttItemViewModel
{
Id = "3",
Name = "Screening",
Department = "Marketing",
Start = new DateTime(2022, 06, 30),
End = new DateTime(2022, 07, 25),
Color = Color.FromRgb(245, 185, 50)
},
new GanttItemViewModel
{
Id = "4",
Name = "Concept Testing",
Department = "Engineering",
Start = new DateTime(2022, 07, 25),
End = new DateTime(2022, 09, 02),
Color = Color.FromRgb(35, 225, 130)
},
new GanttItemViewModel
{
Id = "5",
Name = "Business Analysis",
Department = "Business",
Start = new DateTime(2022, 07, 25),
End = new DateTime(2022, 10, 10),
Color = Color.FromRgb(45, 205, 185)
},
new GanttItemViewModel
{
Id = "6",
Name = "Product Development",
Department = "Engineering",
Start = new DateTime(2022, 09, 12),
End = new DateTime(2023, 01, 20),
Color = Color.FromRgb(70, 170, 240)
},
new GanttItemViewModel
{
Id = "7",
Name = "Market Testing",
Department = "Marketing",
Start = new DateTime(2022, 11, 01),
End = new DateTime(2023, 02, 14),
Color = Color.FromRgb(75, 125, 235)
},
new GanttItemViewModel
{
Id = "8",
Name = "Focus Group Testing",
Department = "Marketing",
Start = new DateTime(2022, 12, 30),
End = new DateTime(2023, 02, 14),
Color = Color.FromRgb(165, 95, 235)
},
new GanttItemViewModel
{
Id = "9",
Name = "Authorization",
Department = "Business/Engineering",
Start = new DateTime(2023, 01, 20),
End = new DateTime(2023, 02, 14),
Color = Color.FromRgb(235, 65, 145)
},
new GanttItemViewModel
{
Id = "10",
Name = "Commercialization",
Department = "Business",
Start = new DateTime(2023, 01, 20),
End = new DateTime(2023, 03, 10),
Color = Color.FromRgb(215, 50, 50)
},
new GanttItemViewModel
{
Id = "11",
Name = "Product Pricing",
Department = "Business/Marketing",
Start = new DateTime(2023, 02, 15),
End = new DateTime(2023, 03, 10),
Color = Color.FromRgb(240, 90, 35)
},
new GanttItemViewModel
{
Id = "12",
Name = "Product Licensing",
Department = "Business",
Start = new DateTime(2023, 02, 15),
End = new DateTime(2023, 03, 28),
Color = Color.FromRgb(255, 195, 20)
},
new GanttItemViewModel
{
Id = "13",
Name = "Promotion",
Department = "Marketing",
Start = new DateTime(2023, 03, 10),
End = new DateTime(2023, 04, 10),
Color = Color.FromRgb(40, 205, 195)
},
new GanttItemViewModel
{
Id = "14",
Name = "Launch",
Department = "Business",
Start = new DateTime(2023, 03, 28),
End = new DateTime(2023, 04, 15),
Color = Color.FromRgb(125, 215, 55)
}
};
XVisibleRange = new DateRange
{
Min = new DateTime(2022, 05, 03),
Max = new DateTime(2023, 02, 23)
};
XVisibleRangeLimit = new DateRange
{
Min = new DateTime(2022, 02, 01),
Max = new DateTime(2023, 07, 31)
};
XCurrentDate = new DateTime(2022, 07, 04);
XEndDate = new DateTime(2023, 04, 17);
}
private IEnumerable<IAxisViewModel> ToAxes()
{
if (_yAxes == null)
{
_yAxes = new List<IAxisViewModel>
{
new NumericAxisViewModel
{
AxisAlignment = AxisAlignment.Right,
StyleKey = "DefaultYAxisStyle"
}
};
_yAxes.AddRange(Items.Select(item => new NumericAxisViewModel
{
Id = item.Id,
AxisAlignment = AxisAlignment.Left,
StyleKey = "ItemYAxisStyle"
}));
}
return _yAxes;
}
private IEnumerable<IRenderableSeriesViewModel> ToRenderableSeries()
{
if (_renderableSeries == null)
{
_renderableSeries = new List<IRenderableSeriesViewModel>(
Items.Select(item => new StripeRenderableSeriesViewModel
{
YAxisId = item.Id,
Stroke = item.Color,
Fill = item.Fill,
DataSeries = new StripeDataSeries<DateTime, double>(new[] { item.Start }, new[] { item.End }, 0d, 1d),
PointLabelProvider = new GanttTextLabelProvider(item),
StyleKey = "ItemRenderableSeriesStyle"
}));
}
return _renderableSeries;
}
}
}GanttItemViewModel.cs
View source codeusing System;
using System.Windows.Media;
using SciChart.Examples.ExternalDependencies.Common;
namespace SciChart.Examples.Examples.CreateMultiseriesChart.GanttChart
{
public class GanttItemViewModel : BaseViewModel
{
private bool _isCurrent;
private double _completion;
private Color _color;
private DateTime _start, _end;
public string Id { get; set; }
public string Name { get; set; }
public string Department { get; set; }
public Color Color
{
get => _color;
set
{
_color = value;
OnPropertyChanged(nameof(Color));
OnPropertyChanged(nameof(Fill));
}
}
public Brush Fill => new SolidColorBrush(Color);
public DateTime Start
{
get => _start;
set
{
_start = WeekDayStartDate(value);
OnPropertyChanged(nameof(Start));
}
}
public DateTime End
{
get => _end;
set
{
_end = WeekDayEndDate(value);
OnPropertyChanged(nameof(End));
}
}
public double Completion
{
get => _completion;
set
{
_completion = value;
OnPropertyChanged(nameof(Completion));
}
}
public bool IsCurrent
{
get => _isCurrent;
set
{
_isCurrent = value;
OnPropertyChanged(nameof(IsCurrent));
}
}
public void CheckCompletion(DateTime currentDate)
{
IsCurrent = currentDate >= Start && currentDate <= End;
if (IsCurrent)
{
Completion = (currentDate.Ticks - Start.Ticks) * 100 / (End.Ticks - Start.Ticks);
}
else
{
Completion = currentDate > End ? 100d : 0d;
}
}
private DateTime WeekDayStartDate(DateTime startDate)
{
if (startDate.DayOfWeek == DayOfWeek.Saturday)
return startDate.AddDays(2);
if (startDate.DayOfWeek == DayOfWeek.Sunday)
return startDate.AddDays(1);
return startDate;
}
private DateTime WeekDayEndDate(DateTime endDate)
{
if (endDate.DayOfWeek == DayOfWeek.Saturday)
return endDate.AddDays(-1);
if (endDate.DayOfWeek == DayOfWeek.Sunday)
return endDate.AddDays(-2);
return endDate;
}
}
}GanttTextLabelProvider.cs
View source codeusing System;
using SciChart.Charting.Model.DataSeries;
using SciChart.Charting.Visuals;
using SciChart.Charting.Visuals.RenderableSeries;
namespace SciChart.Examples.Examples.CreateMultiseriesChart.GanttChart
{
public class GanttTextLabelProvider : IPointLabelProvider
{
private readonly GanttItemViewModel _item;
public GanttTextLabelProvider(GanttItemViewModel item)
{
_item = item;
}
public void OnBeginSeriesDraw(IRenderableSeries rSeries)
{
}
public string GetLabelText(IRenderableSeries rSeries, int index, IPointMetadata metadata)
{
var days = CountWeekWorkDays(_item.Start, _item.End);
return $"{days}d";
}
private int CountWeekWorkDays(DateTime start, DateTime end)
{
var days = (end - start).Days + 1;
return WorkDaysInFullWeek(days) + WorkDaysInPartialWeek(start.DayOfWeek, days);
}
private int WorkDaysInFullWeek(int totalDays)
{
return totalDays / 7 * 5;
}
private int WorkDaysInPartialWeek(DayOfWeek firstDay, int totalDays)
{
var remainingDays = totalDays % 7;
var daysToSaturday = (int)DayOfWeek.Saturday - (int)firstDay;
if (remainingDays <= daysToSaturday)
return remainingDays;
if (remainingDays <= daysToSaturday + 2)
return daysToSaturday;
return remainingDays - 2;
}
}
}GridItemsPanelBehavior.cs
View source codeusing System;
using System.Windows;
using System.Windows.Controls;
using Microsoft.Xaml.Behaviors;
namespace SciChart.Examples.Examples.CreateMultiseriesChart.GanttChart
{
public class GridItemsPanelBehavior : Behavior<Grid>
{
public double? RowHeight { get; set; }
public bool IsReverseOrder { get; set;}
protected override void OnAttached()
{
base.OnAttached();
AssociatedObject.Loaded += OnLoaded;
}
protected override void OnDetaching()
{
base.OnDetaching();
AssociatedObject.Loaded -= OnLoaded;
}
private int GetIndex(int index, int count)
{
if (IsReverseOrder)
{
return count - index - 1;
}
return index;
}
private void OnLoaded(object sender, EventArgs e)
{
if (sender is Grid grid && grid.Children.Count > 0)
{
grid.RowDefinitions.Clear();
var count = grid.Children.Count;
for (int i = 0; i < count; i++)
{
var child = grid.Children[GetIndex(i, count)];
grid.RowDefinitions.Add(new RowDefinition
{
Height = RowHeight.HasValue
? new GridLength(RowHeight.Value)
: new GridLength(1.0, GridUnitType.Star)
});
Grid.SetRow(child, i);
}
if (RowHeight.HasValue)
{
grid.RowDefinitions.Add(new RowDefinition
{
Height = new GridLength(1.0, GridUnitType.Star)
});
}
}
}
}
}GridItemsScrollBehavior.cs
View source codeusing System.Windows.Controls;
using System.Windows.Input;
using Microsoft.Xaml.Behaviors;
namespace SciChart.Examples.Examples.CreateMultiseriesChart.GanttChart
{
public class GridItemsScrollBehavior : Behavior<ScrollViewer>
{
protected override void OnAttached()
{
base.OnAttached();
AssociatedObject.PreviewMouseWheel += OnPreviewMouseWheel;
}
protected override void OnDetaching()
{
base.OnDetaching();
AssociatedObject.PreviewMouseWheel -= OnPreviewMouseWheel;
}
private void OnPreviewMouseWheel(object sender, MouseWheelEventArgs e)
{
if (Keyboard.Modifiers.HasFlag(ModifierKeys.Control))
{
AssociatedObject.ScrollToVerticalOffset(AssociatedObject.VerticalOffset - e.Delta);
e.Handled = true;
}
}
}
}WeekDaysAxisCalendar.cs
View source codeusing System;
using SciChart.Charting.Numerics.Calendars;
namespace SciChart.Examples.Examples.CreateMultiseriesChart.GanttChart
{
public class WeekDaysAxisCalendar : DiscontinuousDateTimeCalendarBase
{
public WeekDaysAxisCalendar()
{
SkipDaysInWeek.Add(DayOfWeek.Saturday);
SkipDaysInWeek.Add(DayOfWeek.Sunday);
}
}
}