WPF Chart - Examples
SciChart WPF ships with hundreds of WPF Chart Examples which you can browse, play with, view the source-code and even export each WPF Chart Example to a stand-alone Visual Studio solution. All of this is possible with the new and improved SciChart WPF Examples Suite, which ships as part of the SciChart WPF SDK.
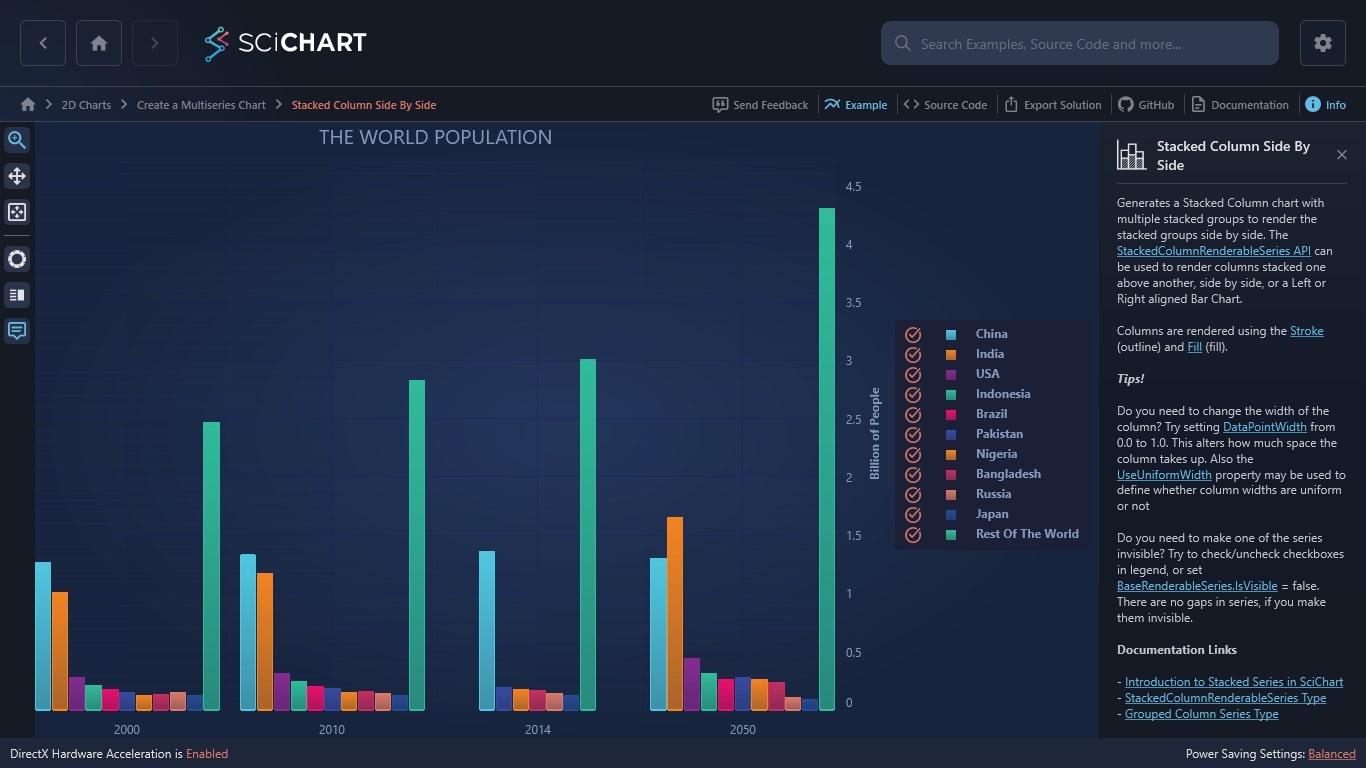
Generates a Stacked Column chart with multiple stacked groups to render the stacked groups side by side. The StackedColumnRenderableSeries API can be used to render columns stacked one above another, side by side, or a Left or Right aligned Bar Chart.
Columns are rendered using the Stroke (outline) and Fill (fill).
Tips!
Do you need to change the width of the column? Try setting DataPointWidth from 0.0 to 1.0. This alters how much space the column takes up. Also the UseUniformWidth property may be used to define whether column widths are uniform or not
Do you need to make one of the series invisible? Try to check/uncheck checkboxes in legend, or set BaseRenderableSeries.IsVisible = false. There are no gaps in series, if you make them invisible.
Documentation Links
– Introduction to Stacked Series in SciChart
– StackedColumnRenderableSeries Type
– Grouped Column Series Type

The C#/WPF source code for the WPF Stacked Column Chart Side by Side example is included below (Scroll down!).
Did you know you can also view the source code from one of the following sources as well?
- Clone the SciChart.WPF.Examples from Github.
- Or, view source in the SciChart WPF Examples suite.
- Also the SciChart WPF Trial contains the full source for the examples (link below).
StackedColumnChartSideBySideExampleView.xaml
View source code<UserControl x:Class="SciChart.Examples.Examples.CreateMultiseriesChart.StackedColumnChartSideBySideExampleView"
xmlns="http://schemas.microsoft.com/winfx/2006/xaml/presentation"
xmlns:x="http://schemas.microsoft.com/winfx/2006/xaml"
xmlns:s="http://schemas.abtsoftware.co.uk/scichart"
xmlns:local="clr-namespace:SciChart.Examples.Examples.CreateMultiseriesChart"
Loaded="StackedColumnChartSideBySideExampleView_OnLoaded"
xmlns:mc="http://schemas.openxmlformats.org/markup-compatibility/2006"
xmlns:d="http://schemas.microsoft.com/expression/blend/2008"
xmlns:ext="http://schemas.abtsoftware.co.uk/scichart/exampleExternals"
d:DesignHeight="400"
d:DesignWidth="600"
mc:Ignorable="d">
<UserControl.Resources>
<local:YearsLabelProvider x:Key="YearsLabelProvider" />
<Style TargetType="s:StackedColumnRenderableSeries">
<Setter Property="Stroke" Value="Transparent" />
<Setter Property="LegendMarkerTemplate">
<Setter.Value>
<DataTemplate DataType="s:StackedColumnRenderableSeries">
<Rectangle Width="10"
Fill="{Binding Fill}"
Stretch="Fill" />
</DataTemplate>
</Setter.Value>
</Setter>
</Style>
<Style TargetType="s:SciChartLegend">
<Setter Property="Background" Value="Transparent" />
<Setter Property="BorderThickness" Value="0" />
</Style>
</UserControl.Resources>
<Grid>
<Grid.ColumnDefinitions>
<ColumnDefinition Width="Auto" />
<ColumnDefinition Width="*" />
</Grid.ColumnDefinitions>
<!-- The SciChartInteractionToolbar adds zoom, pan, zoom extents and rotate functionality -->
<!-- to the chart and is included for example purposes. -->
<!-- If you wish to know how to zoom and pan a chart then do a search for Zoom Pan in the Examples suite! -->
<ext:SciChartInteractionToolbar TargetSurface="{Binding Source={x:Reference Name=SciChart}}" />
<!-- Create the chart surface -->
<s:SciChartSurface x:Name="SciChart"
ChartTitle="THE WORLD POPULATION"
Padding="0" BorderThickness="0" Grid.Column="1">
<!-- Declare RenderableSeries -->
<s:SciChartSurface.RenderableSeries>
<s:StackedColumnRenderableSeries x:Name="ChinaSeries"
DataPointWidth="0.9"
Fill="#3399ff"
Stroke="#3399ff"
StackedGroupId="China">
<s:StackedColumnRenderableSeries.SeriesAnimation>
<s:WaveAnimation AnimationDelay="0:0:1" Duration="0:0:3" PointDurationFraction="0.3"/>
</s:StackedColumnRenderableSeries.SeriesAnimation>
</s:StackedColumnRenderableSeries>
<s:StackedColumnRenderableSeries x:Name="IndiaSeries"
Fill="#014358"
Stroke="#014358"
StackedGroupId="India">
<s:StackedColumnRenderableSeries.SeriesAnimation>
<s:WaveAnimation AnimationDelay="0:0:1" Duration="0:0:3" PointDurationFraction="0.3"/>
</s:StackedColumnRenderableSeries.SeriesAnimation>
</s:StackedColumnRenderableSeries>
<s:StackedColumnRenderableSeries x:Name="USASeries"
Fill="#1f8a71"
Stroke="#1f8a71"
StackedGroupId="USA">
<s:StackedColumnRenderableSeries.SeriesAnimation>
<s:WaveAnimation AnimationDelay="0:0:1" Duration="0:0:3" PointDurationFraction="0.3"/>
</s:StackedColumnRenderableSeries.SeriesAnimation>
</s:StackedColumnRenderableSeries>
<s:StackedColumnRenderableSeries x:Name="IndonesiaSeries"
Fill="#bdd63b"
Stroke="#bdd63b"
StackedGroupId="Indonesia">
<s:StackedColumnRenderableSeries.SeriesAnimation>
<s:WaveAnimation AnimationDelay="0:0:1" Duration="0:0:3" PointDurationFraction="0.3"/>
</s:StackedColumnRenderableSeries.SeriesAnimation>
</s:StackedColumnRenderableSeries>
<s:StackedColumnRenderableSeries x:Name="BrazilSeries"
Fill="#ffe00b"
Stroke="#ffe00b"
StackedGroupId="Brazil">
<s:StackedColumnRenderableSeries.SeriesAnimation>
<s:WaveAnimation AnimationDelay="0:0:1" Duration="0:0:3" PointDurationFraction="0.3"/>
</s:StackedColumnRenderableSeries.SeriesAnimation>
</s:StackedColumnRenderableSeries>
<s:StackedColumnRenderableSeries x:Name="PakistanSeries"
Fill="#f27421"
Stroke="#f27421"
StackedGroupId="Pakistan">
<s:StackedColumnRenderableSeries.SeriesAnimation>
<s:WaveAnimation AnimationDelay="0:0:1" Duration="0:0:3" PointDurationFraction="0.3"/>
</s:StackedColumnRenderableSeries.SeriesAnimation>
</s:StackedColumnRenderableSeries>
<s:StackedColumnRenderableSeries x:Name="NigeriaSeries"
Fill="#bb0000"
Stroke="#bb0000"
StackedGroupId="Nigeria">
<s:StackedColumnRenderableSeries.SeriesAnimation>
<s:WaveAnimation AnimationDelay="0:0:1" Duration="0:0:3" PointDurationFraction="0.3"/>
</s:StackedColumnRenderableSeries.SeriesAnimation>
</s:StackedColumnRenderableSeries>
<s:StackedColumnRenderableSeries x:Name="BangladeshSeries"
Fill="#550033"
Stroke="#550033"
StackedGroupId="BangladeshSeries">
<s:StackedColumnRenderableSeries.SeriesAnimation>
<s:WaveAnimation AnimationDelay="0:0:1" Duration="0:0:3" PointDurationFraction="0.3"/>
</s:StackedColumnRenderableSeries.SeriesAnimation>
</s:StackedColumnRenderableSeries>
<s:StackedColumnRenderableSeries x:Name="RussiaSeries"
Fill="#339933"
Stroke="#339933"
StackedGroupId="Russia">
<s:StackedColumnRenderableSeries.SeriesAnimation>
<s:WaveAnimation AnimationDelay="0:0:1" Duration="0:0:3" PointDurationFraction="0.3"/>
</s:StackedColumnRenderableSeries.SeriesAnimation>
</s:StackedColumnRenderableSeries>
<s:StackedColumnRenderableSeries x:Name="JapanSeries"
Fill="#00aba9"
Stroke="#00aba9"
StackedGroupId="Japan">
<s:StackedColumnRenderableSeries.SeriesAnimation>
<s:WaveAnimation AnimationDelay="0:0:1" Duration="0:0:3" PointDurationFraction="0.3"/>
</s:StackedColumnRenderableSeries.SeriesAnimation>
</s:StackedColumnRenderableSeries>
<s:StackedColumnRenderableSeries x:Name="RestOfTheWorldSeries"
Fill="#560068"
Stroke="#560068"
StackedGroupId="RestOfTheWorld">
<s:StackedColumnRenderableSeries.SeriesAnimation>
<s:WaveAnimation AnimationDelay="0:0:1" Duration="0:0:3" PointDurationFraction="0.3"/>
</s:StackedColumnRenderableSeries.SeriesAnimation>
</s:StackedColumnRenderableSeries>
</s:SciChartSurface.RenderableSeries>
<!-- Create an X Axis -->
<s:SciChartSurface.XAxis>
<s:NumericAxis AutoTicks="False"
LabelProvider="{StaticResource YearsLabelProvider}"
MajorDelta="1"
MinorDelta="0.5"
DrawMajorBands="True"
VisibleRangeLimit="-3, 7" />
</s:SciChartSurface.XAxis>
<!-- Create a Y Axis with GrowBy -->
<s:SciChartSurface.YAxis>
<s:NumericAxis AutoRange="Always"
AxisTitle="Billion of People"
GrowBy="0,0.1"
DrawMajorBands="True"
VisibleRangeLimit="-5, 10" />
</s:SciChartSurface.YAxis>
<s:SciChartSurface.ChartModifier>
<s:ModifierGroup>
<s:RubberBandXyZoomModifier IsXAxisOnly="True" />
<s:LegendModifier Margin="10"
VerticalAlignment="Center"
GetLegendDataFor="AllSeries"
LegendPlacement="Right"
ShowLegend="True"
ShowVisibilityCheckboxes="True" />
<s:TooltipModifier />
</s:ModifierGroup>
</s:SciChartSurface.ChartModifier>
</s:SciChartSurface>
</Grid>
</UserControl>StackedColumnChartSideBySideExampleView.xaml.cs
View source code// *************************************************************************************
// SCICHART® Copyright SciChart Ltd. 2011-2022. All rights reserved.
//
// Web: http://www.scichart.com
// Support: support@scichart.com
// Sales: sales@scichart.com
//
// StackedColumnChartSideBySideExampleView.xaml.cs is part of the SCICHART® Examples. Permission is hereby granted
// to modify, create derivative works, distribute and publish any part of this source
// code whether for commercial, private or personal use.
//
// The SCICHART® examples are distributed in the hope that they will be useful, but
// without any warranty. It is provided "AS IS" without warranty of any kind, either
// expressed or implied.
// *************************************************************************************
using System.Windows;
using SciChart.Charting.Model.DataSeries;
namespace SciChart.Examples.Examples.CreateMultiseriesChart
{
/// <summary>
/// Interaction logic for StackedColumnChartSideBySideExampleView.xaml
/// </summary>
public partial class StackedColumnChartSideBySideExampleView
{
public StackedColumnChartSideBySideExampleView()
{
InitializeComponent();
}
private void StackedColumnChartSideBySideExampleView_OnLoaded(object sender, RoutedEventArgs e)
{
var china = new[] { 1.269, 1.330, 1.356, 1.304 };
var india = new[] { 1.004, 1.173, 1.236, 1.656 };
var usa = new[] { 0.282, 0.310, 0.319, 0.439 };
var indonesia = new[] { 0.214, 0.243, 0.254, 0.313 };
var brazil = new[] { 0.176, 0.201, 0.203, 0.261 };
var pakistan = new[] { 0.146, 0.184, 0.196, 0.276 };
var nigeria = new[] { 0.123, 0.152, 0.177, 0.264 };
var bangladesh = new[] { 0.130, 0.156, 0.166, 0.234 };
var russia = new[] { 0.147, 0.139, 0.142, 0.109 };
var japan = new[] { 0.126, 0.127, 0.127, 0.094 };
var restOfTheWorld = new[] { 2.466, 2.829, 3.005, 4.306 };
var chinaDataSeries = new UniformXyDataSeries<double> { SeriesName = "China" };
var indiaDataSeries = new UniformXyDataSeries<double> { SeriesName = "India" };
var usaDataSeries = new UniformXyDataSeries<double> { SeriesName = "USA" };
var indoneziaDataSeries = new UniformXyDataSeries<double> { SeriesName = "Indonesia" };
var brazilDataSeries = new UniformXyDataSeries<double> { SeriesName = "Brazil" };
var pakistanDataSeries = new UniformXyDataSeries<double> { SeriesName = "Pakistan" };
var nigeriaDataSeries = new UniformXyDataSeries<double> { SeriesName = "Nigeria" };
var bangladeshDataSeries = new UniformXyDataSeries<double> { SeriesName = "Bangladesh" };
var russiaDataSeries = new UniformXyDataSeries<double> { SeriesName = "Russia" };
var japanDataSeries = new UniformXyDataSeries<double> { SeriesName = "Japan" };
var restOfTheWorldDataSeries = new UniformXyDataSeries<double> { SeriesName = "Rest Of The World" };
var totalDataSeries = new UniformXyDataSeries<double> { SeriesName = "Total" };
for (int i = 0; i < 4; i++)
{
chinaDataSeries.Append(china[i]);
if (i != 2)
{
indiaDataSeries.Append(india[i]);
usaDataSeries.Append(usa[i]);
indoneziaDataSeries.Append(indonesia[i]);
brazilDataSeries.Append(brazil[i]);
}
else
{
indiaDataSeries.Append(double.NaN);
usaDataSeries.Append(double.NaN);
indoneziaDataSeries.Append(double.NaN);
brazilDataSeries.Append(double.NaN);
}
pakistanDataSeries.Append(pakistan[i]);
nigeriaDataSeries.Append(nigeria[i]);
bangladeshDataSeries.Append(bangladesh[i]);
russiaDataSeries.Append(russia[i]);
japanDataSeries.Append(japan[i]);
restOfTheWorldDataSeries.Append(restOfTheWorld[i]);
totalDataSeries.Append(china[i] + india[i] + usa[i] + indonesia[i] + brazil[i] + pakistan[i] +
nigeria[i] + bangladesh[i] + russia[i] + japan[i] + restOfTheWorld[i]);
}
using (SciChart.SuspendUpdates())
{
ChinaSeries.DataSeries = chinaDataSeries;
IndiaSeries.DataSeries = indiaDataSeries;
USASeries.DataSeries = usaDataSeries;
IndonesiaSeries.DataSeries = indoneziaDataSeries;
BrazilSeries.DataSeries = brazilDataSeries;
PakistanSeries.DataSeries = pakistanDataSeries;
NigeriaSeries.DataSeries = nigeriaDataSeries;
BangladeshSeries.DataSeries = bangladeshDataSeries;
RussiaSeries.DataSeries = russiaDataSeries;
JapanSeries.DataSeries = japanDataSeries;
RestOfTheWorldSeries.DataSeries = restOfTheWorldDataSeries;
}
SciChart.ZoomExtents();
}
}
}YearsLabelProvider.cs
View source code