WPF Chart - Examples
SciChart WPF ships with hundreds of WPF Chart Examples which you can browse, play with, view the source-code and even export each WPF Chart Example to a stand-alone Visual Studio solution. All of this is possible with the new and improved SciChart WPF Examples Suite, which ships as part of the SciChart WPF SDK.
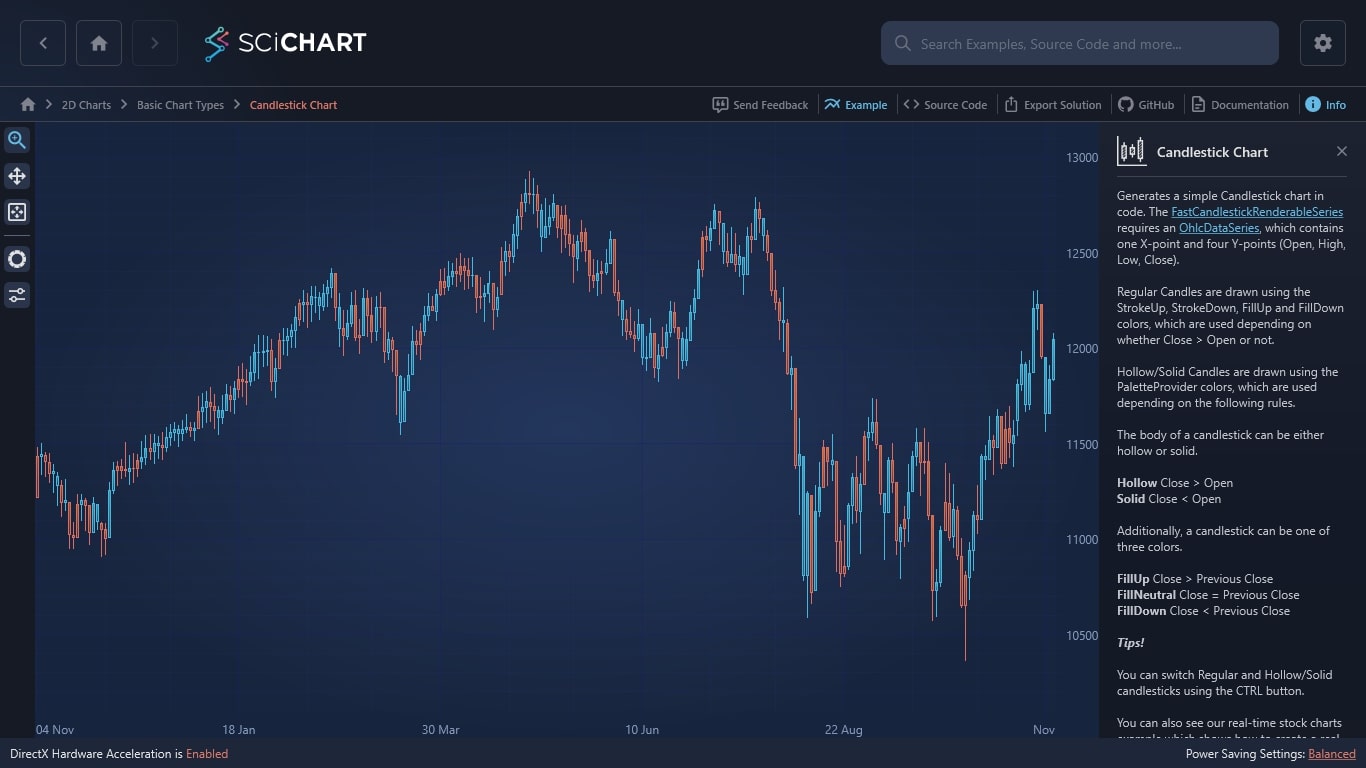
This WPF Candlestick Chart demonstrates a multi-series chart using the FastCandlestickRenderableSeries with three FastLineRenderableSeries showing the moving average of the closing price.
The example uses the CategoryDateTimeAxis which collapses overnight and weekend gaps in data, but uses the Index to the data to calculate X-position. This means that all DataSeries must have the same number of data-points (you can pad DataSeries using double.NaN for null or empty points).
SciChart’s award-winning WPF Chart Library offers the capacity for high-performance, fully customizable data visualizations that can support millions of data points. We also provide rapid-response support for developers to ensure all your enterprise-level chart dashboards are flawless and you can present the Best WPF Candlestick Chart Analysis Apps.
Example Usage:
- ZoomPan, left-mouse drag to pan the chart
- Mousewheel, roll the mousewheel to zoom
- ZoomExtents, double click to zoom to extents
Tip!
To get the effect of hiding the line for the first N points of a moving average, you can insert double.NaN into the XyDataSeries. double.NaN can be used to render gaps or continuous lines.
Documentation Links
- FastCandlestickRenderableSeries Type
- OhlcDataSeries Type
- CategoryDateTimeAxis vs. NumericAxis
- RenderableSeries API
Ready to start building high performance data visualization dashboards and web applications? Read our Getting Started guide:
- Begin your free trial
- Create charts with tutorials
- Compile example source code
- Access documentation
Sign-up for your 30-day free trial of SciChart.WPF. No credit card details are required. We’re recommended by 98% of our customers and are the charting software of choice for top enterprise-level businesses.
Get started with your free trial today!
Why use SciChart?
- Winner of the Queen’s Award for Innovation
- Fast rendering for real-time data feeds
- Extensive features & customizations
- 5-star rated support for developers
- 98% of customers recommend SciChart
Frequently Asked Questions
How can SciChart help us create the best WPF Candlestick Charts?
We’re the fastest WPF chart library, and that means you can create fully customizable and high performance candlestick charts for all your web applications.
How does your free trial work?
Our free WPF Chart Library trial lasts for 30 days and each licence is designed for one developer on your team. No credit cards are required – simply sign-up, choose your licence and follow our download instructions.
Can one licence be used on multiple devices?
Yes – you can install the licence on your laptop and desktop computer. As long as these are being used by one developer and not at the same time. Refer to our licensing FAQ page for more information.

The C#/WPF source code for the WPF Candlestick Chart example is included below (Scroll down!).
Did you know you can also view the source code from one of the following sources as well?
- Clone the SciChart.WPF.Examples from Github.
- Or, view source in the SciChart WPF Examples suite.
- Also the SciChart WPF Trial contains the full source for the examples (link below).
