WPF Chart - Examples
SciChart WPF ships with hundreds of WPF Chart Examples which you can browse, play with, view the source-code and even export each WPF Chart Example to a stand-alone Visual Studio solution. All of this is possible with the new and improved SciChart WPF Examples Suite, which ships as part of the SciChart WPF SDK.
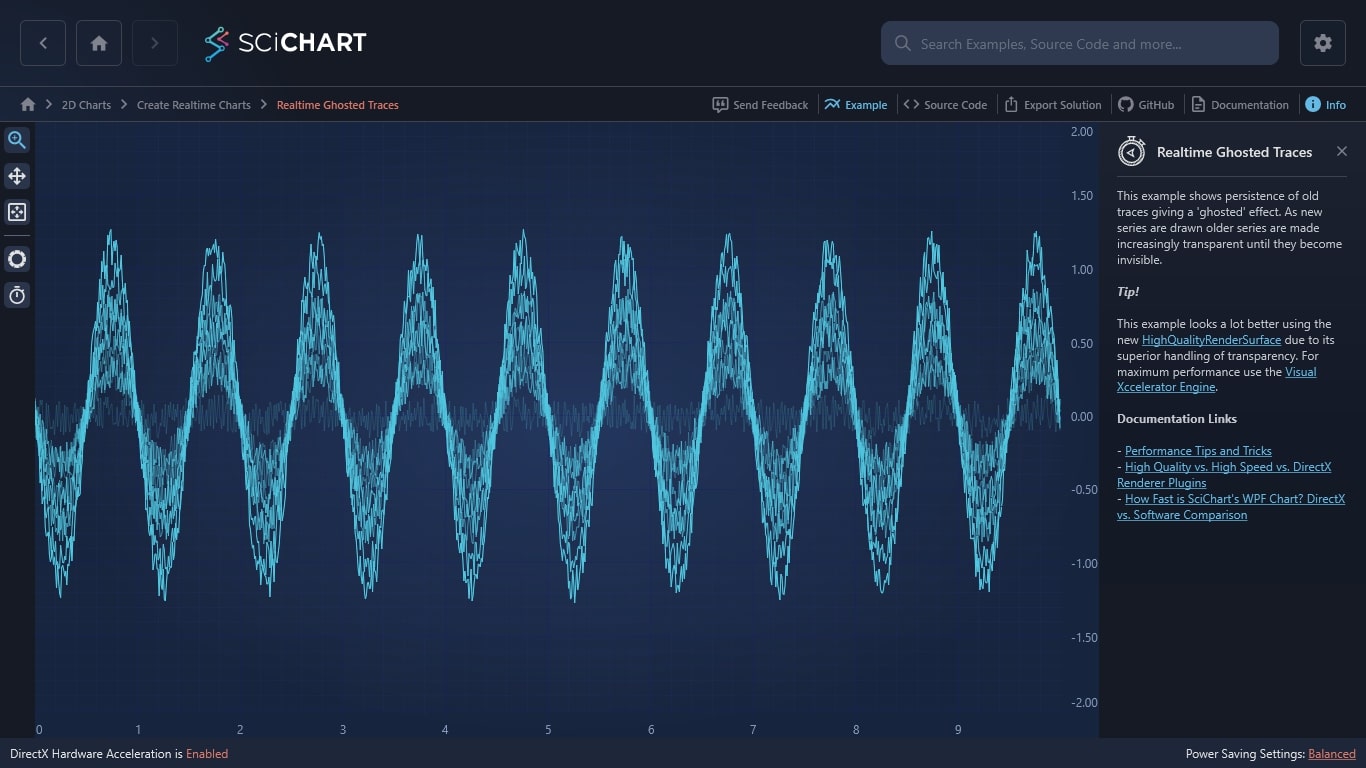
This example shows persistence of old traces giving a ‘ghosted’ effect. As new series are drawn older series are made increasingly transparent until they become invisible.
Tip!
This example looks a lot better using the new HighQualityRenderSurface due to its superior handling of transparency. For maximum performance use the Visual Xccelerator Engine.
Documentation Links
– Performance Tips and Tricks
– High Quality vs. High Speed vs. DirectX Renderer Plugins
– How Fast is SciChart’s WPF Chart? DirectX vs. Software Comparison

The C#/WPF source code for the WPF Chart Realtime Ghosted Traces example is included below (Scroll down!).
Did you know you can also view the source code from one of the following sources as well?
- Clone the SciChart.WPF.Examples from Github.
- Or, view source in the SciChart WPF Examples suite.
- Also the SciChart WPF Trial contains the full source for the examples (link below).
RealTimeGhostedTraces.xaml
View source code<UserControl x:Class="SciChart.Examples.Examples.CreateRealtimeChart.RealTimeGhostedTraces"
xmlns="http://schemas.microsoft.com/winfx/2006/xaml/presentation"
xmlns:x="http://schemas.microsoft.com/winfx/2006/xaml"
xmlns:ext="http://schemas.abtsoftware.co.uk/scichart/exampleExternals"
xmlns:s="http://schemas.abtsoftware.co.uk/scichart"
Loaded="OnExampleLoaded"
Unloaded="OnExampleUnloaded"
xmlns:mc="http://schemas.openxmlformats.org/markup-compatibility/2006"
xmlns:d="http://schemas.microsoft.com/expression/blend/2008"
d:DesignHeight="400"
d:DesignWidth="600"
mc:Ignorable="d">
<UserControl.Resources>
<!-- Used by the hint annotation, hides if if the user selects high quality renderer -->
<ext:TrueIfValueConverter x:Key="TrueIfValueConverter" Value="SciChart.Rendering.HighQualityRasterizer.HighQualityRenderSurface" />
<Color x:Key="Stroke">#FF279B27</Color>
</UserControl.Resources>
<Grid>
<Grid.ColumnDefinitions>
<ColumnDefinition Width="Auto" />
<ColumnDefinition Width="*" />
</Grid.ColumnDefinitions>
<!-- The SciChartInteractionToolbar adds zoom, pan, zoom extents and rotate functionality -->
<!-- to the chart and is included for example purposes. -->
<!-- If you wish to know how to zoom and pan a chart then do a search for Zoom Pan in the Examples suite! -->
<ext:SciChartInteractionToolbar TargetSurface="{Binding Source={x:Reference Name=sciChart}}" >
<ext:FlyoutMenuButton Style="{StaticResource FlyoutMenuButtonStyle}" Content="TMR" Padding="0">
<ext:FlyoutMenuButton.PopupContent>
<StackPanel Orientation="Vertical" MinWidth="150" Margin="0,0,0,4">
<TextBlock Margin="5" >
<Run Text="Timer Speed ("/><Run Text="{Binding Source={x:Reference Name=Slider}, Path=Value, StringFormat=\{0:0.0\}}" /><Run Text="ms" /><Run Text=")"/>
</TextBlock>
<ext:FlyoutSeparator/>
<Slider x:Name="Slider"
Margin="4"
Maximum="500"
Minimum="20"
ValueChanged="Slider_OnValueChanged"
Value="20" />
</StackPanel>
</ext:FlyoutMenuButton.PopupContent>
</ext:FlyoutMenuButton>
</ext:SciChartInteractionToolbar>
<s:SciChartSurface x:Name="sciChart"
Grid.Column="1"
RenderPriority="Low">
<!-- 10 RenderableSeries with decreasing opacity, which will be bound to our shifting window of DataSeries -->
<s:SciChartSurface.RenderableSeries>
<s:FastLineRenderableSeries Stroke="{StaticResource Stroke}"/>
<s:FastLineRenderableSeries Stroke="{StaticResource Stroke}" Opacity="0.9" />
<s:FastLineRenderableSeries Stroke="{StaticResource Stroke}" Opacity="0.8" />
<s:FastLineRenderableSeries Stroke="{StaticResource Stroke}" Opacity="0.7" />
<s:FastLineRenderableSeries Stroke="{StaticResource Stroke}" Opacity="0.62" />
<s:FastLineRenderableSeries Stroke="{StaticResource Stroke}" Opacity="0.55" />
<s:FastLineRenderableSeries Stroke="{StaticResource Stroke}" Opacity="0.45" />
<s:FastLineRenderableSeries Stroke="{StaticResource Stroke}" Opacity="0.35" />
<s:FastLineRenderableSeries Stroke="{StaticResource Stroke}" Opacity="0.25" />
<s:FastLineRenderableSeries Stroke="{StaticResource Stroke}" Opacity="0.15" />
</s:SciChartSurface.RenderableSeries>
<s:SciChartSurface.XAxis>
<s:NumericAxis AutoRange="Always" />
</s:SciChartSurface.XAxis>
<s:SciChartSurface.YAxis>
<s:NumericAxis AutoRange="Never"
DrawMajorBands="True"
TextFormatting="0.00"
VisibleRange="-2.0, 2.0" />
</s:SciChartSurface.YAxis>
</s:SciChartSurface>
</Grid>
</UserControl>
RealTimeGhostedTraces.xaml.cs
View source code// *************************************************************************************
// SCICHART® Copyright SciChart Ltd. 2011-2022. All rights reserved.
//
// Web: http://www.scichart.com
// Support: support@scichart.com
// Sales: sales@scichart.com
//
// RealTimeGhostedTraces.xaml.cs is part of the SCICHART® Examples. Permission is hereby granted
// to modify, create derivative works, distribute and publish any part of this source
// code whether for commercial, private or personal use.
//
// The SCICHART® examples are distributed in the hope that they will be useful, but
// without any warranty. It is provided "AS IS" without warranty of any kind, either
// expressed or implied.
// *************************************************************************************
using System;
using System.Windows;
using System.Windows.Controls;
using System.Windows.Threading;
using SciChart.Charting.Model.DataSeries;
using SciChart.Examples.ExternalDependencies.Data;
namespace SciChart.Examples.Examples.CreateRealtimeChart
{
public partial class RealTimeGhostedTraces : UserControl
{
private readonly CircularBuffer<UniformXyDataSeries<double>> _dataSeries = new CircularBuffer<UniformXyDataSeries<double>>(10);
private double _lastAmplitude = 1.0;
private DispatcherTimer _timer;
private readonly Random _random = new Random();
public RealTimeGhostedTraces()
{
InitializeComponent();
}
/// <summary>
/// Every X milliseconds we create a new DataSeries and append new data to it. We also enqueue this into a circular buffer of 10 Data-Series.
/// Then, all the DataSeries are re-assigned to RenderableSeries with varying opacity. This gives the impression of a trace 'ghosting' - becoming
/// more transparent as time elapses.
/// </summary>
private void TimerOnElapsed(object sender, EventArgs e)
{
var newDataSeries = new UniformXyDataSeries<double>(0d, 0.01);
// Create a noisy sine wave and cache
// All this code is about the generation of data to create a nice randomized sine wave with
// varying phase and amplitude
double randomAmplitude = Constrain(_lastAmplitude + (_random.NextDouble() - 0.50), -2.0, 2.0);
const double phase = 0.0;
var noisySineWave = DataManager.Instance.GetNoisySinewaveYData(randomAmplitude, phase, 1000, 0.25);
_lastAmplitude = randomAmplitude;
// Append to a new dataseries
newDataSeries.Append(noisySineWave);
// Enqueue to the circular buffer
_dataSeries.Add(newDataSeries);
// Reassign all DataSeries to RenderableSeries
ReassignRenderableSeries(_dataSeries);
}
private static double Constrain(double value, double noLowerThan, double noBiggerThan)
{
return Math.Max(Math.Min(value, noBiggerThan), noLowerThan);
}
/// <summary>
/// This method shifts all the data series, e.g. if you have RenderableSeries 0-9 and DataSeries 0-9, after
/// a shift Dataseries 1-10 will be applied to renderableseries 0-9
/// </summary>
/// <param name="dataSeries"></param>
private void ReassignRenderableSeries(CircularBuffer<UniformXyDataSeries<double>> dataSeries)
{
// Prevent redrawing while reassigning
using (sciChart.SuspendUpdates())
{
// Always the latest dataseries
if (dataSeries.Count > 0) sciChart.RenderableSeries[0].DataSeries = dataSeries[dataSeries.Count - 1];
if (dataSeries.Count > 1) sciChart.RenderableSeries[1].DataSeries = dataSeries[dataSeries.Count - 2];
if (dataSeries.Count > 2) sciChart.RenderableSeries[2].DataSeries = dataSeries[dataSeries.Count - 3];
if (dataSeries.Count > 3) sciChart.RenderableSeries[3].DataSeries = dataSeries[dataSeries.Count - 4];
if (dataSeries.Count > 4) sciChart.RenderableSeries[4].DataSeries = dataSeries[dataSeries.Count - 5];
if (dataSeries.Count > 5) sciChart.RenderableSeries[5].DataSeries = dataSeries[dataSeries.Count - 6];
if (dataSeries.Count > 6) sciChart.RenderableSeries[6].DataSeries = dataSeries[dataSeries.Count - 7];
if (dataSeries.Count > 7) sciChart.RenderableSeries[7].DataSeries = dataSeries[dataSeries.Count - 8];
if (dataSeries.Count > 8) sciChart.RenderableSeries[8].DataSeries = dataSeries[dataSeries.Count - 9];
// Always the oldest dataseries
if (dataSeries.Count > 9) sciChart.RenderableSeries[9].DataSeries = dataSeries[dataSeries.Count - 10];
}
}
private void Slider_OnValueChanged(object sender, RoutedPropertyChangedEventArgs<double> e)
{
if (_timer != null)
{
_timer.Interval = TimeSpan.FromMilliseconds(Slider.Value);
}
}
private void OnExampleLoaded(object sender, RoutedEventArgs e)
{
if (_timer == null)
{
_timer = new DispatcherTimer(DispatcherPriority.Render)
{
Interval = TimeSpan.FromMilliseconds(Slider.Value)
};
_timer.Tick += TimerOnElapsed;
_timer.Start();
}
}
private void OnExampleUnloaded(object sender, RoutedEventArgs e)
{
if (_timer != null)
{
_timer.Stop();
_timer.Tick -= TimerOnElapsed;
_timer = null;
}
}
}
}CircularBuffer.cs
View source code// *************************************************************************************
// SCICHART® Copyright SciChart Ltd. 2011-2022. All rights reserved.
//
// Web: http://www.scichart.com
// Support: support@scichart.com
// Sales: sales@scichart.com
//
// CircularBuffer.cs is part of the SCICHART® Examples. Permission is hereby granted
// to modify, create derivative works, distribute and publish any part of this source
// code whether for commercial, private or personal use.
//
// The SCICHART® examples are distributed in the hope that they will be useful, but
// without any warranty. It is provided "AS IS" without warranty of any kind, either
// expressed or implied.
// *************************************************************************************
using System;
using System.Collections.Generic;
namespace SciChart.Examples.Examples.CreateRealtimeChart
{
/// <summary>
/// Implements a simple FIFO buffer. This is used to store DataSeries in the RealTimeGhostedTraces example
/// e.g.
/// When Capacity = 5 and appending items 0, 1, 2, 3, 4 then indexes 0,1,2,3,4 resolve the 5 items
/// When Capacity = 5 and appending items 0, 1, 2, 3, 4, 5, 6 then indexes 0,1,2,3,4 resolve items 2, 3, 4, 5, 6
/// i.e. the first two items, 0 and 1, have been lost when the capacity is exceeded
/// </summary>
/// <typeparam name="T"></typeparam>
internal class CircularBuffer<T>
{
private readonly T[] _innerList;
private int _startIndex = -1;
public int Size { get; }
public int Count { get; internal set; }
public CircularBuffer(int size)
{
Size = size;
_innerList = new T[size];
}
public T Add(T item)
{
var index = NextIndex();
_innerList[index] = item;
Count = Math.Min(Count + 1, Size);
return item;
}
public IList<T> InnerList => _innerList;
public T this[int index] => GetItemAt(index);
private int NextIndex()
{
if (_startIndex >= 0 || Count == Size) //Now rotating
{
_startIndex = (_startIndex + 1) % Size;
if (_startIndex > Count)
_startIndex = Count;
return _startIndex;
}
return Count;
}
public T GetItemAt(int index)
{
ValidateIndex(index);
int i = ResolveIndex(index);
return _innerList[i];
}
private void ValidateIndex(int index)
{
if (index < 0 || index >= Count)
throw new IndexOutOfRangeException();
}
internal int ResolveIndex(int index)
{
if (_startIndex < 0)
{
return index;
}
return (_startIndex + 1 + index) % Count;
}
}
}