WPF Chart - Examples
SciChart WPF ships with hundreds of WPF Chart Examples which you can browse, play with, view the source-code and even export each WPF Chart Example to a stand-alone Visual Studio solution. All of this is possible with the new and improved SciChart WPF Examples Suite, which ships as part of the SciChart WPF SDK.
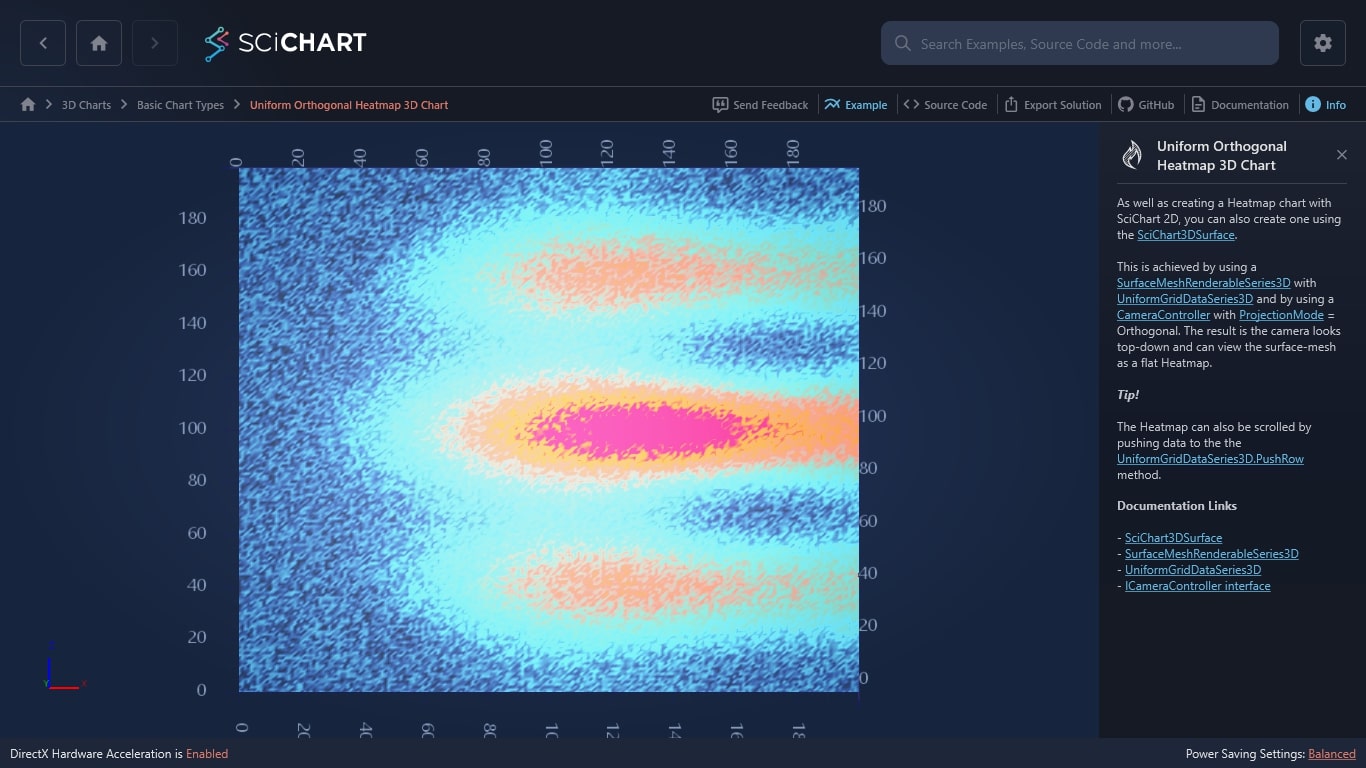
As well as creating a Heatmap chart with SciChart 2D, you can also create one using the SciChart3DSurface.
This is achieved by using a SurfaceMeshRenderableSeries3D with UniformGridDataSeries3D and by using a CameraController with ProjectionMode = Orthogonal. The result is the camera looks top-down and can view the surface-mesh as a flat Heatmap.
Tip!
The Heatmap can also be scrolled by pushing data to the the UniformGridDataSeries3D.PushRow method.
Documentation Links
– SciChart3DSurface
– SurfaceMeshRenderableSeries3D
– UniformGridDataSeries3D
– ICameraController interface.

The C#/WPF source code for the WPF 3D Chart Uniform Orthogonal Heatmap example is included below (Scroll down!).
Did you know you can also view the source code from one of the following sources as well?
- Clone the SciChart.WPF.Examples from Github.
- Or, view source in the SciChart WPF Examples suite.
- Also the SciChart WPF Trial contains the full source for the examples (link below).
Simple3DHeatmapChart.xaml
View source code<UserControl x:Class="SciChart.Examples.Examples.Charts3D.CreateA3DChart.Simple3DHeatmapChart"
xmlns="http://schemas.microsoft.com/winfx/2006/xaml/presentation"
xmlns:x="http://schemas.microsoft.com/winfx/2006/xaml"
xmlns:d="http://schemas.microsoft.com/expression/blend/2008"
xmlns:mc="http://schemas.openxmlformats.org/markup-compatibility/2006"
xmlns:s3D="http://schemas.abtsoftware.co.uk/scichart3D"
d:DesignHeight="400"
d:DesignWidth="600"
mc:Ignorable="d">
<UserControl.Resources>
<s3D:GradientColorPalette x:Key="ColorPalette" IsStepped="False">
<s3D:GradientColorPalette.GradientStops>
<GradientStop Offset="0" Color="DarkBlue" />
<GradientStop Offset="0.2" Color="CornflowerBlue" />
<GradientStop Offset="0.4" Color="DarkGreen" />
<GradientStop Offset="0.6" Color="Chartreuse" />
<GradientStop Offset="0.8" Color="Yellow" />
<GradientStop Offset="1" Color="Red" />
</s3D:GradientColorPalette.GradientStops>
</s3D:GradientColorPalette>
</UserControl.Resources>
<Grid>
<Grid.ColumnDefinitions>
<ColumnDefinition Width="Auto" />
<ColumnDefinition Width="*" />
</Grid.ColumnDefinitions>
<s3D:SciChart3DSurface x:Name="SciChart3DSurface"
Grid.Column="1"
BorderThickness="0"
MaxFrameRate="36"
RenderPriority="Normal"
WorldDimensions="200,100,200">
<s3D:SciChart3DSurface.Camera>
<s3D:Camera3D OrbitalPitch="90"
OrbitalYaw="90"
OrthoHeight="235"
OrthoWidth="355"
ProjectionMode="Orthogonal"
ZoomToFitOnAttach="True" />
</s3D:SciChart3DSurface.Camera>
<s3D:SciChart3DSurface.RenderableSeries>
<s3D:SurfaceMeshRenderableSeries3D x:Name="surfaceMesh"
HeightScaleFactor="0"
Maximum="200"
MeshColorPalette="{StaticResource ColorPalette}"
StrokeThickness="0" />
</s3D:SciChart3DSurface.RenderableSeries>
<s3D:SciChart3DSurface.XAxis>
<s3D:NumericAxis3D AutoRange="Always" VisibleRange="20,200" TextFormatting="0" PlaneBorderThickness="0" />
</s3D:SciChart3DSurface.XAxis>
<s3D:SciChart3DSurface.YAxis>
<s3D:NumericAxis3D AutoRange="Always" DrawLabels="False" TextFormatting="0" PlaneBorderThickness="0" />
</s3D:SciChart3DSurface.YAxis>
<s3D:SciChart3DSurface.ZAxis>
<s3D:NumericAxis3D AutoRange="Always" TextFormatting="0" PlaneBorderThickness="0" />
</s3D:SciChart3DSurface.ZAxis>
<s3D:SciChart3DSurface.ChartModifier>
<s3D:ModifierGroup3D>
<s3D:MouseWheelZoomModifier3D />
</s3D:ModifierGroup3D>
</s3D:SciChart3DSurface.ChartModifier>
</s3D:SciChart3DSurface>
</Grid>
</UserControl>Simple3DHeatmapChart.xaml.cs
View source code// *************************************************************************************
// SCICHART® Copyright SciChart Ltd. 2011-2022. All rights reserved.
//
// Web: http://www.scichart.com
// Support: support@scichart.com
// Sales: sales@scichart.com
//
// Simple3DHeatmapChart.xaml.cs is part of the SCICHART® Examples. Permission is hereby granted
// to modify, create derivative works, distribute and publish any part of this source
// code whether for commercial, private or personal use.
//
// The SCICHART® examples are distributed in the hope that they will be useful, but
// without any warranty. It is provided "AS IS" without warranty of any kind, either
// expressed or implied.
// *************************************************************************************
using System;
using System.Windows.Controls;
using SciChart.Charting3D.Model;
namespace SciChart.Examples.Examples.Charts3D.CreateA3DChart
{
/// <summary>
/// Interaction logic for OrthogonalHeatmap3DChart.xaml
/// </summary>
public partial class Simple3DHeatmapChart : UserControl
{
// A drop in replacement for System.Random which is 3x faster: https://www.codeproject.com/Articles/9187/A-fast-equivalent-for-System-Random
private readonly Random _random = new Random();
private const int XSize = 200;
private const int ZSize = 200;
private const double Angle = Math.PI * 2 * 20 / 30;
private const int Cx = 150;
private const int Cy = 100;
public Simple3DHeatmapChart()
{
InitializeComponent();
var meshDataSeries = new UniformGridDataSeries3D<double>(XSize, ZSize) { StepX = 1, StepZ = 1 };
for (var x = 0; x < XSize; x++)
{
for (var z = 0; z < ZSize; z++)
{
var v = (1 + Math.Sin(x * 0.04 + Angle)) * 50 + (1 + Math.Sin(z * 0.1 + Angle)) * 50 * (1 + Math.Sin(Angle * 2));
var r = Math.Sqrt((x - Cx) * (x - Cx) + (z - Cy) * (z - Cy));
var exp = Math.Max(0, 1 - r * 0.008);
meshDataSeries[z, x] = (v * exp + _random.NextDouble() * 50);
}
}
//Trace.WriteLine(meshDataSeries.To2DArray().ToStringArray2D());
surfaceMesh.DataSeries = meshDataSeries;
}
}
}