WPF Chart - Examples
SciChart WPF ships with hundreds of WPF Chart Examples which you can browse, play with, view the source-code and even export each WPF Chart Example to a stand-alone Visual Studio solution. All of this is possible with the new and improved SciChart WPF Examples Suite, which ships as part of the SciChart WPF SDK.
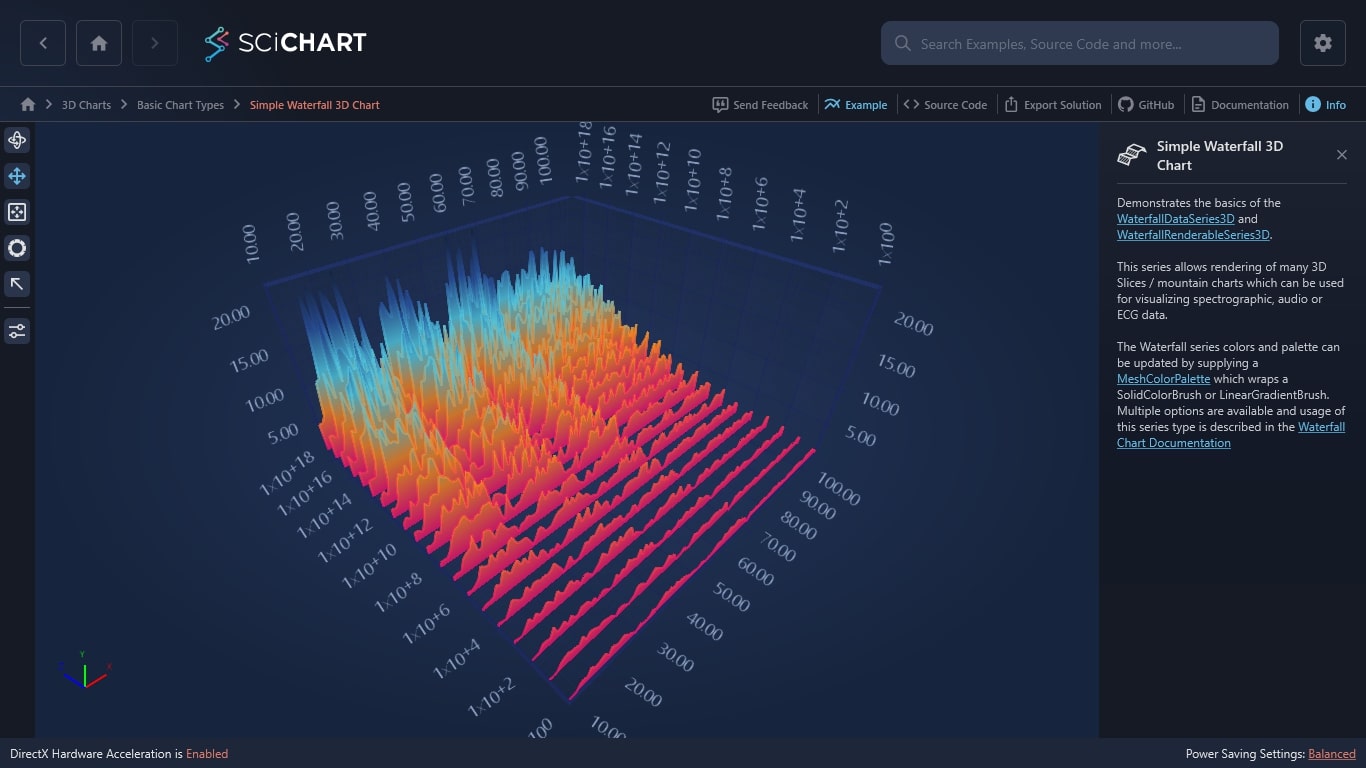
Demonstrates the basics of the WaterfallDataSeries3D and WaterfallRenderableSeries3D.
This series allows rendering of many 3D Slices / mountain charts which can be used for visualizing spectrographic, audio or ECG data.
The Waterfall series colors and palette can be updated by supplying a MeshColorPalette which wraps a SolidColorBrush or LinearGradientBrush. Multiple options are available and usage of this series type is described in the Waterfall Chart Documentation

The C#/WPF source code for the WPF 3D Waterfall Chart Example example is included below (Scroll down!).
Did you know you can also view the source code from one of the following sources as well?
- Clone the SciChart.WPF.Examples from Github.
- Or, view source in the SciChart WPF Examples suite.
- Also the SciChart WPF Trial contains the full source for the examples (link below).
CreateAWaterfall3DChart.xaml
View source code<UserControl x:Class="SciChart.Examples.Examples.Charts3D.CreateA3DChart.CreateAWaterfall3DChart"
xmlns="http://schemas.microsoft.com/winfx/2006/xaml/presentation"
xmlns:x="http://schemas.microsoft.com/winfx/2006/xaml"
xmlns:mc="http://schemas.openxmlformats.org/markup-compatibility/2006"
xmlns:d="http://schemas.microsoft.com/expression/blend/2008"
xmlns:s3D="http://schemas.abtsoftware.co.uk/scichart3D"
xmlns:ext="http://schemas.abtsoftware.co.uk/scichart/exampleExternals"
mc:Ignorable="d"
d:DesignHeight="400"
d:DesignWidth="600">
<Grid>
<Grid.Resources>
<s3D:SpherePointMarker3D x:Key="PointMarker" Size="5" Fill="Blue" />
<s3D:GradientColorPalette x:Key="ExampleGradientColorPalette" IsStepped="False">
<s3D:GradientColorPalette.GradientStops>
<GradientStop Offset="0.00" Color="Red"/>
<GradientStop Offset="0.25" Color="Orange"/>
<GradientStop Offset="0.50" Color="Yellow"/>
<GradientStop Offset="0.75" Color="Green"/>
<GradientStop Offset="1.00" Color="DarkGreen"/>
</s3D:GradientColorPalette.GradientStops>
</s3D:GradientColorPalette>
<s3D:SolidColorBrushPalette x:Key="TransparentColorPalette" Fill="Transparent"/>
<s3D:SolidColorBrushPalette x:Key="SolidFillColorPalette" Fill="#AA00BFFF"/>
<s3D:SolidColorBrushPalette x:Key="SolidStrokeColorPalette" Fill="LimeGreen"/>
<s3D:GradientColorPalette x:Key="ExampleStrokeColorPalette" IsStepped="False">
<s3D:GradientColorPalette.GradientStops>
<GradientStop Offset="0.00" Color="Crimson"/>
<GradientStop Offset="0.33" Color="DarkOrange"/>
<GradientStop Offset="0.67" Color="LimeGreen"/>
<GradientStop Offset="1.00" Color="LimeGreen"/>
</s3D:GradientColorPalette.GradientStops>
</s3D:GradientColorPalette>
</Grid.Resources>
<Grid.ColumnDefinitions>
<ColumnDefinition Width="Auto" />
<ColumnDefinition Width="*" />
</Grid.ColumnDefinitions>
<!-- The SciChart3DInteractionToolbar adds rotate, orbit, zoom, pan, zoom extents functionality -->
<!-- to the chart and is included for example purposes. -->
<!-- If you wish to know how to zoom and pan a 3D chart then do a search for Zoom Pan in the Examples suite! -->
<ext:SciChart3DInteractionToolbar TargetSurface="{Binding Source={x:Reference Name=SciChart}}">
<ext:FlyoutSeparator/>
<ext:FlyoutMenuButton Style="{StaticResource FlyoutMenuButtonStyle}"
Content="CTRL"
FontSize="10"
Padding="0">
<ext:FlyoutMenuButton.PopupContent>
<StackPanel Grid.Row="0" MinWidth="150" Orientation="Vertical">
<!-- Check boxes to decide how the chart should be filled -->
<TextBlock FontSize="12" Text="Stroke ColorPalette:" />
<RadioButton FontSize="12" Margin="4" Style="{StaticResource CheckRadioBtn}" Content="Gradient Stroke Y" x:Name="ckbStrokeY" IsChecked="True" GroupName="StrokePaletteFillDirection"/>
<RadioButton FontSize="12" Margin="4" Style="{StaticResource CheckRadioBtn}" Content="Gradient Stroke Z" x:Name="ckbStrokeZ" GroupName="StrokePaletteFillDirection"/>
<RadioButton FontSize="12" Margin="4" Style="{StaticResource CheckRadioBtn}" Content="Solid Color (Green)" x:Name="ckbStrokeSolidColor" GroupName="StrokePaletteFillDirection"/>
<RadioButton FontSize="12" Margin="4" Style="{StaticResource CheckRadioBtn}" Content="None (Transparent)" x:Name="ckbStrokeTransparent" GroupName="StrokePaletteFillDirection"/>
<ext:FlyoutSeparator/>
<!-- Check boxes to decide how the chart should be filled -->
<TextBlock FontSize="12" Text="GradientFill Direction:" />
<RadioButton FontSize="12" Margin="4" Style="{StaticResource CheckRadioBtn}" Content="Gradient Fill Y Axis" x:Name="ckbFillY" IsChecked="True" GroupName="GradientFillDirection"/>
<RadioButton FontSize="12" Margin="4" Style="{StaticResource CheckRadioBtn}" Content="Gradient Fill Z Axis" x:Name="ckbFillZ" GroupName="GradientFillDirection"/>
<RadioButton FontSize="12" Margin="4" Style="{StaticResource CheckRadioBtn}" Content="Solid Color Fill (Blue)" x:Name="ckbFillSolid" GroupName="GradientFillDirection"/>
<RadioButton FontSize="12" Margin="4" Style="{StaticResource CheckRadioBtn}" Content="None (Transparent)" x:Name="ckbFillTransparent" GroupName="GradientFillDirection"/>
<ext:FlyoutSeparator/>
<CheckBox FontSize="12" Margin="4" Content="Is Volumetric?" x:Name="ckbIsVolumetric"/>
<CheckBox FontSize="12" Margin="4" Content="Show PointMarkers?" x:Name="ckbShowPointMarkers">
<CheckBox.Style>
<Style TargetType="{x:Type CheckBox}" BasedOn="{StaticResource {x:Type CheckBox}}">
<Style.Triggers>
<DataTrigger Binding="{Binding IsChecked, Source={x:Reference ckbIsVolumetric}}" Value="True">
<Setter Property="IsChecked" Value="False"/>
<Setter Property="IsEnabled" Value="False"/>
</DataTrigger>
</Style.Triggers>
</Style>
</CheckBox.Style>
</CheckBox>
</StackPanel>
</ext:FlyoutMenuButton.PopupContent>
</ext:FlyoutMenuButton>
</ext:SciChart3DInteractionToolbar>
<s3D:SciChart3DSurface x:Name="SciChart"
Grid.Column="1"
WorldDimensions="200,100,200">
<s3D:SciChart3DSurface.Camera>
<s3D:Camera3D ZoomToFitOnAttach="True" />
</s3D:SciChart3DSurface.Camera>
<s3D:SciChart3DSurface.RenderableSeries>
<s3D:WaterfallRenderableSeries3D x:Name="WaterfallSeries">
<!-- This style is used to demonstrate different properties and their effects in the waterfall chart -->
<!-- You don't need a style, you can just set the properties above as attributes -->
<!-- In our example, we set the default properties for PointMarker, Y/ZStrokeColorMapping, Y/ZColorMapping to null. -->
<!-- These are changed by user controls declared above in the example -->
<s3D:WaterfallRenderableSeries3D.Style>
<Style TargetType="s3D:WaterfallRenderableSeries3D">
<!-- The Stroke is not applied to the WaterfallRenderableSeries3D. This color is used for Tooltip (Background) binding -->
<Setter Property="Stroke" Value="#AA228B22" />
<Setter Property="Opacity" Value="0.8" />
<Setter Property="StrokeThickness" Value="2" />
<Setter Property="SliceThickness" Value="0" />
<Setter Property="YStrokeColorMapping" Value="{x:Null}" />
<Setter Property="ZStrokeColorMapping" Value="{x:Null}" />
<Setter Property="ZColorMapping" Value="{x:Null}" />
<Setter Property="YColorMapping" Value="{x:Null}" />
<Style.Triggers>
<!-- The YStrokeColorMapping applies a BrushColorPalette (Solid or Gradient brush)to the stroke in the Y direction -->
<DataTrigger Binding="{Binding IsChecked, Source={x:Reference ckbStrokeY}}" Value="True">
<Setter Property="YStrokeColorMapping" Value="{StaticResource ExampleStrokeColorPalette}"/>
</DataTrigger>
<!-- The ZStrokeColorMapping applies a BrushColorPalette to the stroke in the Z direction -->
<DataTrigger Binding="{Binding IsChecked, Source={x:Reference ckbStrokeZ}}" Value="True">
<Setter Property="ZStrokeColorMapping" Value="{StaticResource ExampleStrokeColorPalette}"/>
</DataTrigger>
<!-- When ckbStrkTransparent is checked, we set both strokes to transparent to give a clearer view of the fill -->
<DataTrigger Binding="{Binding IsChecked, Source={x:Reference ckbStrokeTransparent}}" Value="True">
<Setter Property="ZStrokeColorMapping" Value="{StaticResource TransparentColorPalette}"/>
<Setter Property="YStrokeColorMapping" Value="{StaticResource TransparentColorPalette}"/>
</DataTrigger>
<!-- When ckbStrkSolid is checked, we set both strokes to a solid color brush -->
<DataTrigger Binding="{Binding IsChecked, Source={x:Reference ckbStrokeSolidColor}}" Value="True">
<Setter Property="ZStrokeColorMapping" Value="{StaticResource SolidStrokeColorPalette}"/>
<Setter Property="YStrokeColorMapping" Value="{StaticResource SolidStrokeColorPalette}"/>
</DataTrigger>
<!-- The YColorMapping applies a BrushColorPalette to the fill in the Y direction -->
<DataTrigger Binding="{Binding IsChecked, Source={x:Reference ckbFillY}}" Value="True">
<Setter Property="YColorMapping" Value="{StaticResource ExampleGradientColorPalette}"/>
</DataTrigger>
<!-- The ZColorMapping applies a BrushColorPalette to the fill in the Z direction -->
<DataTrigger Binding="{Binding IsChecked, Source={x:Reference ckbFillZ}}" Value="True">
<Setter Property="ZColorMapping" Value="{StaticResource ExampleGradientColorPalette}"/>
</DataTrigger>
<!-- When ckbFillTransparent is checked, we set both fills to transparent to give a clearer view of the stroke -->
<DataTrigger Binding="{Binding IsChecked, Source={x:Reference ckbFillTransparent}}" Value="True">
<Setter Property="YColorMapping" Value="{StaticResource TransparentColorPalette}"/>
<Setter Property="ZColorMapping" Value="{StaticResource TransparentColorPalette}"/>
</DataTrigger>
<!-- When ckbFillSolid is checked, we set both fills to transparent to give a clearer view of the stroke -->
<DataTrigger Binding="{Binding IsChecked, Source={x:Reference ckbFillSolid}}" Value="True">
<Setter Property="YColorMapping" Value="{StaticResource SolidFillColorPalette}"/>
<Setter Property="ZColorMapping" Value="{StaticResource SolidFillColorPalette}"/>
</DataTrigger>
<!-- The PointMarker property applies a 3-dimensional point marker to points on each slice -->
<DataTrigger Binding="{Binding IsChecked, Source={x:Reference ckbShowPointMarkers}}" Value="True">
<Setter Property="PointMarker" Value="{StaticResource PointMarker}"/>
</DataTrigger>
<!-- When SliceThickness is set, the waterfall slices become volumetric -->
<DataTrigger Binding="{Binding IsChecked, Source={x:Reference ckbIsVolumetric}}" Value="True">
<!-- SliceThickness is used to define the thickness of waterfall slices -->
<Setter Property="SliceThickness" Value="6"/>
<!-- PointMarker isn't allowed with volumetric waterfall -->
<Setter Property="PointMarker" Value="{x:Null}"/>
</DataTrigger>
</Style.Triggers>
</Style>
</s3D:WaterfallRenderableSeries3D.Style>
</s3D:WaterfallRenderableSeries3D>
</s3D:SciChart3DSurface.RenderableSeries>
<s3D:SciChart3DSurface.XAxis>
<s3D:NumericAxis3D/>
</s3D:SciChart3DSurface.XAxis>
<s3D:SciChart3DSurface.YAxis>
<s3D:NumericAxis3D/>
</s3D:SciChart3DSurface.YAxis>
<s3D:SciChart3DSurface.ZAxis>
<s3D:LogarithmicNumericAxis3D TextFormatting="#.#E+0"
LogarithmicBase="10"
AutoRange="Always"
ScientificNotation="LogarithmicBase"/>
</s3D:SciChart3DSurface.ZAxis>
<s3D:SciChart3DSurface.ChartModifier>
<s3D:VertexSelectionModifier3D />
</s3D:SciChart3DSurface.ChartModifier>
</s3D:SciChart3DSurface>
</Grid>
</UserControl>CreateAWaterfall3DChart.xaml.cs
View source codeusing System;
using System.Windows;
using System.Windows.Controls;
using SciChart.Charting3D.Model.DataSeries.Waterfall;
using SciChart.Examples.ExternalDependencies.Data;
namespace SciChart.Examples.Examples.Charts3D.CreateA3DChart
{
/// <summary>
/// Interaction logic for CreateAContouredChart.xaml
/// </summary>
public partial class CreateAWaterfall3DChart : UserControl
{
private readonly FFT2 _transform = new FFT2();
private readonly Random _random = new Random();
public CreateAWaterfall3DChart()
{
InitializeComponent();
Loaded += OnLoaded;
}
private void OnLoaded(object sender, RoutedEventArgs routedEventArgs)
{
var pointsPerSlice = 100;
var sliceCount = 20;
var logBase = 10;
var slicePositions = new double[sliceCount];
for (int i = 0; i < sliceCount; ++i)
{
slicePositions[i] = Math.Pow(logBase, i);
}
var dataSeries = new WaterfallDataSeries3D<double>(pointsPerSlice, slicePositions)
{
SeriesName = "Waterfall",
StartX = 10,
StepX = 1
};
_transform.init((uint)Math.Log(pointsPerSlice, 2));
FillDataSeries(dataSeries, sliceCount, pointsPerSlice);
WaterfallSeries.DataSeries = dataSeries;
}
private void FillDataSeries(WaterfallDataSeries3D<double> dataSeries, int sliceCount, int pointsPerSlice)
{
var count = pointsPerSlice * 2;
var re = new double[count];
var im = new double[count];
for (int sliceIndex = 0; sliceIndex < sliceCount; ++sliceIndex)
{
for (var i = 0; i < count; i++)
{
re[i] = 2.0 * Math.Sin(2 * Math.PI * i / 20) +
5 * Math.Sin(2 * Math.PI * i / 10) +
2.0 * _random.NextDouble();
im[i] = -10;
}
_transform.run(re, im);
var scaleCoef = Math.Pow(1.5, sliceIndex * 0.3) / Math.Pow(1.5, sliceCount * 0.3);
for (var pointIndex = 0; pointIndex < pointsPerSlice; pointIndex++)
{
var mag = Math.Sqrt(re[pointIndex] * re[pointIndex] + im[pointIndex] * im[pointIndex]);
var yVal = _random.Next(10,20) * Math.Log10(mag / pointsPerSlice);
yVal = (yVal < -25 || yVal > -5)
? (yVal < -25) ? -25 : _random.Next(-6, -3)
: yVal;
dataSeries[sliceIndex, pointIndex] = -yVal * scaleCoef;
}
}
}
}
}