WPF Chart - Examples
SciChart WPF ships with hundreds of WPF Chart Examples which you can browse, play with, view the source-code and even export each WPF Chart Example to a stand-alone Visual Studio solution. All of this is possible with the new and improved SciChart WPF Examples Suite, which ships as part of the SciChart WPF SDK.
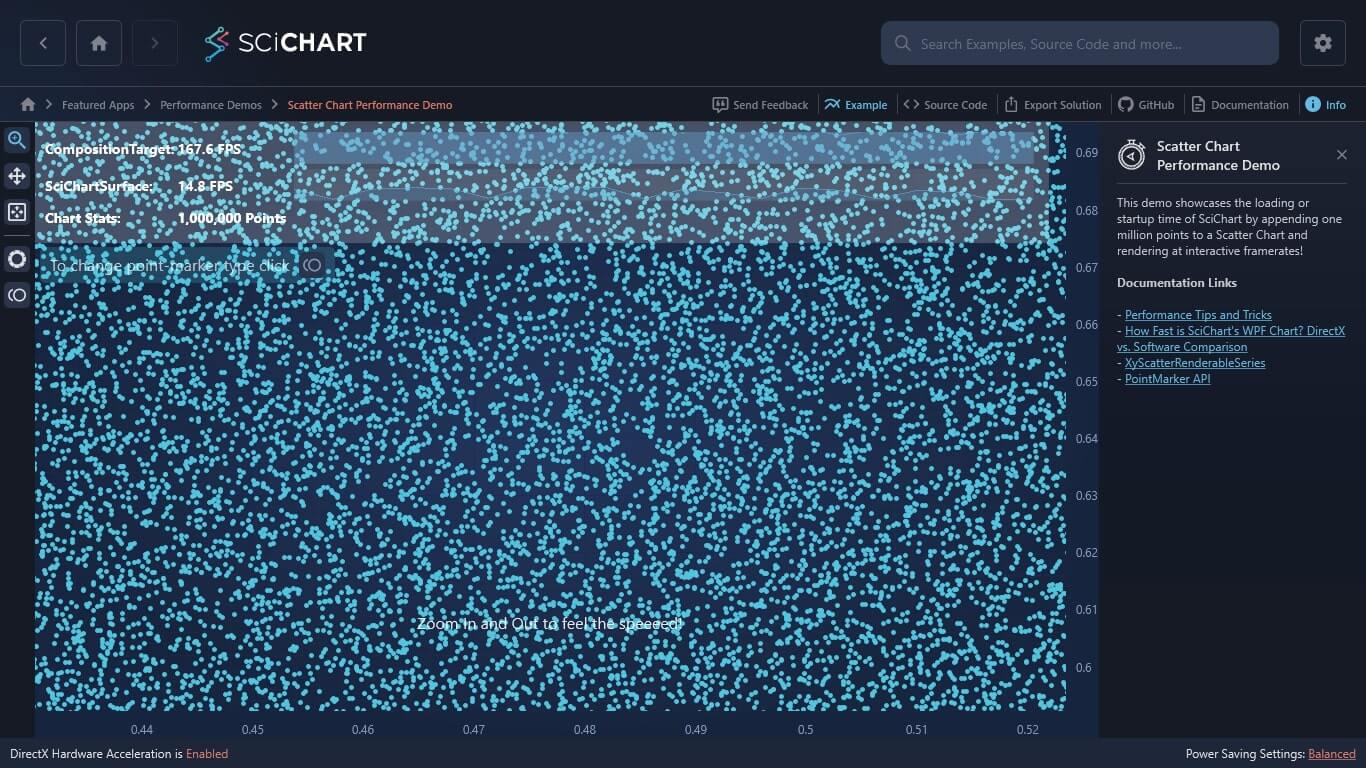
This demo showcases the loading or startup time of SciChart by appending one million points to a Scatter Chart and rendering at interactive framerates!
Documentation Links
– Performance Tips and Tricks
– How Fast is SciChart’s WPF Chart? DirectX vs. Software Comparison
– XyScatterRenderableSeries
– PointMarker API

The C#/WPF source code for the WPF Chart Scatter Chart Performance example is included below (Scroll down!).
Did you know you can also view the source code from one of the following sources as well?
- Clone the SciChart.WPF.Examples from Github.
- Or, view source in the SciChart WPF Examples suite.
- Also the SciChart WPF Trial contains the full source for the examples (link below).
ScatterChartPerformanceTest.xaml
View source code<UserControl x:Class="SciChart.Examples.Examples.PerformanceDemos2D.ScatterPerf.ScatterChartPerformanceTest"
xmlns="http://schemas.microsoft.com/winfx/2006/xaml/presentation"
xmlns:x="http://schemas.microsoft.com/winfx/2006/xaml"
xmlns:s="http://schemas.abtsoftware.co.uk/scichart"
xmlns:mc="http://schemas.openxmlformats.org/markup-compatibility/2006"
xmlns:d="http://schemas.microsoft.com/expression/blend/2008"
xmlns:ext="http://schemas.abtsoftware.co.uk/scichart/exampleExternals"
d:DesignHeight="400"
d:DesignWidth="600"
mc:Ignorable="d">
<Grid>
<Grid.ColumnDefinitions>
<ColumnDefinition Width="Auto"/>
<ColumnDefinition Width="*"/>
</Grid.ColumnDefinitions>
<!-- The SciChartInteractionToolbar adds zoom, pan, zoom extents and rotate functionality -->
<!-- to the chart and is included for example purposes. -->
<!-- If you wish to know how to zoom and pan a chart then do a search for Zoom Pan in the Examples suite! -->
<ext:SciChartInteractionToolbar TargetSurface="{Binding Source={x:Reference Name=sciChart}}">
<ext:FlyoutMenuButton Style="{StaticResource FlyoutMenuButtonStyle}" Content="PM" Padding="0">
<ext:FlyoutMenuButton.PopupContent>
<StackPanel Orientation="Vertical" MinWidth="150" Margin="0,0,0,4">
<TextBlock Text="Point Markers" />
<RadioButton GroupName="PointMarkersGroup" Margin="4" Style="{StaticResource CheckRadioBtn}" x:Name="ChkEllipse" Content="Ellipse" IsChecked="True"/>
<RadioButton GroupName="PointMarkersGroup" Margin="4" Style="{StaticResource CheckRadioBtn}" x:Name="ChkTriangle" Content="Triangle" />
<RadioButton GroupName="PointMarkersGroup" Margin="4" Style="{StaticResource CheckRadioBtn}" x:Name="ChkTriangleInverse" Content="Inverted Triangle" />
<RadioButton GroupName="PointMarkersGroup" Margin="4" Style="{StaticResource CheckRadioBtn}" x:Name="ChkSquare" Content="Square" />
<RadioButton GroupName="PointMarkersGroup" Margin="4" Style="{StaticResource CheckRadioBtn}" x:Name="ChkCross" Content="Cross" />
<RadioButton GroupName="PointMarkersGroup" Margin="4" Style="{StaticResource CheckRadioBtn}" x:Name="ChkX" Content="X" />
<RadioButton GroupName="PointMarkersGroup" Margin="4" Style="{StaticResource CheckRadioBtn}" x:Name="ChkSprite" Content="Sprite (Custom)" />
</StackPanel>
</ext:FlyoutMenuButton.PopupContent>
</ext:FlyoutMenuButton>
</ext:SciChartInteractionToolbar>
<s:SciChartSurface x:Name="sciChart" Grid.Column="1">
<s:SciChartSurface.RenderableSeries>
<s:XyScatterRenderableSeries x:Name="ellipseScatterSeries"
Stroke="CornflowerBlue"
IsVisible="{Binding Source={x:Reference Name=ChkEllipse}, Path=IsChecked, Mode=TwoWay}">
<s:XyScatterRenderableSeries.PointMarker>
<s:EllipsePointMarker Width="5" Height="5"/>
</s:XyScatterRenderableSeries.PointMarker>
</s:XyScatterRenderableSeries>
<s:XyScatterRenderableSeries x:Name="crossScatterSeries"
Stroke="BlueViolet"
IsVisible="{Binding Source={x:Reference Name=ChkCross}, Path=IsChecked, Mode=TwoWay}">
<s:XyScatterRenderableSeries.PointMarker>
<s:CrossPointMarker Width="5" Height="5"/>
</s:XyScatterRenderableSeries.PointMarker>
</s:XyScatterRenderableSeries>
<s:XyScatterRenderableSeries x:Name="xScatterSeries"
Stroke="DarkGray"
IsVisible="{Binding Source={x:Reference Name=ChkX}, Path=IsChecked, Mode=TwoWay}">
<s:XyScatterRenderableSeries.PointMarker>
<s:XPointMarker Width="5" Height="5"/>
</s:XyScatterRenderableSeries.PointMarker>
</s:XyScatterRenderableSeries>
<s:XyScatterRenderableSeries x:Name="squareScatterSeries"
Stroke="DarkOrange"
IsVisible="{Binding Source={x:Reference Name=ChkSquare}, Path=IsChecked, Mode=TwoWay}">
<s:XyScatterRenderableSeries.PointMarker>
<s:SquarePointMarker Width="5" Height="5"/>
</s:XyScatterRenderableSeries.PointMarker>
</s:XyScatterRenderableSeries>
<s:XyScatterRenderableSeries x:Name="triangleScatterSeries"
Stroke="Crimson"
IsVisible="{Binding Source={x:Reference Name=ChkTriangle}, Path=IsChecked, Mode=TwoWay}">
<s:XyScatterRenderableSeries.PointMarker>
<s:TrianglePointMarker Width="5" Height="5"/>
</s:XyScatterRenderableSeries.PointMarker>
</s:XyScatterRenderableSeries>
<s:XyScatterRenderableSeries x:Name="triangleInvScatterSeries"
Stroke="Coral"
IsVisible="{Binding Source={x:Reference Name=ChkTriangleInverse}, Path=IsChecked, Mode=TwoWay}">
<s:XyScatterRenderableSeries.PointMarker>
<s:InvertedTrianglePointMarker Width="5" Height="5"/>
</s:XyScatterRenderableSeries.PointMarker>
</s:XyScatterRenderableSeries>
<s:XyScatterRenderableSeries x:Name="spriteScatterSeries"
IsVisible="{Binding Source={x:Reference Name=ChkSprite}, Path=IsChecked, Mode=TwoWay}">
<s:XyScatterRenderableSeries.PointMarker>
<s:SpritePointMarker>
<s:SpritePointMarker.PointMarkerTemplate>
<ControlTemplate>
<!-- Custom point marker rendering an asterisk style using Canvas + Line -->
<Canvas Width="7" Height="7">
<Line StrokeThickness="1" Stroke="LimeGreen" X1="0" X2="7" Y1="0" Y2="7"/>
<Line StrokeThickness="1" Stroke="LimeGreen" X1="0" X2="7" Y1="7" Y2="0"/>
<Line StrokeThickness="1" Stroke="LimeGreen" X1="3.5" X2="3.5" Y1="7" Y2="0"/>
<Line StrokeThickness="1" Stroke="LimeGreen" X1="0" X2="7" Y1="3.5" Y2="3.5"/>
</Canvas>
</ControlTemplate>
</s:SpritePointMarker.PointMarkerTemplate>
</s:SpritePointMarker>
</s:XyScatterRenderableSeries.PointMarker>
</s:XyScatterRenderableSeries>
</s:SciChartSurface.RenderableSeries>
<s:SciChartSurface.XAxis>
<s:NumericAxis VisibleRange="0,1" GrowBy="0.2,0.2"/>
</s:SciChartSurface.XAxis>
<s:SciChartSurface.YAxis>
<s:NumericAxis VisibleRange="-1,1" GrowBy="0.15,0.4"/>
</s:SciChartSurface.YAxis>
<s:SciChartSurface.ChartModifier>
<s:ModifierGroup>
<s:MouseWheelZoomModifier/>
</s:ModifierGroup>
</s:SciChartSurface.ChartModifier>
<s:SciChartSurface.Annotations>
<s:CustomAnnotation CoordinateMode="Relative"
HorizontalAnchorPoint="Left"
VerticalAnchorPoint="Center"
Margin="10,150,0,0"
X1="0"
Y1="0" >
<StackPanel Orientation="Horizontal" Background="#80232323">
<TextBlock FontSize="20"
Opacity="0.7"
Margin="5,0"
Text="To change Point-Marker Type click"
Foreground="#FFF" />
<Image Width="32"
Height="32"
Margin="0,0,5,0"
Source="/SciChart.Examples;component/Resources/Images/point_marker_icon.png"
Stretch="None" />
</StackPanel>
</s:CustomAnnotation>
<s:TextAnnotation CoordinateMode="Relative"
X1="0.5" Y1="0.85"
Foreground="White"
FontSize="16"
Text="Zoom In and Out to feel the speeeed!"
HorizontalAnchorPoint="Center"
VerticalAnchorPoint="Center"
Opacity="0.9"/>
</s:SciChartSurface.Annotations>
</s:SciChartSurface>
<s:SciChartPerformanceOverlay Grid.Column="1"
Margin="0,0,50,0"
VerticalAlignment="Top"
Background="#33FFFFFF"
FontWeight="Bold"
Foreground="#FFF"
Padding="10"
IsHitTestVisible="False"
TargetSurface="{Binding Source={x:Reference Name=sciChart}}" />
</Grid>
</UserControl>ScatterChartPerformanceTest.xaml.cs
View source code// *************************************************************************************
// SCICHART® Copyright SciChart Ltd. 2011-2022. All rights reserved.
//
// Web: http://www.scichart.com
// Support: support@scichart.com
// Sales: sales@scichart.com
//
// ScatterChartPerformanceTest.xaml.cs is part of the SCICHART® Examples. Permission is hereby granted
// to modify, create derivative works, distribute and publish any part of this source
// code whether for commercial, private or personal use.
//
// The SCICHART® examples are distributed in the hope that they will be useful, but
// without any warranty. It is provided "AS IS" without warranty of any kind, either
// expressed or implied.
// *************************************************************************************
using System;
using System.Windows;
using System.Windows.Controls;
using SciChart.Charting.Model.DataSeries;
using SciChart.Charting.Visuals.RenderableSeries;
using SciChart.Core.Utility;
using SciChart.Examples.ExternalDependencies.Common;
namespace SciChart.Examples.Examples.PerformanceDemos2D.ScatterPerf
{
/// <summary>
/// Interaction logic for ScatterChartPerformanceTest.xaml
/// </summary>
public partial class ScatterChartPerformanceTest : UserControl
{
public ScatterChartPerformanceTest()
{
InitializeComponent();
Loaded += OnLoaded;
}
private void OnLoaded(object sender, RoutedEventArgs routedEventArgs)
{
// Create our data in another thread to stop the UI from being stalled.
// It's not appending to SciChart data series that is the problem, its Calling Rand.Next() two million times which is pretty slow :)
TimedMethod.Invoke(() =>
{
var dataSeries = new XyDataSeries<double, double>() {AcceptsUnsortedData = true};
var rand = new Random();
// Allow 1M points in WPF/DirectX. In Silverlight or software rendering, 100k points is enough to stress the renderer
int count = FeaturesHelper.Instance.SupportsHardwareAcceleration ? (int) 1E6 : (int) 1E5;
// Append some data
for (int i = 0; i < count; i++)
{
dataSeries.Append(rand.NextDouble(), rand.NextDouble());
}
// Bind to scichart
Action bindData = () => { BindData(dataSeries); };
Dispatcher.BeginInvoke(bindData);
}).After(200).OnThread(TimedMethodThread.Background).Go();
}
private void BindData(XyDataSeries<double, double> dataSeries)
{
// Must be called on UI thread, as DataSeries is a dependency property
// Note in MVVM you can bind RenderableSeries.DataSeries to a property in VM and update in any thread.
using (sciChart.SuspendUpdates())
{
foreach (var rSeries in sciChart.RenderableSeries)
{
rSeries.DataSeries = dataSeries;
}
}
sciChart.ZoomExtents();
}
private void Chk_OnChecked(object sender, RoutedEventArgs e)
{
sciChart?.InvalidateElement();
}
}
}